

Key Insights
The global phosphoric acid market is projected for substantial expansion, anticipated to reach $69.1 billion by 2025 and grow at a CAGR of 5.7% from 2025 to 2033. Key growth drivers include escalating fertilizer demand in agriculturally intensifying economies, driven by population growth. The food and beverage sector's use of phosphoric acid as an acidity regulator and additive, alongside its broad applications in water treatment and detergents within the chemical industry, further fuels market expansion. While raw material price volatility and environmental considerations from phosphate mining pose challenges, advancements in production efficiency and sustainability are expected to mitigate these issues. The Asia-Pacific region, led by China and India, is poised for significant growth, with competitive dynamics shaped by major players focusing on innovation and strategic alliances.
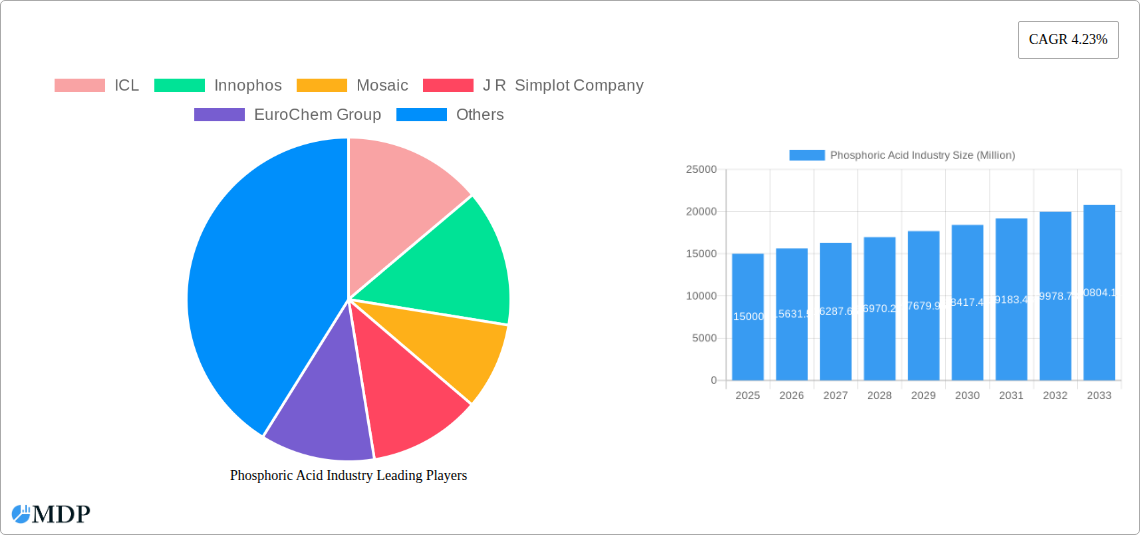
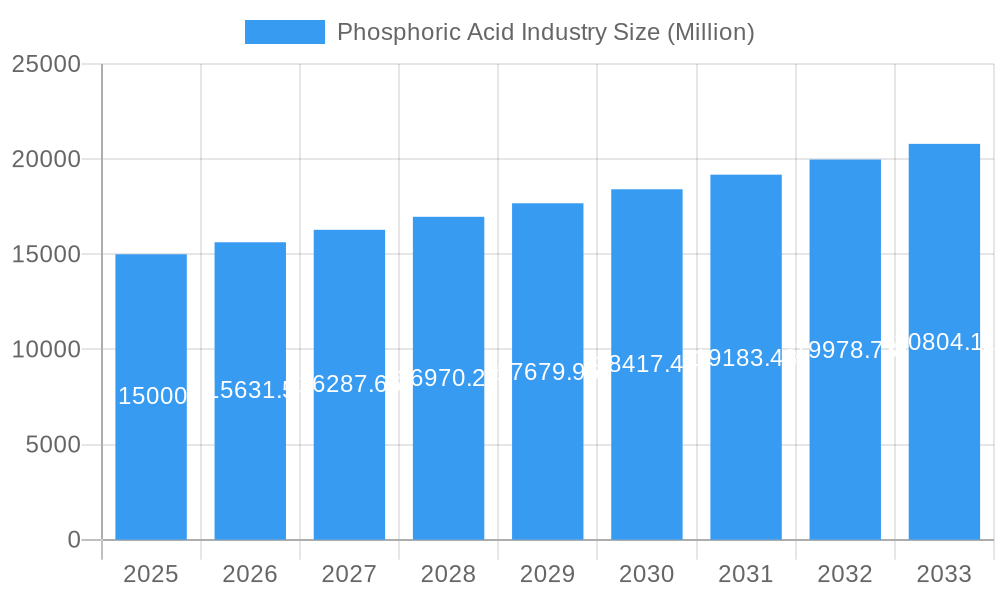
Phosphoric Acid Industry Market Size (In Billion)
The phosphoric acid market is segmented by end-use, with fertilizer production as the leading segment. However, the food & beverage and chemical & pharmaceutical sectors represent substantial and growing opportunities. Metallurgy and other niche industries also contribute to demand. Geographically, Asia-Pacific is expected to maintain market leadership due to its expanding agricultural base and industrialization. North America and Europe will also be significant markets. The 2025-2033 forecast period highlights strong growth potential, supported by technological innovations, increasing global food security needs, and sustained industrial demand, offering attractive prospects for market participants.
Phosphoric Acid Industry Company Market Share
Phosphoric Acid Industry: A Comprehensive Market Report (2019-2033)
This in-depth report provides a comprehensive analysis of the global phosphoric acid industry, covering market dynamics, key players, emerging trends, and future growth prospects. With a study period spanning 2019-2033, a base year of 2025, and an estimated year of 2025, this report offers invaluable insights for industry stakeholders, investors, and researchers. The forecast period extends from 2025 to 2033, with historical data encompassing 2019-2024. Expect detailed analysis across various segments and regions, providing actionable intelligence for strategic decision-making. The report's data points are based on rigorous research and analysis, utilizing both primary and secondary sources, to present a precise and realistic forecast of the industry's trajectory. Market values are represented in Millions throughout the report.
Phosphoric Acid Industry Market Dynamics & Concentration
The global phosphoric acid market exhibits a moderately concentrated structure, with key players such as ICL, Innophos, Mosaic, J R Simplot Company, EuroChem Group, Sterlite Copper (A Unit of Vedanta Limited), Agropolychim, Aditya Birla Chemicals, Phosagro, IFFCO, and Nutrien Ltd holding significant market shares. Market share fluctuations are driven by factors such as M&A activity, technological advancements, and shifts in end-user demand. The industry is subject to stringent regulatory frameworks concerning environmental protection and worker safety, impacting production costs and operational efficiency. Phosphoric acid faces competition from substitute products in specific applications, particularly in the fertilizer segment. End-user trends, especially the growing demand for fertilizers in developing economies, significantly influence market growth.
- Market Concentration: The top 5 players account for approximately xx% of the global market share (2024).
- M&A Activity: A total of xx M&A deals were recorded between 2019 and 2024, primarily driven by strategic expansion and resource consolidation.
- Innovation Drivers: Focus on energy efficiency, reduced environmental impact, and development of high-purity phosphoric acid are key innovation drivers.
- Regulatory Landscape: Stringent environmental regulations are driving the adoption of cleaner production technologies.
Phosphoric Acid Industry Industry Trends & Analysis
The phosphoric acid market is experiencing a CAGR of xx% during the forecast period (2025-2033). This growth is fuelled by increasing demand from the fertilizer industry, driven by the global population growth and rising demand for food production. Technological disruptions, such as the advancement of efficient production methods and the integration of automation, are enhancing productivity and lowering production costs. Consumer preferences for sustainable and environmentally friendly products are impacting manufacturing processes and creating opportunities for innovative solutions. Intense competition among established players is leading to price pressures and the necessity for continuous innovation. Market penetration in emerging economies continues to expand, presenting significant growth opportunities. Technological advancements are impacting market share and creating new entry points.
Leading Markets & Segments in Phosphoric Acid Industry
The fertilizer segment dominates the phosphoric acid market, accounting for approximately xx% of global demand in 2024. This is primarily due to phosphoric acid's crucial role as a key component in phosphate fertilizers. Other significant end-user industries include food and beverages (xx%), chemicals (xx%), and metallurgy (xx%).
Key Drivers by Segment:
- Fertilizer: Increasing global food demand, supportive government policies in key agricultural regions, and rising arable land under cultivation.
- Food and Beverages: Growth in processed food and beverage consumption, stringent food safety regulations driving the adoption of high-purity phosphoric acid.
- Chemicals: Demand for phosphoric acid in the production of various chemicals, including detergents and water treatment agents.
- Medicine: Utilization in pharmaceuticals, particularly in the manufacture of drugs and supplements.
- Metallurgy: Application in metal surface treatment and cleaning.
Regional Dominance: The Asia-Pacific region is expected to maintain its position as the dominant market throughout the forecast period, driven by robust growth in the fertilizer and food and beverage industries.
Phosphoric Acid Industry Product Developments
Recent product developments have focused on increasing the purity of phosphoric acid to cater to stringent demands from diverse sectors like food and pharmaceuticals. The industry is actively exploring the application of nanotechnology to enhance the efficiency and effectiveness of phosphoric acid-based products. Technological improvements in production processes, along with a greater emphasis on sustainability, are enhancing the competitiveness of different phosphoric acid products.
Key Drivers of Phosphoric Acid Industry Growth
The phosphoric acid market's growth is driven by factors such as the increasing demand for fertilizers to support global food security, expansion into emerging markets, and the development of new applications in food processing, water treatment, and specialty chemicals. Technological advances in production efficiency and environmental sustainability are also contributing to market growth. Favorable government regulations supporting agricultural development in certain regions further augment market expansion.
Challenges in the Phosphoric Acid Industry Market
The industry faces challenges such as fluctuating raw material prices, environmental regulations and their associated compliance costs, and intense competition from both established players and new entrants. Supply chain disruptions, particularly related to phosphate rock procurement, can impact production and profitability. These factors combined can lead to significant price volatility and affect the industry's overall growth trajectory.
Emerging Opportunities in Phosphoric Acid Industry
The rising demand for sustainable and high-purity phosphoric acid presents significant opportunities for innovation and growth. Strategic partnerships between manufacturers and end-users are driving the development of specialized products and applications. Expansion into emerging markets with growing agricultural sectors provides further avenues for market expansion. The adoption of advanced technologies for enhanced production efficiency offers significant potential for increased profitability and market share.
Leading Players in the Phosphoric Acid Industry Sector
- ICL
- Innophos
- Mosaic
- J R Simplot Company
- EuroChem Group
- Sterlite Copper (A Unit of Vedanta Limited)
- Agropolychim
- Aditya Birla Chemicals
- Phosagro
- IFFCO
- Nutrien Ltd
Key Milestones in Phosphoric Acid Industry Industry
- May 2023: The OCP Group acquired a 50% ownership share in GlobalFeed SL, expanding its presence in animal nutrition.
- July 2022: Nutrien Ltd acquired Casa do Adubo SA, expanding its retail network in Brazil (USD 400 Million transaction).
- February 2022: EuroChem Group completed the acquisition of the Serra do Salitre phosphate project in Brazil, adding significant phosphate reserves and production capacity.
Strategic Outlook for Phosphoric Acid Industry Market
The phosphoric acid market is poised for continued growth, driven by increasing global food demand and the expanding use of phosphate fertilizers. Strategic investments in sustainable production technologies and exploration of new applications will be crucial for long-term success. Companies that can effectively navigate the challenges of raw material price volatility and stringent environmental regulations will be best positioned to capitalize on the industry's future growth potential.
Phosphoric Acid Industry Segmentation
-
1. End-user Industry
- 1.1. Fertilizer
- 1.2. Food and Beverages
- 1.3. Chemicals
- 1.4. Medicine
- 1.5. Metallurgy
- 1.6. Other End-user Industries
Phosphoric Acid Industry Segmentation By Geography
-
1. Asia Pacific
- 1.1. China
- 1.2. India
- 1.3. Japan
- 1.4. South Korea
- 1.5. Rest of Asia Pacific
-
2. North America
- 2.1. United States
- 2.2. Mexico
- 2.3. Canada
-
3. Europe
- 3.1. Germany
- 3.2. United Kingdom
- 3.3. Italy
- 3.4. France
- 3.5. Rest of Europe
-
4. South America
- 4.1. Brazil
- 4.2. Argentina
- 4.3. Rest of South America
-
5. Middle East and Africa
- 5.1. Saudi Arabia
- 5.2. South Africa
- 5.3. Rest of Middle East and Africa
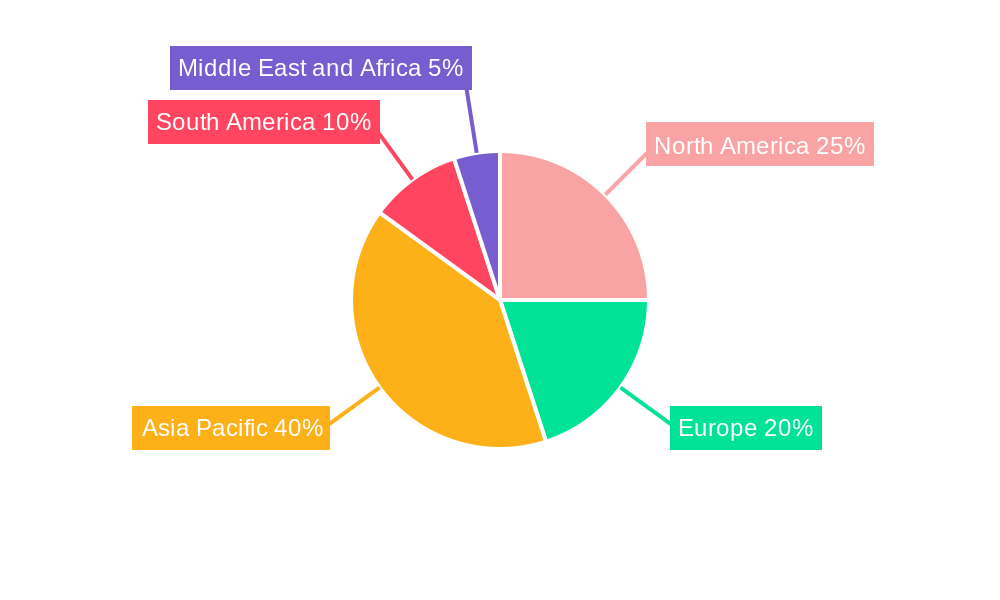
Phosphoric Acid Industry Regional Market Share
Geographic Coverage of Phosphoric Acid Industry
Phosphoric Acid Industry REPORT HIGHLIGHTS
| Aspects | Details |
|---|---|
| Study Period | 2020-2034 |
| Base Year | 2025 |
| Estimated Year | 2026 |
| Forecast Period | 2026-2034 |
| Historical Period | 2020-2025 |
| Growth Rate | CAGR of 5.7% from 2020-2034 |
| Segmentation |
|
Table of Contents
- 1. Introduction
- 1.1. Research Scope
- 1.2. Market Segmentation
- 1.3. Research Methodology
- 1.4. Definitions and Assumptions
- 2. Executive Summary
- 2.1. Introduction
- 3. Market Dynamics
- 3.1. Introduction
- 3.2. Market Drivers
- 3.2.1. High Demand for Fertilizer Industry; Increasing Usage in the Food and Beverage Industry
- 3.3. Market Restrains
- 3.3.1. Health Hazards Caused by Phosphoric Acid
- 3.4. Market Trends
- 3.4.1. Fertilizer Industry to Dominate the Market
- 4. Market Factor Analysis
- 4.1. Porters Five Forces
- 4.2. Supply/Value Chain
- 4.3. PESTEL analysis
- 4.4. Market Entropy
- 4.5. Patent/Trademark Analysis
- 5. Global Phosphoric Acid Industry Analysis, Insights and Forecast, 2020-2032
- 5.1. Market Analysis, Insights and Forecast - by End-user Industry
- 5.1.1. Fertilizer
- 5.1.2. Food and Beverages
- 5.1.3. Chemicals
- 5.1.4. Medicine
- 5.1.5. Metallurgy
- 5.1.6. Other End-user Industries
- 5.2. Market Analysis, Insights and Forecast - by Region
- 5.2.1. Asia Pacific
- 5.2.2. North America
- 5.2.3. Europe
- 5.2.4. South America
- 5.2.5. Middle East and Africa
- 5.1. Market Analysis, Insights and Forecast - by End-user Industry
- 6. Asia Pacific Phosphoric Acid Industry Analysis, Insights and Forecast, 2020-2032
- 6.1. Market Analysis, Insights and Forecast - by End-user Industry
- 6.1.1. Fertilizer
- 6.1.2. Food and Beverages
- 6.1.3. Chemicals
- 6.1.4. Medicine
- 6.1.5. Metallurgy
- 6.1.6. Other End-user Industries
- 6.1. Market Analysis, Insights and Forecast - by End-user Industry
- 7. North America Phosphoric Acid Industry Analysis, Insights and Forecast, 2020-2032
- 7.1. Market Analysis, Insights and Forecast - by End-user Industry
- 7.1.1. Fertilizer
- 7.1.2. Food and Beverages
- 7.1.3. Chemicals
- 7.1.4. Medicine
- 7.1.5. Metallurgy
- 7.1.6. Other End-user Industries
- 7.1. Market Analysis, Insights and Forecast - by End-user Industry
- 8. Europe Phosphoric Acid Industry Analysis, Insights and Forecast, 2020-2032
- 8.1. Market Analysis, Insights and Forecast - by End-user Industry
- 8.1.1. Fertilizer
- 8.1.2. Food and Beverages
- 8.1.3. Chemicals
- 8.1.4. Medicine
- 8.1.5. Metallurgy
- 8.1.6. Other End-user Industries
- 8.1. Market Analysis, Insights and Forecast - by End-user Industry
- 9. South America Phosphoric Acid Industry Analysis, Insights and Forecast, 2020-2032
- 9.1. Market Analysis, Insights and Forecast - by End-user Industry
- 9.1.1. Fertilizer
- 9.1.2. Food and Beverages
- 9.1.3. Chemicals
- 9.1.4. Medicine
- 9.1.5. Metallurgy
- 9.1.6. Other End-user Industries
- 9.1. Market Analysis, Insights and Forecast - by End-user Industry
- 10. Middle East and Africa Phosphoric Acid Industry Analysis, Insights and Forecast, 2020-2032
- 10.1. Market Analysis, Insights and Forecast - by End-user Industry
- 10.1.1. Fertilizer
- 10.1.2. Food and Beverages
- 10.1.3. Chemicals
- 10.1.4. Medicine
- 10.1.5. Metallurgy
- 10.1.6. Other End-user Industries
- 10.1. Market Analysis, Insights and Forecast - by End-user Industry
- 11. Competitive Analysis
- 11.1. Global Market Share Analysis 2025
- 11.2. Company Profiles
- 11.2.1 ICL
- 11.2.1.1. Overview
- 11.2.1.2. Products
- 11.2.1.3. SWOT Analysis
- 11.2.1.4. Recent Developments
- 11.2.1.5. Financials (Based on Availability)
- 11.2.2 Innophos
- 11.2.2.1. Overview
- 11.2.2.2. Products
- 11.2.2.3. SWOT Analysis
- 11.2.2.4. Recent Developments
- 11.2.2.5. Financials (Based on Availability)
- 11.2.3 Mosaic
- 11.2.3.1. Overview
- 11.2.3.2. Products
- 11.2.3.3. SWOT Analysis
- 11.2.3.4. Recent Developments
- 11.2.3.5. Financials (Based on Availability)
- 11.2.4 J R Simplot Company
- 11.2.4.1. Overview
- 11.2.4.2. Products
- 11.2.4.3. SWOT Analysis
- 11.2.4.4. Recent Developments
- 11.2.4.5. Financials (Based on Availability)
- 11.2.5 EuroChem Group
- 11.2.5.1. Overview
- 11.2.5.2. Products
- 11.2.5.3. SWOT Analysis
- 11.2.5.4. Recent Developments
- 11.2.5.5. Financials (Based on Availability)
- 11.2.6 Sterlite Copper (A Unit of Vedanta Limited) *List Not Exhaustive
- 11.2.6.1. Overview
- 11.2.6.2. Products
- 11.2.6.3. SWOT Analysis
- 11.2.6.4. Recent Developments
- 11.2.6.5. Financials (Based on Availability)
- 11.2.7 Agropolychim
- 11.2.7.1. Overview
- 11.2.7.2. Products
- 11.2.7.3. SWOT Analysis
- 11.2.7.4. Recent Developments
- 11.2.7.5. Financials (Based on Availability)
- 11.2.8 Aditya Birla Chemicals
- 11.2.8.1. Overview
- 11.2.8.2. Products
- 11.2.8.3. SWOT Analysis
- 11.2.8.4. Recent Developments
- 11.2.8.5. Financials (Based on Availability)
- 11.2.9 Phosagro
- 11.2.9.1. Overview
- 11.2.9.2. Products
- 11.2.9.3. SWOT Analysis
- 11.2.9.4. Recent Developments
- 11.2.9.5. Financials (Based on Availability)
- 11.2.10 IFFCO
- 11.2.10.1. Overview
- 11.2.10.2. Products
- 11.2.10.3. SWOT Analysis
- 11.2.10.4. Recent Developments
- 11.2.10.5. Financials (Based on Availability)
- 11.2.11 Nutrien Ltd
- 11.2.11.1. Overview
- 11.2.11.2. Products
- 11.2.11.3. SWOT Analysis
- 11.2.11.4. Recent Developments
- 11.2.11.5. Financials (Based on Availability)
- 11.2.1 ICL
List of Figures
- Figure 1: Global Phosphoric Acid Industry Revenue Breakdown (billion, %) by Region 2025 & 2033
- Figure 2: Global Phosphoric Acid Industry Volume Breakdown (Million, %) by Region 2025 & 2033
- Figure 3: Asia Pacific Phosphoric Acid Industry Revenue (billion), by End-user Industry 2025 & 2033
- Figure 4: Asia Pacific Phosphoric Acid Industry Volume (Million), by End-user Industry 2025 & 2033
- Figure 5: Asia Pacific Phosphoric Acid Industry Revenue Share (%), by End-user Industry 2025 & 2033
- Figure 6: Asia Pacific Phosphoric Acid Industry Volume Share (%), by End-user Industry 2025 & 2033
- Figure 7: Asia Pacific Phosphoric Acid Industry Revenue (billion), by Country 2025 & 2033
- Figure 8: Asia Pacific Phosphoric Acid Industry Volume (Million), by Country 2025 & 2033
- Figure 9: Asia Pacific Phosphoric Acid Industry Revenue Share (%), by Country 2025 & 2033
- Figure 10: Asia Pacific Phosphoric Acid Industry Volume Share (%), by Country 2025 & 2033
- Figure 11: North America Phosphoric Acid Industry Revenue (billion), by End-user Industry 2025 & 2033
- Figure 12: North America Phosphoric Acid Industry Volume (Million), by End-user Industry 2025 & 2033
- Figure 13: North America Phosphoric Acid Industry Revenue Share (%), by End-user Industry 2025 & 2033
- Figure 14: North America Phosphoric Acid Industry Volume Share (%), by End-user Industry 2025 & 2033
- Figure 15: North America Phosphoric Acid Industry Revenue (billion), by Country 2025 & 2033
- Figure 16: North America Phosphoric Acid Industry Volume (Million), by Country 2025 & 2033
- Figure 17: North America Phosphoric Acid Industry Revenue Share (%), by Country 2025 & 2033
- Figure 18: North America Phosphoric Acid Industry Volume Share (%), by Country 2025 & 2033
- Figure 19: Europe Phosphoric Acid Industry Revenue (billion), by End-user Industry 2025 & 2033
- Figure 20: Europe Phosphoric Acid Industry Volume (Million), by End-user Industry 2025 & 2033
- Figure 21: Europe Phosphoric Acid Industry Revenue Share (%), by End-user Industry 2025 & 2033
- Figure 22: Europe Phosphoric Acid Industry Volume Share (%), by End-user Industry 2025 & 2033
- Figure 23: Europe Phosphoric Acid Industry Revenue (billion), by Country 2025 & 2033
- Figure 24: Europe Phosphoric Acid Industry Volume (Million), by Country 2025 & 2033
- Figure 25: Europe Phosphoric Acid Industry Revenue Share (%), by Country 2025 & 2033
- Figure 26: Europe Phosphoric Acid Industry Volume Share (%), by Country 2025 & 2033
- Figure 27: South America Phosphoric Acid Industry Revenue (billion), by End-user Industry 2025 & 2033
- Figure 28: South America Phosphoric Acid Industry Volume (Million), by End-user Industry 2025 & 2033
- Figure 29: South America Phosphoric Acid Industry Revenue Share (%), by End-user Industry 2025 & 2033
- Figure 30: South America Phosphoric Acid Industry Volume Share (%), by End-user Industry 2025 & 2033
- Figure 31: South America Phosphoric Acid Industry Revenue (billion), by Country 2025 & 2033
- Figure 32: South America Phosphoric Acid Industry Volume (Million), by Country 2025 & 2033
- Figure 33: South America Phosphoric Acid Industry Revenue Share (%), by Country 2025 & 2033
- Figure 34: South America Phosphoric Acid Industry Volume Share (%), by Country 2025 & 2033
- Figure 35: Middle East and Africa Phosphoric Acid Industry Revenue (billion), by End-user Industry 2025 & 2033
- Figure 36: Middle East and Africa Phosphoric Acid Industry Volume (Million), by End-user Industry 2025 & 2033
- Figure 37: Middle East and Africa Phosphoric Acid Industry Revenue Share (%), by End-user Industry 2025 & 2033
- Figure 38: Middle East and Africa Phosphoric Acid Industry Volume Share (%), by End-user Industry 2025 & 2033
- Figure 39: Middle East and Africa Phosphoric Acid Industry Revenue (billion), by Country 2025 & 2033
- Figure 40: Middle East and Africa Phosphoric Acid Industry Volume (Million), by Country 2025 & 2033
- Figure 41: Middle East and Africa Phosphoric Acid Industry Revenue Share (%), by Country 2025 & 2033
- Figure 42: Middle East and Africa Phosphoric Acid Industry Volume Share (%), by Country 2025 & 2033
List of Tables
- Table 1: Global Phosphoric Acid Industry Revenue billion Forecast, by End-user Industry 2020 & 2033
- Table 2: Global Phosphoric Acid Industry Volume Million Forecast, by End-user Industry 2020 & 2033
- Table 3: Global Phosphoric Acid Industry Revenue billion Forecast, by Region 2020 & 2033
- Table 4: Global Phosphoric Acid Industry Volume Million Forecast, by Region 2020 & 2033
- Table 5: Global Phosphoric Acid Industry Revenue billion Forecast, by End-user Industry 2020 & 2033
- Table 6: Global Phosphoric Acid Industry Volume Million Forecast, by End-user Industry 2020 & 2033
- Table 7: Global Phosphoric Acid Industry Revenue billion Forecast, by Country 2020 & 2033
- Table 8: Global Phosphoric Acid Industry Volume Million Forecast, by Country 2020 & 2033
- Table 9: China Phosphoric Acid Industry Revenue (billion) Forecast, by Application 2020 & 2033
- Table 10: China Phosphoric Acid Industry Volume (Million) Forecast, by Application 2020 & 2033
- Table 11: India Phosphoric Acid Industry Revenue (billion) Forecast, by Application 2020 & 2033
- Table 12: India Phosphoric Acid Industry Volume (Million) Forecast, by Application 2020 & 2033
- Table 13: Japan Phosphoric Acid Industry Revenue (billion) Forecast, by Application 2020 & 2033
- Table 14: Japan Phosphoric Acid Industry Volume (Million) Forecast, by Application 2020 & 2033
- Table 15: South Korea Phosphoric Acid Industry Revenue (billion) Forecast, by Application 2020 & 2033
- Table 16: South Korea Phosphoric Acid Industry Volume (Million) Forecast, by Application 2020 & 2033
- Table 17: Rest of Asia Pacific Phosphoric Acid Industry Revenue (billion) Forecast, by Application 2020 & 2033
- Table 18: Rest of Asia Pacific Phosphoric Acid Industry Volume (Million) Forecast, by Application 2020 & 2033
- Table 19: Global Phosphoric Acid Industry Revenue billion Forecast, by End-user Industry 2020 & 2033
- Table 20: Global Phosphoric Acid Industry Volume Million Forecast, by End-user Industry 2020 & 2033
- Table 21: Global Phosphoric Acid Industry Revenue billion Forecast, by Country 2020 & 2033
- Table 22: Global Phosphoric Acid Industry Volume Million Forecast, by Country 2020 & 2033
- Table 23: United States Phosphoric Acid Industry Revenue (billion) Forecast, by Application 2020 & 2033
- Table 24: United States Phosphoric Acid Industry Volume (Million) Forecast, by Application 2020 & 2033
- Table 25: Mexico Phosphoric Acid Industry Revenue (billion) Forecast, by Application 2020 & 2033
- Table 26: Mexico Phosphoric Acid Industry Volume (Million) Forecast, by Application 2020 & 2033
- Table 27: Canada Phosphoric Acid Industry Revenue (billion) Forecast, by Application 2020 & 2033
- Table 28: Canada Phosphoric Acid Industry Volume (Million) Forecast, by Application 2020 & 2033
- Table 29: Global Phosphoric Acid Industry Revenue billion Forecast, by End-user Industry 2020 & 2033
- Table 30: Global Phosphoric Acid Industry Volume Million Forecast, by End-user Industry 2020 & 2033
- Table 31: Global Phosphoric Acid Industry Revenue billion Forecast, by Country 2020 & 2033
- Table 32: Global Phosphoric Acid Industry Volume Million Forecast, by Country 2020 & 2033
- Table 33: Germany Phosphoric Acid Industry Revenue (billion) Forecast, by Application 2020 & 2033
- Table 34: Germany Phosphoric Acid Industry Volume (Million) Forecast, by Application 2020 & 2033
- Table 35: United Kingdom Phosphoric Acid Industry Revenue (billion) Forecast, by Application 2020 & 2033
- Table 36: United Kingdom Phosphoric Acid Industry Volume (Million) Forecast, by Application 2020 & 2033
- Table 37: Italy Phosphoric Acid Industry Revenue (billion) Forecast, by Application 2020 & 2033
- Table 38: Italy Phosphoric Acid Industry Volume (Million) Forecast, by Application 2020 & 2033
- Table 39: France Phosphoric Acid Industry Revenue (billion) Forecast, by Application 2020 & 2033
- Table 40: France Phosphoric Acid Industry Volume (Million) Forecast, by Application 2020 & 2033
- Table 41: Rest of Europe Phosphoric Acid Industry Revenue (billion) Forecast, by Application 2020 & 2033
- Table 42: Rest of Europe Phosphoric Acid Industry Volume (Million) Forecast, by Application 2020 & 2033
- Table 43: Global Phosphoric Acid Industry Revenue billion Forecast, by End-user Industry 2020 & 2033
- Table 44: Global Phosphoric Acid Industry Volume Million Forecast, by End-user Industry 2020 & 2033
- Table 45: Global Phosphoric Acid Industry Revenue billion Forecast, by Country 2020 & 2033
- Table 46: Global Phosphoric Acid Industry Volume Million Forecast, by Country 2020 & 2033
- Table 47: Brazil Phosphoric Acid Industry Revenue (billion) Forecast, by Application 2020 & 2033
- Table 48: Brazil Phosphoric Acid Industry Volume (Million) Forecast, by Application 2020 & 2033
- Table 49: Argentina Phosphoric Acid Industry Revenue (billion) Forecast, by Application 2020 & 2033
- Table 50: Argentina Phosphoric Acid Industry Volume (Million) Forecast, by Application 2020 & 2033
- Table 51: Rest of South America Phosphoric Acid Industry Revenue (billion) Forecast, by Application 2020 & 2033
- Table 52: Rest of South America Phosphoric Acid Industry Volume (Million) Forecast, by Application 2020 & 2033
- Table 53: Global Phosphoric Acid Industry Revenue billion Forecast, by End-user Industry 2020 & 2033
- Table 54: Global Phosphoric Acid Industry Volume Million Forecast, by End-user Industry 2020 & 2033
- Table 55: Global Phosphoric Acid Industry Revenue billion Forecast, by Country 2020 & 2033
- Table 56: Global Phosphoric Acid Industry Volume Million Forecast, by Country 2020 & 2033
- Table 57: Saudi Arabia Phosphoric Acid Industry Revenue (billion) Forecast, by Application 2020 & 2033
- Table 58: Saudi Arabia Phosphoric Acid Industry Volume (Million) Forecast, by Application 2020 & 2033
- Table 59: South Africa Phosphoric Acid Industry Revenue (billion) Forecast, by Application 2020 & 2033
- Table 60: South Africa Phosphoric Acid Industry Volume (Million) Forecast, by Application 2020 & 2033
- Table 61: Rest of Middle East and Africa Phosphoric Acid Industry Revenue (billion) Forecast, by Application 2020 & 2033
- Table 62: Rest of Middle East and Africa Phosphoric Acid Industry Volume (Million) Forecast, by Application 2020 & 2033
Frequently Asked Questions
1. What is the projected Compound Annual Growth Rate (CAGR) of the Phosphoric Acid Industry?
The projected CAGR is approximately 5.7%.
2. Which companies are prominent players in the Phosphoric Acid Industry?
Key companies in the market include ICL, Innophos, Mosaic, J R Simplot Company, EuroChem Group, Sterlite Copper (A Unit of Vedanta Limited) *List Not Exhaustive, Agropolychim, Aditya Birla Chemicals, Phosagro, IFFCO, Nutrien Ltd.
3. What are the main segments of the Phosphoric Acid Industry?
The market segments include End-user Industry.
4. Can you provide details about the market size?
The market size is estimated to be USD 69.1 billion as of 2022.
5. What are some drivers contributing to market growth?
High Demand for Fertilizer Industry; Increasing Usage in the Food and Beverage Industry.
6. What are the notable trends driving market growth?
Fertilizer Industry to Dominate the Market.
7. Are there any restraints impacting market growth?
Health Hazards Caused by Phosphoric Acid.
8. Can you provide examples of recent developments in the market?
May 2023: The OCP Group secured a 50% ownership share in GlobalFeed SL. This strategic acquisition enabled OCP to broaden its presence in the animal nutrition industry and enhance customers' accessibility to the company's phosphoric acid products.
9. What pricing options are available for accessing the report?
Pricing options include single-user, multi-user, and enterprise licenses priced at USD 4750, USD 5250, and USD 8750 respectively.
10. Is the market size provided in terms of value or volume?
The market size is provided in terms of value, measured in billion and volume, measured in Million.
11. Are there any specific market keywords associated with the report?
Yes, the market keyword associated with the report is "Phosphoric Acid Industry," which aids in identifying and referencing the specific market segment covered.
12. How do I determine which pricing option suits my needs best?
The pricing options vary based on user requirements and access needs. Individual users may opt for single-user licenses, while businesses requiring broader access may choose multi-user or enterprise licenses for cost-effective access to the report.
13. Are there any additional resources or data provided in the Phosphoric Acid Industry report?
While the report offers comprehensive insights, it's advisable to review the specific contents or supplementary materials provided to ascertain if additional resources or data are available.
14. How can I stay updated on further developments or reports in the Phosphoric Acid Industry?
To stay informed about further developments, trends, and reports in the Phosphoric Acid Industry, consider subscribing to industry newsletters, following relevant companies and organizations, or regularly checking reputable industry news sources and publications.
Methodology
Step 1 - Identification of Relevant Samples Size from Population Database


Step 2 - Approaches for Defining Global Market Size (Value, Volume* & Price*)

Note*: In applicable scenarios
Step 3 - Data Sources
Primary Research
- Web Analytics
- Survey Reports
- Research Institute
- Latest Research Reports
- Opinion Leaders
Secondary Research
- Annual Reports
- White Paper
- Latest Press Release
- Industry Association
- Paid Database
- Investor Presentations

Step 4 - Data Triangulation
Involves using different sources of information in order to increase the validity of a study
These sources are likely to be stakeholders in a program - participants, other researchers, program staff, other community members, and so on.
Then we put all data in single framework & apply various statistical tools to find out the dynamic on the market.
During the analysis stage, feedback from the stakeholder groups would be compared to determine areas of agreement as well as areas of divergence