

Key Insights
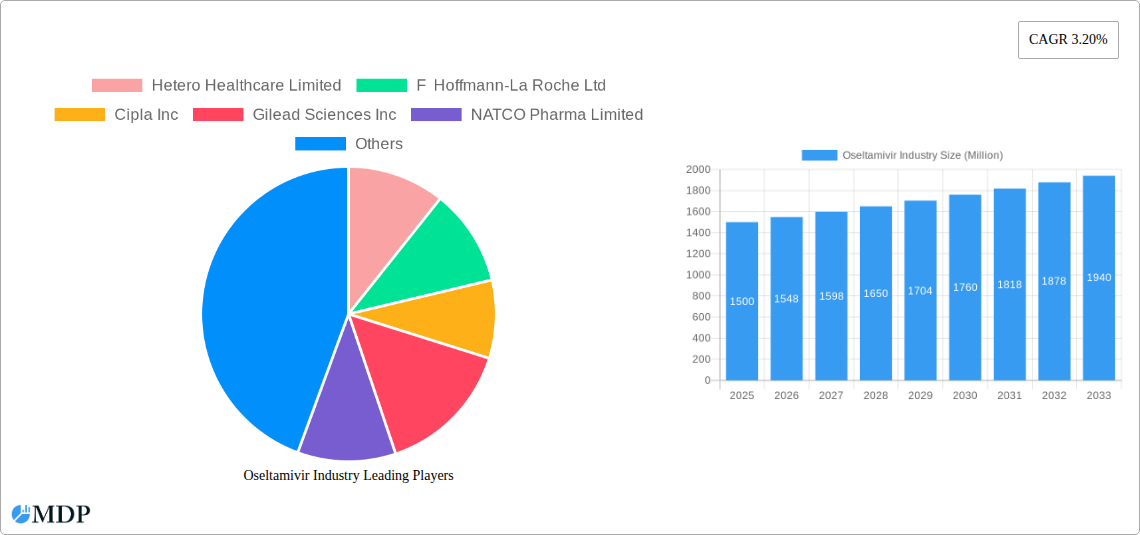
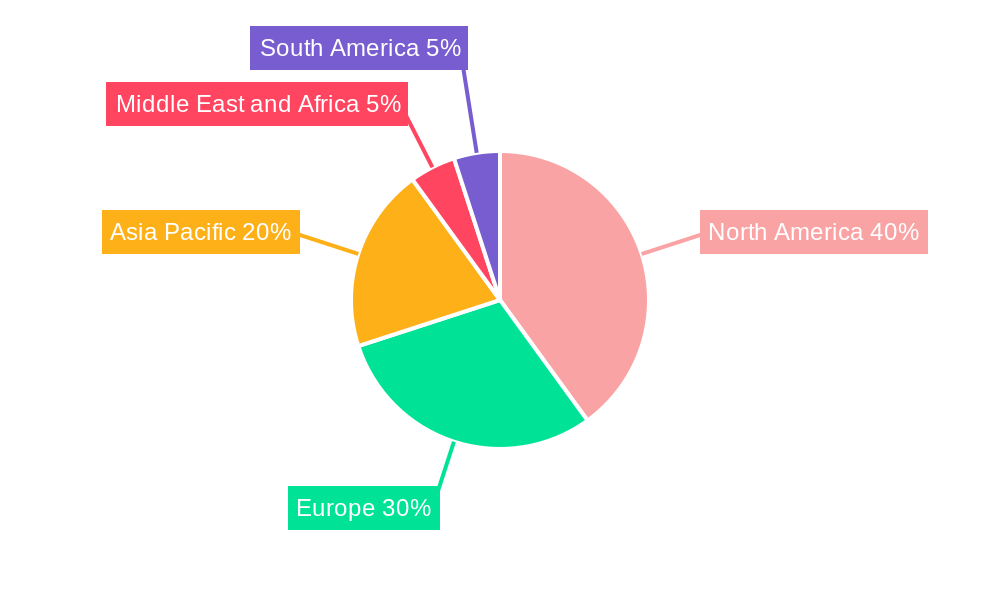
The global Oseltamivir market, valued at approximately $1.5 billion in 2025, is projected to experience steady growth, driven by a Compound Annual Growth Rate (CAGR) of 3.20% from 2025 to 2033. This growth is fueled by several key factors. The increasing prevalence of influenza, particularly during seasonal outbreaks and potential pandemics, creates a significant demand for effective antiviral treatments like Oseltamivir. Furthermore, the expanding geriatric population, a demographic highly susceptible to severe influenza complications, contributes significantly to market expansion. Advancements in Oseltamivir formulations, such as improved delivery systems (e.g., capsules and suspensions), cater to a wider patient base and enhance treatment compliance, thereby boosting market adoption. However, the market faces certain challenges. The emergence of Oseltamivir-resistant influenza strains poses a significant threat, necessitating continuous research and development of novel antiviral strategies. Furthermore, the availability of generic Oseltamivir products exerts downward pressure on pricing, impacting overall market profitability. Competitive pressures from other antiviral medications also influence market dynamics. Geographic segmentation reveals North America and Europe currently hold the largest market shares due to higher healthcare expenditure and established healthcare infrastructure. However, rapid economic growth and increasing healthcare awareness in regions like Asia-Pacific are expected to fuel substantial market expansion in these areas during the forecast period.
The segmentation of the Oseltamivir market by product type (capsules, suspensions, others) and application (influenza A, influenza B, others) provides valuable insights into market dynamics. Capsule formulations dominate the market due to their ease of administration and widespread acceptance. However, the increasing demand for pediatric formulations is driving growth in the suspension segment. The treatment of influenza A accounts for the lion's share of Oseltamivir applications, reflecting the higher prevalence and severity of this influenza strain. Key players in the market, including Hetero Healthcare Limited, F. Hoffmann-La Roche Ltd, Cipla Inc., and Gilead Sciences Inc., are actively involved in research and development, focusing on overcoming resistance issues and enhancing product efficacy to maintain their market presence and drive future growth. The strategic collaborations and partnerships among these players further shape the competitive landscape and influence market outcomes.
Oseltamivir Industry Market Report: 2019-2033 Forecast
This comprehensive report provides a detailed analysis of the global Oseltamivir industry, covering market dynamics, trends, leading players, and future growth prospects from 2019 to 2033. With a focus on actionable insights, this report is essential for industry stakeholders, investors, and strategic decision-makers seeking to navigate this evolving market. The study period spans 2019-2033, with 2025 serving as both the base and estimated year. The forecast period is 2025-2033, and the historical period covers 2019-2024. The report values are expressed in Millions.
Oseltamivir Industry Market Dynamics & Concentration
The global Oseltamivir market exhibits a moderately consolidated structure, with key players holding significant market shares. Market concentration is influenced by factors such as regulatory approvals, manufacturing capabilities, and intellectual property rights. Innovation plays a vital role, driving the development of improved formulations and delivery systems. Stringent regulatory frameworks, including those related to bioequivalence and safety, impact market entry and competition. The presence of substitute antiviral medications necessitates continuous innovation to maintain market share. End-user trends, particularly those concerning public health awareness and pandemic preparedness, significantly influence market demand. Mergers and acquisitions (M&A) activities are moderately frequent, with xx M&A deals recorded between 2019 and 2024, resulting in a xx% market share shift among leading players. Hetero Healthcare Limited, F Hoffmann-La Roche Ltd, and Cipla Inc are currently estimated to hold the largest market shares in 2025, accounting for approximately xx% of the total market.
- Market Share (2025 Estimate): Hetero Healthcare Limited (xx%), F Hoffmann-La Roche Ltd (xx%), Cipla Inc (xx%), others (xx%).
- M&A Activity (2019-2024): xx deals, leading to a xx% shift in market share.
- Key Innovation Drivers: Improved formulations, targeted delivery systems, combination therapies.
Oseltamivir Industry Trends & Analysis
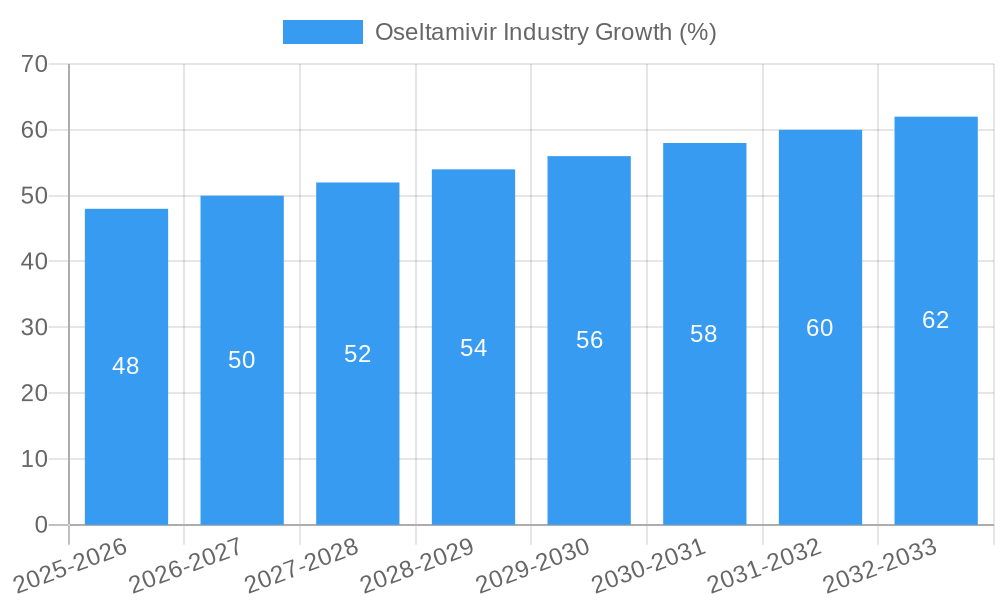
The Oseltamivir market experienced a CAGR of xx% during the historical period (2019-2024). This growth is primarily driven by increasing influenza outbreaks, rising healthcare expenditure, and growing awareness regarding preventative measures. Technological advancements in drug delivery and formulation are enhancing the efficacy and convenience of oseltamivir products. Consumer preferences for convenient dosage forms, such as oral suspensions, are shaping product development. The competitive landscape is characterized by both brand-name and generic players, leading to price competition and the need for differentiation through innovation. Market penetration remains relatively high in developed nations, with significant growth potential in emerging markets driven by rising disposable incomes and improving healthcare infrastructure. The market is expected to witness a CAGR of xx% during the forecast period (2025-2033), reaching a market value of xx Million by 2033.
Leading Markets & Segments in Oseltamivir Industry
The North American region holds the dominant position in the global Oseltamivir market, driven by high healthcare expenditure, robust healthcare infrastructure, and widespread influenza outbreaks. Within this region, the United States is the largest market.
- By Product Type: Capsules account for the largest segment due to ease of administration and established market presence. Oral suspensions hold a significant share, particularly in pediatric applications.
- By Application: Influenza A is the leading application segment, contributing to the majority of market demand.
Key Drivers for Dominance in North America:
- High per capita healthcare spending
- Developed healthcare infrastructure
- High prevalence of influenza
- Strong regulatory framework
Oseltamivir Industry Product Developments
Recent advancements focus on improving bioavailability and reducing side effects. New formulations, including extended-release capsules and improved suspensions, are gaining traction. These developments aim to enhance patient compliance and treatment outcomes. The market is also witnessing the development of combination therapies that integrate oseltamivir with other antiviral agents to improve efficacy against emerging influenza strains. These developments respond to the market need for more effective and convenient treatment options, catering to patient preferences and enhancing overall market competitiveness.
Key Drivers of Oseltamivir Industry Growth
The growth of the Oseltamivir industry is fueled by several key factors. The rising incidence of influenza infections globally, particularly during seasonal outbreaks and pandemics, is a primary driver. Increased awareness of preventative measures and proactive healthcare strategies contributes significantly to market growth. Furthermore, ongoing research and development leading to improved formulations and delivery systems enhance market appeal and adoption. Government initiatives promoting vaccination campaigns and public health awareness programs also play a significant role.
Challenges in the Oseltamivir Industry Market
The Oseltamivir market faces several significant challenges. The emergence of antiviral-resistant influenza strains poses a considerable threat. Fluctuations in influenza outbreaks can lead to unpredictable demand, impacting market stability. Furthermore, the increasing availability of generic versions intensifies price competition, putting pressure on profit margins for brand-name manufacturers. Stringent regulatory requirements and complex approval processes also present barriers to market entry for new players. The overall impact of these challenges is estimated to constrain market growth by approximately xx% during the forecast period.
Emerging Opportunities in Oseltamivir Industry
The long-term growth of the Oseltamivir market hinges on several emerging opportunities. Advancements in drug delivery systems, including novel formulations targeting specific populations (e.g., children), present significant potential. Strategic partnerships and collaborations among pharmaceutical companies can accelerate innovation and market expansion. Expanding market penetration in emerging economies with rising healthcare awareness and improved infrastructure offers substantial growth potential. The continuous development of effective treatment options against newly emerging influenza strains will also drive market growth.
Leading Players in the Oseltamivir Industry Sector
- Hetero Healthcare Limited
- F Hoffmann-La Roche Ltd (https://www.roche.com/)
- Cipla Inc (https://www.cipla.com/)
- Gilead Sciences Inc (https://www.gilead.com/)
- NATCO Pharma Limited
- Strides Pharma Science Limited (https://www.stridespharma.com/)
- Amneal Pharmaceuticals LLC (https://www.amneal.com/)
- Lupin Limited (https://www.lupin.com/)
- Alembic Pharmaceuticals Limited (https://www.alembicpharma.com/)
- Macleods Pharmaceuticals Ltd
- Zydus Cadila
Key Milestones in Oseltamivir Industry Industry
- October 2021: M.D. Anderson Cancer Center initiated a Phase II clinical study on the effect of baloxavir in combination with oseltamivir. This signifies exploration of combination therapies to improve treatment outcomes for severe influenza.
- January 2022: Strides Pharma Science Ltd received U.S. approval for its generic oseltamivir phosphate oral suspension. This increases competition and expands access to the medication.
Strategic Outlook for Oseltamivir Industry Market
The future of the Oseltamivir market is promising, with significant potential for growth driven by continuous innovation and increasing global healthcare needs. Strategic investments in research and development, focusing on addressing the challenges of antiviral resistance and enhancing drug delivery, will be crucial. Expansion into emerging markets with increasing healthcare awareness and infrastructure development presents substantial opportunities. Furthermore, strategic partnerships and collaborations can accelerate product development and market penetration, paving the way for sustainable long-term growth.
Oseltamivir Industry Segmentation
-
1. Product Type
- 1.1. Capsule
- 1.2. Suspension
- 1.3. Other Product Types
-
2. Industry vertical
- 2.1. Influenza A
- 2.2. Influenza B
- 2.3. Other
Oseltamivir Industry Segmentation By Geography
-
1. North America
- 1.1. United States
- 1.2. Canada
- 1.3. Mexico
-
2. Europe
- 2.1. Germany
- 2.2. United Kingdom
- 2.3. France
- 2.4. Italy
- 2.5. Spain
- 2.6. Rest of Europe
-
3. Asia Pacific
- 3.1. China
- 3.2. Japan
- 3.3. India
- 3.4. Australia
- 3.5. South Korea
- 3.6. Rest of Asia Pacific
-
4. Middle East and Africa
- 4.1. GCC
- 4.2. South Africa
- 4.3. Rest of Middle East and Africa
-
5. South America
- 5.1. Brazil
- 5.2. Argentina
- 5.3. Rest of South America
Oseltamivir Industry REPORT HIGHLIGHTS
| Aspects | Details |
|---|---|
| Study Period | 2019-2033 |
| Base Year | 2024 |
| Estimated Year | 2025 |
| Forecast Period | 2025-2033 |
| Historical Period | 2019-2024 |
| Growth Rate | CAGR of 3.20% from 2019-2033 |
| Segmentation |
|
Table of Contents
- 1. Introduction
- 1.1. Research Scope
- 1.2. Market Segmentation
- 1.3. Research Methodology
- 1.4. Definitions and Assumptions
- 2. Executive Summary
- 2.1. Introduction
- 3. Market Dynamics
- 3.1. Introduction
- 3.2. Market Drivers
- 3.2.1. Rising Prevalence of Influenza Virus Infections; Increase in the Number of Research and Development Activities
- 3.3. Market Restrains
- 3.3.1. Side Effects Associated with Oseltamivir Treatment
- 3.4. Market Trends
- 3.4.1. Influenza A Segment Expects to Register a High CAGR Over the Forecast Period
- 4. Market Factor Analysis
- 4.1. Porters Five Forces
- 4.2. Supply/Value Chain
- 4.3. PESTEL analysis
- 4.4. Market Entropy
- 4.5. Patent/Trademark Analysis
- 5. Global Oseltamivir Industry Analysis, Insights and Forecast, 2019-2031
- 5.1. Market Analysis, Insights and Forecast - by Product Type
- 5.1.1. Capsule
- 5.1.2. Suspension
- 5.1.3. Other Product Types
- 5.2. Market Analysis, Insights and Forecast - by Industry vertical
- 5.2.1. Influenza A
- 5.2.2. Influenza B
- 5.2.3. Other
- 5.3. Market Analysis, Insights and Forecast - by Region
- 5.3.1. North America
- 5.3.2. Europe
- 5.3.3. Asia Pacific
- 5.3.4. Middle East and Africa
- 5.3.5. South America
- 5.1. Market Analysis, Insights and Forecast - by Product Type
- 6. North America Oseltamivir Industry Analysis, Insights and Forecast, 2019-2031
- 6.1. Market Analysis, Insights and Forecast - by Product Type
- 6.1.1. Capsule
- 6.1.2. Suspension
- 6.1.3. Other Product Types
- 6.2. Market Analysis, Insights and Forecast - by Industry vertical
- 6.2.1. Influenza A
- 6.2.2. Influenza B
- 6.2.3. Other
- 6.1. Market Analysis, Insights and Forecast - by Product Type
- 7. Europe Oseltamivir Industry Analysis, Insights and Forecast, 2019-2031
- 7.1. Market Analysis, Insights and Forecast - by Product Type
- 7.1.1. Capsule
- 7.1.2. Suspension
- 7.1.3. Other Product Types
- 7.2. Market Analysis, Insights and Forecast - by Industry vertical
- 7.2.1. Influenza A
- 7.2.2. Influenza B
- 7.2.3. Other
- 7.1. Market Analysis, Insights and Forecast - by Product Type
- 8. Asia Pacific Oseltamivir Industry Analysis, Insights and Forecast, 2019-2031
- 8.1. Market Analysis, Insights and Forecast - by Product Type
- 8.1.1. Capsule
- 8.1.2. Suspension
- 8.1.3. Other Product Types
- 8.2. Market Analysis, Insights and Forecast - by Industry vertical
- 8.2.1. Influenza A
- 8.2.2. Influenza B
- 8.2.3. Other
- 8.1. Market Analysis, Insights and Forecast - by Product Type
- 9. Middle East and Africa Oseltamivir Industry Analysis, Insights and Forecast, 2019-2031
- 9.1. Market Analysis, Insights and Forecast - by Product Type
- 9.1.1. Capsule
- 9.1.2. Suspension
- 9.1.3. Other Product Types
- 9.2. Market Analysis, Insights and Forecast - by Industry vertical
- 9.2.1. Influenza A
- 9.2.2. Influenza B
- 9.2.3. Other
- 9.1. Market Analysis, Insights and Forecast - by Product Type
- 10. South America Oseltamivir Industry Analysis, Insights and Forecast, 2019-2031
- 10.1. Market Analysis, Insights and Forecast - by Product Type
- 10.1.1. Capsule
- 10.1.2. Suspension
- 10.1.3. Other Product Types
- 10.2. Market Analysis, Insights and Forecast - by Industry vertical
- 10.2.1. Influenza A
- 10.2.2. Influenza B
- 10.2.3. Other
- 10.1. Market Analysis, Insights and Forecast - by Product Type
- 11. North America Oseltamivir Industry Analysis, Insights and Forecast, 2019-2031
- 11.1. Market Analysis, Insights and Forecast - By Country/Sub-region
- 11.1.1 United States
- 11.1.2 Canada
- 11.1.3 Mexico
- 12. Europe Oseltamivir Industry Analysis, Insights and Forecast, 2019-2031
- 12.1. Market Analysis, Insights and Forecast - By Country/Sub-region
- 12.1.1 Germany
- 12.1.2 United Kingdom
- 12.1.3 France
- 12.1.4 Italy
- 12.1.5 Spain
- 12.1.6 Rest of Europe
- 13. Asia Pacific Oseltamivir Industry Analysis, Insights and Forecast, 2019-2031
- 13.1. Market Analysis, Insights and Forecast - By Country/Sub-region
- 13.1.1 China
- 13.1.2 Japan
- 13.1.3 India
- 13.1.4 Australia
- 13.1.5 South Korea
- 13.1.6 Rest of Asia Pacific
- 14. Middle East and Africa Oseltamivir Industry Analysis, Insights and Forecast, 2019-2031
- 14.1. Market Analysis, Insights and Forecast - By Country/Sub-region
- 14.1.1 GCC
- 14.1.2 South Africa
- 14.1.3 Rest of Middle East and Africa
- 15. South America Oseltamivir Industry Analysis, Insights and Forecast, 2019-2031
- 15.1. Market Analysis, Insights and Forecast - By Country/Sub-region
- 15.1.1 Brazil
- 15.1.2 Argentina
- 15.1.3 Rest of South America
- 16. Competitive Analysis
- 16.1. Global Market Share Analysis 2024
- 16.2. Company Profiles
- 16.2.1 Hetero Healthcare Limited
- 16.2.1.1. Overview
- 16.2.1.2. Products
- 16.2.1.3. SWOT Analysis
- 16.2.1.4. Recent Developments
- 16.2.1.5. Financials (Based on Availability)
- 16.2.2 F Hoffmann-La Roche Ltd
- 16.2.2.1. Overview
- 16.2.2.2. Products
- 16.2.2.3. SWOT Analysis
- 16.2.2.4. Recent Developments
- 16.2.2.5. Financials (Based on Availability)
- 16.2.3 Cipla Inc
- 16.2.3.1. Overview
- 16.2.3.2. Products
- 16.2.3.3. SWOT Analysis
- 16.2.3.4. Recent Developments
- 16.2.3.5. Financials (Based on Availability)
- 16.2.4 Gilead Sciences Inc
- 16.2.4.1. Overview
- 16.2.4.2. Products
- 16.2.4.3. SWOT Analysis
- 16.2.4.4. Recent Developments
- 16.2.4.5. Financials (Based on Availability)
- 16.2.5 NATCO Pharma Limited
- 16.2.5.1. Overview
- 16.2.5.2. Products
- 16.2.5.3. SWOT Analysis
- 16.2.5.4. Recent Developments
- 16.2.5.5. Financials (Based on Availability)
- 16.2.6 Strides Pharma Science Limited
- 16.2.6.1. Overview
- 16.2.6.2. Products
- 16.2.6.3. SWOT Analysis
- 16.2.6.4. Recent Developments
- 16.2.6.5. Financials (Based on Availability)
- 16.2.7 Amneal Pharmaceuticals LLC
- 16.2.7.1. Overview
- 16.2.7.2. Products
- 16.2.7.3. SWOT Analysis
- 16.2.7.4. Recent Developments
- 16.2.7.5. Financials (Based on Availability)
- 16.2.8 Lupin Limited
- 16.2.8.1. Overview
- 16.2.8.2. Products
- 16.2.8.3. SWOT Analysis
- 16.2.8.4. Recent Developments
- 16.2.8.5. Financials (Based on Availability)
- 16.2.9 Alembic Pharmaceuticals Limited
- 16.2.9.1. Overview
- 16.2.9.2. Products
- 16.2.9.3. SWOT Analysis
- 16.2.9.4. Recent Developments
- 16.2.9.5. Financials (Based on Availability)
- 16.2.10 Macleods Pharmaceuticals Ltd
- 16.2.10.1. Overview
- 16.2.10.2. Products
- 16.2.10.3. SWOT Analysis
- 16.2.10.4. Recent Developments
- 16.2.10.5. Financials (Based on Availability)
- 16.2.11 Zydus Cadila
- 16.2.11.1. Overview
- 16.2.11.2. Products
- 16.2.11.3. SWOT Analysis
- 16.2.11.4. Recent Developments
- 16.2.11.5. Financials (Based on Availability)
- 16.2.1 Hetero Healthcare Limited
List of Figures
- Figure 1: Global Oseltamivir Industry Revenue Breakdown (Million, %) by Region 2024 & 2032
- Figure 2: Global Oseltamivir Industry Volume Breakdown (K Unit, %) by Region 2024 & 2032
- Figure 3: North America Oseltamivir Industry Revenue (Million), by Country 2024 & 2032
- Figure 4: North America Oseltamivir Industry Volume (K Unit), by Country 2024 & 2032
- Figure 5: North America Oseltamivir Industry Revenue Share (%), by Country 2024 & 2032
- Figure 6: North America Oseltamivir Industry Volume Share (%), by Country 2024 & 2032
- Figure 7: Europe Oseltamivir Industry Revenue (Million), by Country 2024 & 2032
- Figure 8: Europe Oseltamivir Industry Volume (K Unit), by Country 2024 & 2032
- Figure 9: Europe Oseltamivir Industry Revenue Share (%), by Country 2024 & 2032
- Figure 10: Europe Oseltamivir Industry Volume Share (%), by Country 2024 & 2032
- Figure 11: Asia Pacific Oseltamivir Industry Revenue (Million), by Country 2024 & 2032
- Figure 12: Asia Pacific Oseltamivir Industry Volume (K Unit), by Country 2024 & 2032
- Figure 13: Asia Pacific Oseltamivir Industry Revenue Share (%), by Country 2024 & 2032
- Figure 14: Asia Pacific Oseltamivir Industry Volume Share (%), by Country 2024 & 2032
- Figure 15: Middle East and Africa Oseltamivir Industry Revenue (Million), by Country 2024 & 2032
- Figure 16: Middle East and Africa Oseltamivir Industry Volume (K Unit), by Country 2024 & 2032
- Figure 17: Middle East and Africa Oseltamivir Industry Revenue Share (%), by Country 2024 & 2032
- Figure 18: Middle East and Africa Oseltamivir Industry Volume Share (%), by Country 2024 & 2032
- Figure 19: South America Oseltamivir Industry Revenue (Million), by Country 2024 & 2032
- Figure 20: South America Oseltamivir Industry Volume (K Unit), by Country 2024 & 2032
- Figure 21: South America Oseltamivir Industry Revenue Share (%), by Country 2024 & 2032
- Figure 22: South America Oseltamivir Industry Volume Share (%), by Country 2024 & 2032
- Figure 23: North America Oseltamivir Industry Revenue (Million), by Product Type 2024 & 2032
- Figure 24: North America Oseltamivir Industry Volume (K Unit), by Product Type 2024 & 2032
- Figure 25: North America Oseltamivir Industry Revenue Share (%), by Product Type 2024 & 2032
- Figure 26: North America Oseltamivir Industry Volume Share (%), by Product Type 2024 & 2032
- Figure 27: North America Oseltamivir Industry Revenue (Million), by Industry vertical 2024 & 2032
- Figure 28: North America Oseltamivir Industry Volume (K Unit), by Industry vertical 2024 & 2032
- Figure 29: North America Oseltamivir Industry Revenue Share (%), by Industry vertical 2024 & 2032
- Figure 30: North America Oseltamivir Industry Volume Share (%), by Industry vertical 2024 & 2032
- Figure 31: North America Oseltamivir Industry Revenue (Million), by Country 2024 & 2032
- Figure 32: North America Oseltamivir Industry Volume (K Unit), by Country 2024 & 2032
- Figure 33: North America Oseltamivir Industry Revenue Share (%), by Country 2024 & 2032
- Figure 34: North America Oseltamivir Industry Volume Share (%), by Country 2024 & 2032
- Figure 35: Europe Oseltamivir Industry Revenue (Million), by Product Type 2024 & 2032
- Figure 36: Europe Oseltamivir Industry Volume (K Unit), by Product Type 2024 & 2032
- Figure 37: Europe Oseltamivir Industry Revenue Share (%), by Product Type 2024 & 2032
- Figure 38: Europe Oseltamivir Industry Volume Share (%), by Product Type 2024 & 2032
- Figure 39: Europe Oseltamivir Industry Revenue (Million), by Industry vertical 2024 & 2032
- Figure 40: Europe Oseltamivir Industry Volume (K Unit), by Industry vertical 2024 & 2032
- Figure 41: Europe Oseltamivir Industry Revenue Share (%), by Industry vertical 2024 & 2032
- Figure 42: Europe Oseltamivir Industry Volume Share (%), by Industry vertical 2024 & 2032
- Figure 43: Europe Oseltamivir Industry Revenue (Million), by Country 2024 & 2032
- Figure 44: Europe Oseltamivir Industry Volume (K Unit), by Country 2024 & 2032
- Figure 45: Europe Oseltamivir Industry Revenue Share (%), by Country 2024 & 2032
- Figure 46: Europe Oseltamivir Industry Volume Share (%), by Country 2024 & 2032
- Figure 47: Asia Pacific Oseltamivir Industry Revenue (Million), by Product Type 2024 & 2032
- Figure 48: Asia Pacific Oseltamivir Industry Volume (K Unit), by Product Type 2024 & 2032
- Figure 49: Asia Pacific Oseltamivir Industry Revenue Share (%), by Product Type 2024 & 2032
- Figure 50: Asia Pacific Oseltamivir Industry Volume Share (%), by Product Type 2024 & 2032
- Figure 51: Asia Pacific Oseltamivir Industry Revenue (Million), by Industry vertical 2024 & 2032
- Figure 52: Asia Pacific Oseltamivir Industry Volume (K Unit), by Industry vertical 2024 & 2032
- Figure 53: Asia Pacific Oseltamivir Industry Revenue Share (%), by Industry vertical 2024 & 2032
- Figure 54: Asia Pacific Oseltamivir Industry Volume Share (%), by Industry vertical 2024 & 2032
- Figure 55: Asia Pacific Oseltamivir Industry Revenue (Million), by Country 2024 & 2032
- Figure 56: Asia Pacific Oseltamivir Industry Volume (K Unit), by Country 2024 & 2032
- Figure 57: Asia Pacific Oseltamivir Industry Revenue Share (%), by Country 2024 & 2032
- Figure 58: Asia Pacific Oseltamivir Industry Volume Share (%), by Country 2024 & 2032
- Figure 59: Middle East and Africa Oseltamivir Industry Revenue (Million), by Product Type 2024 & 2032
- Figure 60: Middle East and Africa Oseltamivir Industry Volume (K Unit), by Product Type 2024 & 2032
- Figure 61: Middle East and Africa Oseltamivir Industry Revenue Share (%), by Product Type 2024 & 2032
- Figure 62: Middle East and Africa Oseltamivir Industry Volume Share (%), by Product Type 2024 & 2032
- Figure 63: Middle East and Africa Oseltamivir Industry Revenue (Million), by Industry vertical 2024 & 2032
- Figure 64: Middle East and Africa Oseltamivir Industry Volume (K Unit), by Industry vertical 2024 & 2032
- Figure 65: Middle East and Africa Oseltamivir Industry Revenue Share (%), by Industry vertical 2024 & 2032
- Figure 66: Middle East and Africa Oseltamivir Industry Volume Share (%), by Industry vertical 2024 & 2032
- Figure 67: Middle East and Africa Oseltamivir Industry Revenue (Million), by Country 2024 & 2032
- Figure 68: Middle East and Africa Oseltamivir Industry Volume (K Unit), by Country 2024 & 2032
- Figure 69: Middle East and Africa Oseltamivir Industry Revenue Share (%), by Country 2024 & 2032
- Figure 70: Middle East and Africa Oseltamivir Industry Volume Share (%), by Country 2024 & 2032
- Figure 71: South America Oseltamivir Industry Revenue (Million), by Product Type 2024 & 2032
- Figure 72: South America Oseltamivir Industry Volume (K Unit), by Product Type 2024 & 2032
- Figure 73: South America Oseltamivir Industry Revenue Share (%), by Product Type 2024 & 2032
- Figure 74: South America Oseltamivir Industry Volume Share (%), by Product Type 2024 & 2032
- Figure 75: South America Oseltamivir Industry Revenue (Million), by Industry vertical 2024 & 2032
- Figure 76: South America Oseltamivir Industry Volume (K Unit), by Industry vertical 2024 & 2032
- Figure 77: South America Oseltamivir Industry Revenue Share (%), by Industry vertical 2024 & 2032
- Figure 78: South America Oseltamivir Industry Volume Share (%), by Industry vertical 2024 & 2032
- Figure 79: South America Oseltamivir Industry Revenue (Million), by Country 2024 & 2032
- Figure 80: South America Oseltamivir Industry Volume (K Unit), by Country 2024 & 2032
- Figure 81: South America Oseltamivir Industry Revenue Share (%), by Country 2024 & 2032
- Figure 82: South America Oseltamivir Industry Volume Share (%), by Country 2024 & 2032
List of Tables
- Table 1: Global Oseltamivir Industry Revenue Million Forecast, by Region 2019 & 2032
- Table 2: Global Oseltamivir Industry Volume K Unit Forecast, by Region 2019 & 2032
- Table 3: Global Oseltamivir Industry Revenue Million Forecast, by Product Type 2019 & 2032
- Table 4: Global Oseltamivir Industry Volume K Unit Forecast, by Product Type 2019 & 2032
- Table 5: Global Oseltamivir Industry Revenue Million Forecast, by Industry vertical 2019 & 2032
- Table 6: Global Oseltamivir Industry Volume K Unit Forecast, by Industry vertical 2019 & 2032
- Table 7: Global Oseltamivir Industry Revenue Million Forecast, by Region 2019 & 2032
- Table 8: Global Oseltamivir Industry Volume K Unit Forecast, by Region 2019 & 2032
- Table 9: Global Oseltamivir Industry Revenue Million Forecast, by Country 2019 & 2032
- Table 10: Global Oseltamivir Industry Volume K Unit Forecast, by Country 2019 & 2032
- Table 11: United States Oseltamivir Industry Revenue (Million) Forecast, by Application 2019 & 2032
- Table 12: United States Oseltamivir Industry Volume (K Unit) Forecast, by Application 2019 & 2032
- Table 13: Canada Oseltamivir Industry Revenue (Million) Forecast, by Application 2019 & 2032
- Table 14: Canada Oseltamivir Industry Volume (K Unit) Forecast, by Application 2019 & 2032
- Table 15: Mexico Oseltamivir Industry Revenue (Million) Forecast, by Application 2019 & 2032
- Table 16: Mexico Oseltamivir Industry Volume (K Unit) Forecast, by Application 2019 & 2032
- Table 17: Global Oseltamivir Industry Revenue Million Forecast, by Country 2019 & 2032
- Table 18: Global Oseltamivir Industry Volume K Unit Forecast, by Country 2019 & 2032
- Table 19: Germany Oseltamivir Industry Revenue (Million) Forecast, by Application 2019 & 2032
- Table 20: Germany Oseltamivir Industry Volume (K Unit) Forecast, by Application 2019 & 2032
- Table 21: United Kingdom Oseltamivir Industry Revenue (Million) Forecast, by Application 2019 & 2032
- Table 22: United Kingdom Oseltamivir Industry Volume (K Unit) Forecast, by Application 2019 & 2032
- Table 23: France Oseltamivir Industry Revenue (Million) Forecast, by Application 2019 & 2032
- Table 24: France Oseltamivir Industry Volume (K Unit) Forecast, by Application 2019 & 2032
- Table 25: Italy Oseltamivir Industry Revenue (Million) Forecast, by Application 2019 & 2032
- Table 26: Italy Oseltamivir Industry Volume (K Unit) Forecast, by Application 2019 & 2032
- Table 27: Spain Oseltamivir Industry Revenue (Million) Forecast, by Application 2019 & 2032
- Table 28: Spain Oseltamivir Industry Volume (K Unit) Forecast, by Application 2019 & 2032
- Table 29: Rest of Europe Oseltamivir Industry Revenue (Million) Forecast, by Application 2019 & 2032
- Table 30: Rest of Europe Oseltamivir Industry Volume (K Unit) Forecast, by Application 2019 & 2032
- Table 31: Global Oseltamivir Industry Revenue Million Forecast, by Country 2019 & 2032
- Table 32: Global Oseltamivir Industry Volume K Unit Forecast, by Country 2019 & 2032
- Table 33: China Oseltamivir Industry Revenue (Million) Forecast, by Application 2019 & 2032
- Table 34: China Oseltamivir Industry Volume (K Unit) Forecast, by Application 2019 & 2032
- Table 35: Japan Oseltamivir Industry Revenue (Million) Forecast, by Application 2019 & 2032
- Table 36: Japan Oseltamivir Industry Volume (K Unit) Forecast, by Application 2019 & 2032
- Table 37: India Oseltamivir Industry Revenue (Million) Forecast, by Application 2019 & 2032
- Table 38: India Oseltamivir Industry Volume (K Unit) Forecast, by Application 2019 & 2032
- Table 39: Australia Oseltamivir Industry Revenue (Million) Forecast, by Application 2019 & 2032
- Table 40: Australia Oseltamivir Industry Volume (K Unit) Forecast, by Application 2019 & 2032
- Table 41: South Korea Oseltamivir Industry Revenue (Million) Forecast, by Application 2019 & 2032
- Table 42: South Korea Oseltamivir Industry Volume (K Unit) Forecast, by Application 2019 & 2032
- Table 43: Rest of Asia Pacific Oseltamivir Industry Revenue (Million) Forecast, by Application 2019 & 2032
- Table 44: Rest of Asia Pacific Oseltamivir Industry Volume (K Unit) Forecast, by Application 2019 & 2032
- Table 45: Global Oseltamivir Industry Revenue Million Forecast, by Country 2019 & 2032
- Table 46: Global Oseltamivir Industry Volume K Unit Forecast, by Country 2019 & 2032
- Table 47: GCC Oseltamivir Industry Revenue (Million) Forecast, by Application 2019 & 2032
- Table 48: GCC Oseltamivir Industry Volume (K Unit) Forecast, by Application 2019 & 2032
- Table 49: South Africa Oseltamivir Industry Revenue (Million) Forecast, by Application 2019 & 2032
- Table 50: South Africa Oseltamivir Industry Volume (K Unit) Forecast, by Application 2019 & 2032
- Table 51: Rest of Middle East and Africa Oseltamivir Industry Revenue (Million) Forecast, by Application 2019 & 2032
- Table 52: Rest of Middle East and Africa Oseltamivir Industry Volume (K Unit) Forecast, by Application 2019 & 2032
- Table 53: Global Oseltamivir Industry Revenue Million Forecast, by Country 2019 & 2032
- Table 54: Global Oseltamivir Industry Volume K Unit Forecast, by Country 2019 & 2032
- Table 55: Brazil Oseltamivir Industry Revenue (Million) Forecast, by Application 2019 & 2032
- Table 56: Brazil Oseltamivir Industry Volume (K Unit) Forecast, by Application 2019 & 2032
- Table 57: Argentina Oseltamivir Industry Revenue (Million) Forecast, by Application 2019 & 2032
- Table 58: Argentina Oseltamivir Industry Volume (K Unit) Forecast, by Application 2019 & 2032
- Table 59: Rest of South America Oseltamivir Industry Revenue (Million) Forecast, by Application 2019 & 2032
- Table 60: Rest of South America Oseltamivir Industry Volume (K Unit) Forecast, by Application 2019 & 2032
- Table 61: Global Oseltamivir Industry Revenue Million Forecast, by Product Type 2019 & 2032
- Table 62: Global Oseltamivir Industry Volume K Unit Forecast, by Product Type 2019 & 2032
- Table 63: Global Oseltamivir Industry Revenue Million Forecast, by Industry vertical 2019 & 2032
- Table 64: Global Oseltamivir Industry Volume K Unit Forecast, by Industry vertical 2019 & 2032
- Table 65: Global Oseltamivir Industry Revenue Million Forecast, by Country 2019 & 2032
- Table 66: Global Oseltamivir Industry Volume K Unit Forecast, by Country 2019 & 2032
- Table 67: United States Oseltamivir Industry Revenue (Million) Forecast, by Application 2019 & 2032
- Table 68: United States Oseltamivir Industry Volume (K Unit) Forecast, by Application 2019 & 2032
- Table 69: Canada Oseltamivir Industry Revenue (Million) Forecast, by Application 2019 & 2032
- Table 70: Canada Oseltamivir Industry Volume (K Unit) Forecast, by Application 2019 & 2032
- Table 71: Mexico Oseltamivir Industry Revenue (Million) Forecast, by Application 2019 & 2032
- Table 72: Mexico Oseltamivir Industry Volume (K Unit) Forecast, by Application 2019 & 2032
- Table 73: Global Oseltamivir Industry Revenue Million Forecast, by Product Type 2019 & 2032
- Table 74: Global Oseltamivir Industry Volume K Unit Forecast, by Product Type 2019 & 2032
- Table 75: Global Oseltamivir Industry Revenue Million Forecast, by Industry vertical 2019 & 2032
- Table 76: Global Oseltamivir Industry Volume K Unit Forecast, by Industry vertical 2019 & 2032
- Table 77: Global Oseltamivir Industry Revenue Million Forecast, by Country 2019 & 2032
- Table 78: Global Oseltamivir Industry Volume K Unit Forecast, by Country 2019 & 2032
- Table 79: Germany Oseltamivir Industry Revenue (Million) Forecast, by Application 2019 & 2032
- Table 80: Germany Oseltamivir Industry Volume (K Unit) Forecast, by Application 2019 & 2032
- Table 81: United Kingdom Oseltamivir Industry Revenue (Million) Forecast, by Application 2019 & 2032
- Table 82: United Kingdom Oseltamivir Industry Volume (K Unit) Forecast, by Application 2019 & 2032
- Table 83: France Oseltamivir Industry Revenue (Million) Forecast, by Application 2019 & 2032
- Table 84: France Oseltamivir Industry Volume (K Unit) Forecast, by Application 2019 & 2032
- Table 85: Italy Oseltamivir Industry Revenue (Million) Forecast, by Application 2019 & 2032
- Table 86: Italy Oseltamivir Industry Volume (K Unit) Forecast, by Application 2019 & 2032
- Table 87: Spain Oseltamivir Industry Revenue (Million) Forecast, by Application 2019 & 2032
- Table 88: Spain Oseltamivir Industry Volume (K Unit) Forecast, by Application 2019 & 2032
- Table 89: Rest of Europe Oseltamivir Industry Revenue (Million) Forecast, by Application 2019 & 2032
- Table 90: Rest of Europe Oseltamivir Industry Volume (K Unit) Forecast, by Application 2019 & 2032
- Table 91: Global Oseltamivir Industry Revenue Million Forecast, by Product Type 2019 & 2032
- Table 92: Global Oseltamivir Industry Volume K Unit Forecast, by Product Type 2019 & 2032
- Table 93: Global Oseltamivir Industry Revenue Million Forecast, by Industry vertical 2019 & 2032
- Table 94: Global Oseltamivir Industry Volume K Unit Forecast, by Industry vertical 2019 & 2032
- Table 95: Global Oseltamivir Industry Revenue Million Forecast, by Country 2019 & 2032
- Table 96: Global Oseltamivir Industry Volume K Unit Forecast, by Country 2019 & 2032
- Table 97: China Oseltamivir Industry Revenue (Million) Forecast, by Application 2019 & 2032
- Table 98: China Oseltamivir Industry Volume (K Unit) Forecast, by Application 2019 & 2032
- Table 99: Japan Oseltamivir Industry Revenue (Million) Forecast, by Application 2019 & 2032
- Table 100: Japan Oseltamivir Industry Volume (K Unit) Forecast, by Application 2019 & 2032
- Table 101: India Oseltamivir Industry Revenue (Million) Forecast, by Application 2019 & 2032
- Table 102: India Oseltamivir Industry Volume (K Unit) Forecast, by Application 2019 & 2032
- Table 103: Australia Oseltamivir Industry Revenue (Million) Forecast, by Application 2019 & 2032
- Table 104: Australia Oseltamivir Industry Volume (K Unit) Forecast, by Application 2019 & 2032
- Table 105: South Korea Oseltamivir Industry Revenue (Million) Forecast, by Application 2019 & 2032
- Table 106: South Korea Oseltamivir Industry Volume (K Unit) Forecast, by Application 2019 & 2032
- Table 107: Rest of Asia Pacific Oseltamivir Industry Revenue (Million) Forecast, by Application 2019 & 2032
- Table 108: Rest of Asia Pacific Oseltamivir Industry Volume (K Unit) Forecast, by Application 2019 & 2032
- Table 109: Global Oseltamivir Industry Revenue Million Forecast, by Product Type 2019 & 2032
- Table 110: Global Oseltamivir Industry Volume K Unit Forecast, by Product Type 2019 & 2032
- Table 111: Global Oseltamivir Industry Revenue Million Forecast, by Industry vertical 2019 & 2032
- Table 112: Global Oseltamivir Industry Volume K Unit Forecast, by Industry vertical 2019 & 2032
- Table 113: Global Oseltamivir Industry Revenue Million Forecast, by Country 2019 & 2032
- Table 114: Global Oseltamivir Industry Volume K Unit Forecast, by Country 2019 & 2032
- Table 115: GCC Oseltamivir Industry Revenue (Million) Forecast, by Application 2019 & 2032
- Table 116: GCC Oseltamivir Industry Volume (K Unit) Forecast, by Application 2019 & 2032
- Table 117: South Africa Oseltamivir Industry Revenue (Million) Forecast, by Application 2019 & 2032
- Table 118: South Africa Oseltamivir Industry Volume (K Unit) Forecast, by Application 2019 & 2032
- Table 119: Rest of Middle East and Africa Oseltamivir Industry Revenue (Million) Forecast, by Application 2019 & 2032
- Table 120: Rest of Middle East and Africa Oseltamivir Industry Volume (K Unit) Forecast, by Application 2019 & 2032
- Table 121: Global Oseltamivir Industry Revenue Million Forecast, by Product Type 2019 & 2032
- Table 122: Global Oseltamivir Industry Volume K Unit Forecast, by Product Type 2019 & 2032
- Table 123: Global Oseltamivir Industry Revenue Million Forecast, by Industry vertical 2019 & 2032
- Table 124: Global Oseltamivir Industry Volume K Unit Forecast, by Industry vertical 2019 & 2032
- Table 125: Global Oseltamivir Industry Revenue Million Forecast, by Country 2019 & 2032
- Table 126: Global Oseltamivir Industry Volume K Unit Forecast, by Country 2019 & 2032
- Table 127: Brazil Oseltamivir Industry Revenue (Million) Forecast, by Application 2019 & 2032
- Table 128: Brazil Oseltamivir Industry Volume (K Unit) Forecast, by Application 2019 & 2032
- Table 129: Argentina Oseltamivir Industry Revenue (Million) Forecast, by Application 2019 & 2032
- Table 130: Argentina Oseltamivir Industry Volume (K Unit) Forecast, by Application 2019 & 2032
- Table 131: Rest of South America Oseltamivir Industry Revenue (Million) Forecast, by Application 2019 & 2032
- Table 132: Rest of South America Oseltamivir Industry Volume (K Unit) Forecast, by Application 2019 & 2032
Frequently Asked Questions
1. What is the projected Compound Annual Growth Rate (CAGR) of the Oseltamivir Industry?
The projected CAGR is approximately 3.20%.
2. Which companies are prominent players in the Oseltamivir Industry?
Key companies in the market include Hetero Healthcare Limited, F Hoffmann-La Roche Ltd, Cipla Inc, Gilead Sciences Inc, NATCO Pharma Limited, Strides Pharma Science Limited, Amneal Pharmaceuticals LLC, Lupin Limited, Alembic Pharmaceuticals Limited, Macleods Pharmaceuticals Ltd, Zydus Cadila.
3. What are the main segments of the Oseltamivir Industry?
The market segments include Product Type, Industry vertical.
4. Can you provide details about the market size?
The market size is estimated to be USD XX Million as of 2022.
5. What are some drivers contributing to market growth?
Rising Prevalence of Influenza Virus Infections; Increase in the Number of Research and Development Activities.
6. What are the notable trends driving market growth?
Influenza A Segment Expects to Register a High CAGR Over the Forecast Period.
7. Are there any restraints impacting market growth?
Side Effects Associated with Oseltamivir Treatment.
8. Can you provide examples of recent developments in the market?
October 2021: M.D. Anderson Cancer Center initiated a Phase II clinical study on the effect of baloxavir in combination with oseltamivir in treating severe influenza infection in patients who have previously received a hematopoietic (blood) stem cell transplant.
9. What pricing options are available for accessing the report?
Pricing options include single-user, multi-user, and enterprise licenses priced at USD 4750, USD 5250, and USD 8750 respectively.
10. Is the market size provided in terms of value or volume?
The market size is provided in terms of value, measured in Million and volume, measured in K Unit.
11. Are there any specific market keywords associated with the report?
Yes, the market keyword associated with the report is "Oseltamivir Industry," which aids in identifying and referencing the specific market segment covered.
12. How do I determine which pricing option suits my needs best?
The pricing options vary based on user requirements and access needs. Individual users may opt for single-user licenses, while businesses requiring broader access may choose multi-user or enterprise licenses for cost-effective access to the report.
13. Are there any additional resources or data provided in the Oseltamivir Industry report?
While the report offers comprehensive insights, it's advisable to review the specific contents or supplementary materials provided to ascertain if additional resources or data are available.
14. How can I stay updated on further developments or reports in the Oseltamivir Industry?
To stay informed about further developments, trends, and reports in the Oseltamivir Industry, consider subscribing to industry newsletters, following relevant companies and organizations, or regularly checking reputable industry news sources and publications.
Methodology
Step 1 - Identification of Relevant Samples Size from Population Database


Step 2 - Approaches for Defining Global Market Size (Value, Volume* & Price*)

Note*: In applicable scenarios
Step 3 - Data Sources
Primary Research
- Web Analytics
- Survey Reports
- Research Institute
- Latest Research Reports
- Opinion Leaders
Secondary Research
- Annual Reports
- White Paper
- Latest Press Release
- Industry Association
- Paid Database
- Investor Presentations

Step 4 - Data Triangulation
Involves using different sources of information in order to increase the validity of a study
These sources are likely to be stakeholders in a program - participants, other researchers, program staff, other community members, and so on.
Then we put all data in single framework & apply various statistical tools to find out the dynamic on the market.
During the analysis stage, feedback from the stakeholder groups would be compared to determine areas of agreement as well as areas of divergence
