

Key Insights
The Open Angle Glaucoma (OAG) therapeutics market is poised for substantial expansion, driven by an aging global demographic and the escalating incidence of OAG. With a projected CAGR of 10.19%, the market is estimated to reach 6.04 billion by 2025, building upon its robust performance in the forecast period (2025-2033). Key growth catalysts include pioneering advancements in pharmaceutical therapies, specifically the emergence of novel prostaglandin analogs and enhanced combination treatments designed to address unmet clinical needs in OAG management. Heightened public awareness of glaucoma and improved diagnostic technologies further contribute to market penetration. Despite challenges such as prohibitive treatment expenses and potential adverse drug reactions, the market outlook remains overwhelmingly positive. North America and Europe currently dominate market share, attributed to their advanced healthcare infrastructures and higher per capita healthcare expenditures. Nevertheless, the Asia-Pacific region presents a significant growth trajectory, fueled by increasing disposable incomes and burgeoning healthcare spending. Within the drug class segmentation, Prostaglandin Analogs are anticipated to maintain the largest market share due to their established efficacy and widespread adoption. Continuous research and development efforts are expected to introduce more effective and better-tolerated therapeutic solutions, further propelling market growth.
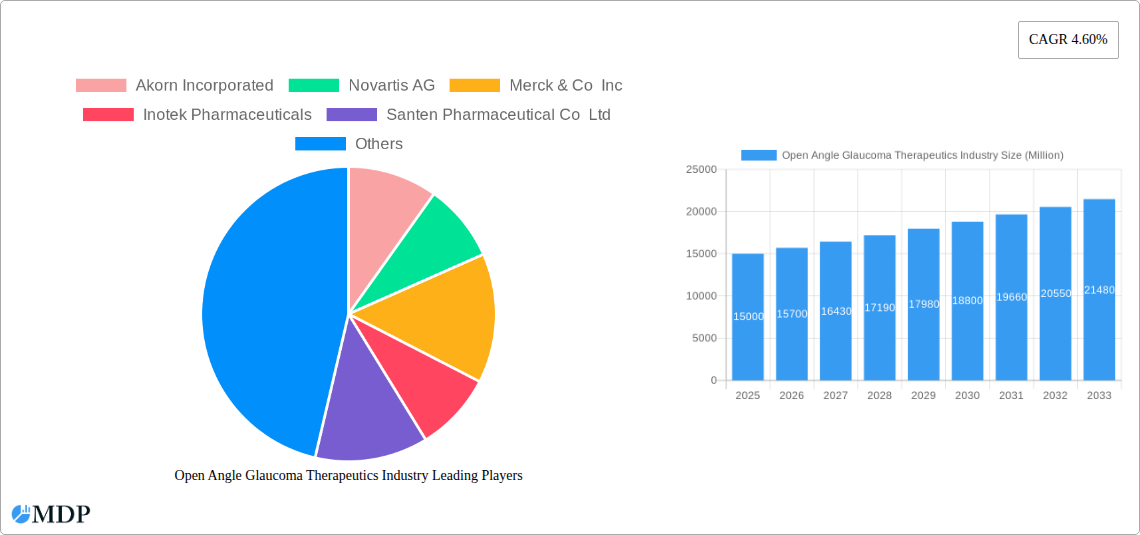
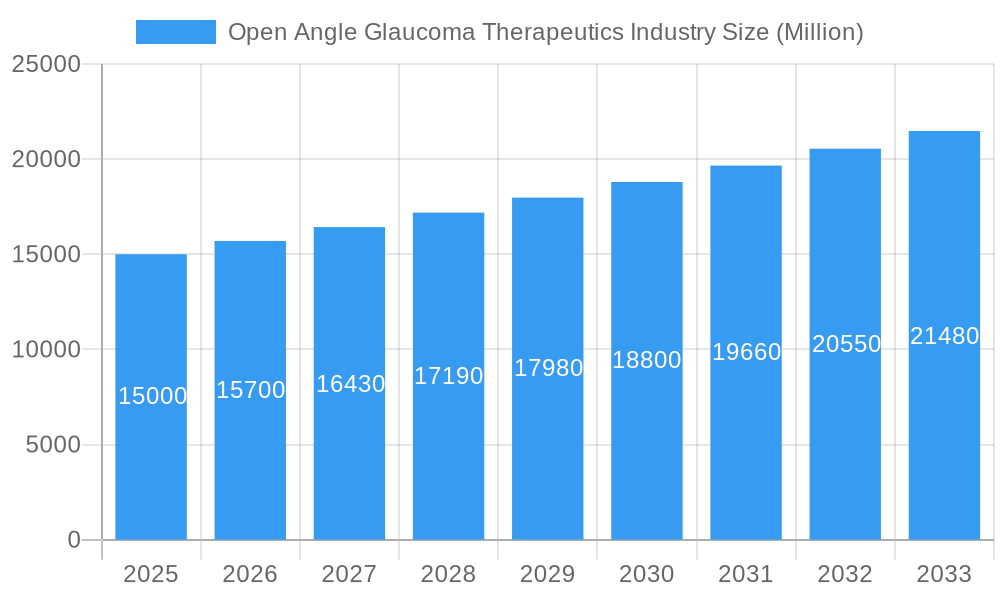
Open Angle Glaucoma Therapeutics Industry Market Size (In Billion)
The competitive arena features a dynamic interplay between established pharmaceutical leaders and innovative biotechnology firms. Major players such as Novartis, Merck, Bausch Health, and Allergan are actively engaged in strategic competition, leveraging their extensive product portfolios and robust R&D pipelines. Emerging companies are also gaining traction by specializing in niche therapeutic areas and pioneering novel treatment modalities. This competitive environment fosters innovation and ensures a comprehensive array of therapeutic options for patients. Future market expansion will hinge on successful clinical trials, timely regulatory approvals for new pharmaceutical agents, and continued advancements in minimally invasive surgical interventions, complementing pharmacotherapy for OAG. Strategic alliances and sustained investment in research are paramount to surmounting existing therapeutic limitations and improving patient prognoses.
Open Angle Glaucoma Therapeutics Industry Company Market Share
Open Angle Glaucoma Therapeutics Market Report: 2019-2033
Unlocking Growth Opportunities in a Multi-Billion Dollar Market
This comprehensive report provides an in-depth analysis of the Open Angle Glaucoma Therapeutics industry, offering valuable insights for stakeholders seeking to navigate this dynamic market landscape. The study period covers 2019-2033, with a base year of 2025 and a forecast period of 2025-2033. We project a market valued at xx Million in 2025, poised for significant growth. This report covers key market segments, leading players, and emerging trends, empowering informed decision-making and strategic planning.
Open Angle Glaucoma Therapeutics Industry Market Dynamics & Concentration
The Open Angle Glaucoma Therapeutics market is characterized by a moderately concentrated landscape, with key players such as Novartis AG, Merck & Co Inc, and Bausch Health (Bausch & Lomb Incorporated) holding significant market share. The market share of the top 5 players is estimated at xx%. Innovation is a critical driver, with companies continuously developing novel therapies to address unmet needs. Regulatory frameworks, including FDA approvals and pricing policies, significantly influence market dynamics. The presence of alternative treatments and evolving end-user preferences (e.g., preference for minimally invasive procedures) add to the complexity. Significant M&A activity (xx deals in the past 5 years) further shapes the competitive landscape. This includes both large-scale acquisitions and strategic partnerships aimed at expanding product portfolios and market reach. The report analyzes these factors in detail, providing a comprehensive understanding of market concentration and dynamics.
Open Angle Glaucoma Therapeutics Industry Industry Trends & Analysis
The Open Angle Glaucoma Therapeutics market exhibits a robust CAGR of xx% during the forecast period (2025-2033). Several factors contribute to this growth, including the rising prevalence of glaucoma globally, an aging population, and increased awareness of the disease. Technological advancements, such as the development of novel drug delivery systems and minimally invasive surgical techniques, are significantly impacting treatment approaches. Consumer preferences are shifting towards personalized medicine and convenient treatment options, creating opportunities for innovative therapies. The competitive landscape is marked by intense rivalry, with companies engaged in continuous product development and strategic collaborations to gain market share. Market penetration of newer drug classes is steadily increasing, particularly in developing economies with expanding access to healthcare.
Leading Markets & Segments in Open Angle Glaucoma Therapeutics Industry
The North American market currently dominates the Open Angle Glaucoma Therapeutics industry, driven by high healthcare expenditure, advanced healthcare infrastructure, and a large patient pool. However, the Asia-Pacific region is projected to witness significant growth due to increasing prevalence of glaucoma and rising healthcare awareness.
Key Drivers for Dominant Regions:
- North America: High healthcare expenditure, advanced research and development infrastructure, early adoption of new technologies.
- Europe: Well-established healthcare systems, robust regulatory frameworks, strong pharmaceutical industry presence.
- Asia-Pacific: Rapidly growing population, increasing healthcare expenditure, rising prevalence of glaucoma.
Leading Segments (Indication):
- Open Angle Glaucoma represents the largest segment, accounting for xx% of the market due to its high prevalence.
- Closed Angle Glaucoma and Secondary Glaucoma also exhibit notable growth potential.
- Congenital Glaucoma and Other indications contribute to a smaller, albeit growing, segment of the market.
Leading Segments (Drug Class):
- Prostaglandin Analogs maintain the largest market share, owing to their efficacy and established market presence.
- Beta Blockers, Alpha Agonists, and Carbonic Anhydrase Inhibitors also hold substantial market share.
Open Angle Glaucoma Therapeutics Industry Product Developments
Recent product innovations have focused on improving drug efficacy, reducing side effects, and enhancing patient compliance. This includes advancements in drug delivery systems, such as sustained-release formulations and implants. These developments cater to the growing demand for convenient and effective treatment options. Companies are also exploring novel drug targets and mechanisms of action to address unmet medical needs. The market fit for these new products is assessed based on efficacy, safety, and cost-effectiveness.
Key Drivers of Open Angle Glaucoma Therapeutics Industry Growth
Several key factors drive the growth of the Open Angle Glaucoma Therapeutics market. These include:
- Rising prevalence of glaucoma: The global burden of glaucoma is increasing, creating significant demand for treatment options.
- Technological advancements: Innovation in drug delivery systems and surgical techniques are improving treatment outcomes.
- Favorable regulatory environment: Approvals of novel therapies and supportive regulatory policies stimulate market growth.
- Increased healthcare spending: Growing investments in healthcare infrastructure and access to treatment contribute to market expansion.
Challenges in the Open Angle Glaucoma Therapeutics Industry Market
The Open Angle Glaucoma Therapeutics market faces several challenges:
- High cost of treatment: The expense associated with glaucoma therapies presents a barrier to access, especially in low- and middle-income countries.
- Intense competition: A large number of players compete in the market, leading to intense price competition and market saturation.
- Regulatory hurdles: The stringent regulatory approval process can delay the launch of new products. This creates an environment of market competition with a focus on FDA approvals.
Emerging Opportunities in Open Angle Glaucoma Therapeutics Industry
Several factors present significant long-term growth opportunities:
- Development of novel therapies: The pipeline of innovative treatments focusing on new drug targets and mechanisms offers considerable potential.
- Strategic partnerships and collaborations: Partnerships between pharmaceutical companies and technology providers are streamlining drug discovery and development.
- Expansion into emerging markets: Untapped markets in developing countries present significant growth opportunities.
Leading Players in the Open Angle Glaucoma Therapeutics Industry Sector
Key Milestones in Open Angle Glaucoma Therapeutics Industry Industry
- 2020: FDA approval of a novel glaucoma therapy by Company X.
- 2022: Launch of a new drug delivery system by Company Y.
- 2023: Merger of two key players in the glaucoma therapeutics market.
- 2024: Significant investment in R&D by leading players to create new therapies.
Strategic Outlook for Open Angle Glaucoma Therapeutics Market
The Open Angle Glaucoma Therapeutics market is poised for sustained growth, driven by technological advancements, increased awareness, and the rising prevalence of the disease. Strategic partnerships and collaborations will play a critical role in accelerating innovation and expanding market reach. Companies that focus on developing novel therapies, personalized medicine approaches, and effective drug delivery systems are expected to gain a competitive edge. The focus on improving access to treatment in underserved populations presents significant opportunities for expansion and social impact.
Open Angle Glaucoma Therapeutics Industry Segmentation
-
1. Indication
- 1.1. Open Angle Glaucoma
- 1.2. Closed Angle Glaucoma
- 1.3. Secondary Glaucoma
- 1.4. Congenital Glaucoma
- 1.5. Others
-
2. Drug Class
- 2.1. Prostaglandin Analogs
- 2.2. Beta Blockers
- 2.3. Alpha Agonist
- 2.4. Carbonic Anhydrase Inhibitors
- 2.5. Others
Open Angle Glaucoma Therapeutics Industry Segmentation By Geography
-
1. North America
- 1.1. United States
- 1.2. Canada
- 1.3. Mexico
-
2. Europe
- 2.1. Germany
- 2.2. United Kingdom
- 2.3. France
- 2.4. Italy
- 2.5. Spain
- 2.6. Rest of Europe
-
3. Asia Pacific
- 3.1. China
- 3.2. Japan
- 3.3. India
- 3.4. Australia
- 3.5. South Korea
- 3.6. Rest of Asia Pacific
-
4. Middle East and Africa
- 4.1. GCC
- 4.2. South Africa
- 4.3. Rest of Middle East and Africa
-
5. South America
- 5.1. Brazil
- 5.2. Argentina
- 5.3. Rest of South America
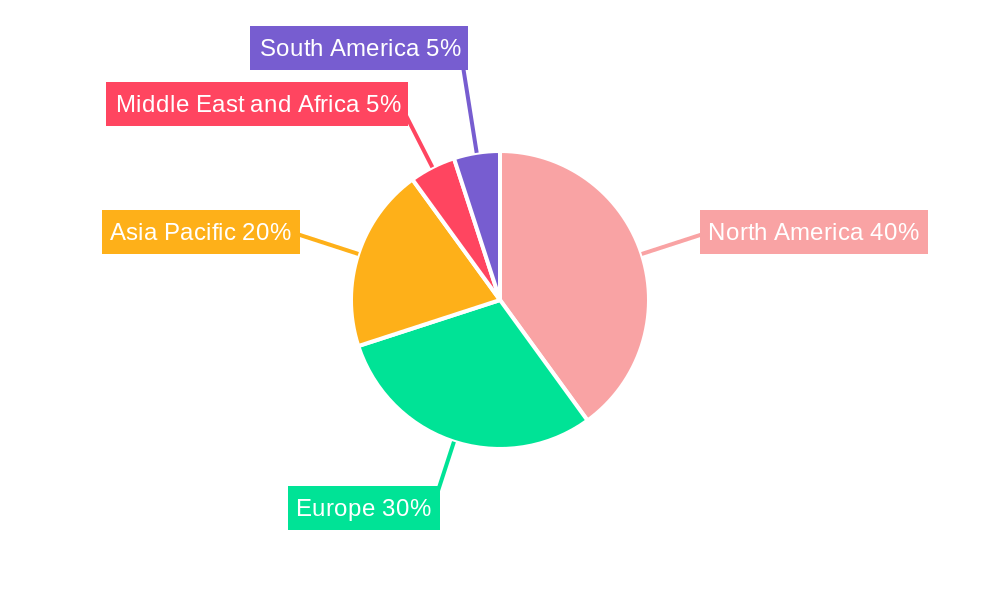
Open Angle Glaucoma Therapeutics Industry Regional Market Share
Geographic Coverage of Open Angle Glaucoma Therapeutics Industry
Open Angle Glaucoma Therapeutics Industry REPORT HIGHLIGHTS
| Aspects | Details |
|---|---|
| Study Period | 2020-2034 |
| Base Year | 2025 |
| Estimated Year | 2026 |
| Forecast Period | 2026-2034 |
| Historical Period | 2020-2025 |
| Growth Rate | CAGR of 10.19% from 2020-2034 |
| Segmentation |
|
Table of Contents
- 1. Introduction
- 1.1. Research Scope
- 1.2. Market Segmentation
- 1.3. Research Methodology
- 1.4. Definitions and Assumptions
- 2. Executive Summary
- 2.1. Introduction
- 3. Market Dynamics
- 3.1. Introduction
- 3.2. Market Drivers
- 3.2.1. ; Increasing Prevalence of Glaucoma; Rising Initiatives to Increase Awareness about the Glaucoma; Technological Advancements in the Field of Ophthalmology
- 3.3. Market Restrains
- 3.3.1. ; Side Effects associated with the Products; Stringent Approval Process
- 3.4. Market Trends
- 3.4.1. Prostaglandin Analogs is the Segment by Drug Class that is Expected to Witness Fastest Growth Over the Forecast Period
- 4. Market Factor Analysis
- 4.1. Porters Five Forces
- 4.2. Supply/Value Chain
- 4.3. PESTEL analysis
- 4.4. Market Entropy
- 4.5. Patent/Trademark Analysis
- 5. Global Open Angle Glaucoma Therapeutics Industry Analysis, Insights and Forecast, 2020-2032
- 5.1. Market Analysis, Insights and Forecast - by Indication
- 5.1.1. Open Angle Glaucoma
- 5.1.2. Closed Angle Glaucoma
- 5.1.3. Secondary Glaucoma
- 5.1.4. Congenital Glaucoma
- 5.1.5. Others
- 5.2. Market Analysis, Insights and Forecast - by Drug Class
- 5.2.1. Prostaglandin Analogs
- 5.2.2. Beta Blockers
- 5.2.3. Alpha Agonist
- 5.2.4. Carbonic Anhydrase Inhibitors
- 5.2.5. Others
- 5.3. Market Analysis, Insights and Forecast - by Region
- 5.3.1. North America
- 5.3.2. Europe
- 5.3.3. Asia Pacific
- 5.3.4. Middle East and Africa
- 5.3.5. South America
- 5.1. Market Analysis, Insights and Forecast - by Indication
- 6. North America Open Angle Glaucoma Therapeutics Industry Analysis, Insights and Forecast, 2020-2032
- 6.1. Market Analysis, Insights and Forecast - by Indication
- 6.1.1. Open Angle Glaucoma
- 6.1.2. Closed Angle Glaucoma
- 6.1.3. Secondary Glaucoma
- 6.1.4. Congenital Glaucoma
- 6.1.5. Others
- 6.2. Market Analysis, Insights and Forecast - by Drug Class
- 6.2.1. Prostaglandin Analogs
- 6.2.2. Beta Blockers
- 6.2.3. Alpha Agonist
- 6.2.4. Carbonic Anhydrase Inhibitors
- 6.2.5. Others
- 6.1. Market Analysis, Insights and Forecast - by Indication
- 7. Europe Open Angle Glaucoma Therapeutics Industry Analysis, Insights and Forecast, 2020-2032
- 7.1. Market Analysis, Insights and Forecast - by Indication
- 7.1.1. Open Angle Glaucoma
- 7.1.2. Closed Angle Glaucoma
- 7.1.3. Secondary Glaucoma
- 7.1.4. Congenital Glaucoma
- 7.1.5. Others
- 7.2. Market Analysis, Insights and Forecast - by Drug Class
- 7.2.1. Prostaglandin Analogs
- 7.2.2. Beta Blockers
- 7.2.3. Alpha Agonist
- 7.2.4. Carbonic Anhydrase Inhibitors
- 7.2.5. Others
- 7.1. Market Analysis, Insights and Forecast - by Indication
- 8. Asia Pacific Open Angle Glaucoma Therapeutics Industry Analysis, Insights and Forecast, 2020-2032
- 8.1. Market Analysis, Insights and Forecast - by Indication
- 8.1.1. Open Angle Glaucoma
- 8.1.2. Closed Angle Glaucoma
- 8.1.3. Secondary Glaucoma
- 8.1.4. Congenital Glaucoma
- 8.1.5. Others
- 8.2. Market Analysis, Insights and Forecast - by Drug Class
- 8.2.1. Prostaglandin Analogs
- 8.2.2. Beta Blockers
- 8.2.3. Alpha Agonist
- 8.2.4. Carbonic Anhydrase Inhibitors
- 8.2.5. Others
- 8.1. Market Analysis, Insights and Forecast - by Indication
- 9. Middle East and Africa Open Angle Glaucoma Therapeutics Industry Analysis, Insights and Forecast, 2020-2032
- 9.1. Market Analysis, Insights and Forecast - by Indication
- 9.1.1. Open Angle Glaucoma
- 9.1.2. Closed Angle Glaucoma
- 9.1.3. Secondary Glaucoma
- 9.1.4. Congenital Glaucoma
- 9.1.5. Others
- 9.2. Market Analysis, Insights and Forecast - by Drug Class
- 9.2.1. Prostaglandin Analogs
- 9.2.2. Beta Blockers
- 9.2.3. Alpha Agonist
- 9.2.4. Carbonic Anhydrase Inhibitors
- 9.2.5. Others
- 9.1. Market Analysis, Insights and Forecast - by Indication
- 10. South America Open Angle Glaucoma Therapeutics Industry Analysis, Insights and Forecast, 2020-2032
- 10.1. Market Analysis, Insights and Forecast - by Indication
- 10.1.1. Open Angle Glaucoma
- 10.1.2. Closed Angle Glaucoma
- 10.1.3. Secondary Glaucoma
- 10.1.4. Congenital Glaucoma
- 10.1.5. Others
- 10.2. Market Analysis, Insights and Forecast - by Drug Class
- 10.2.1. Prostaglandin Analogs
- 10.2.2. Beta Blockers
- 10.2.3. Alpha Agonist
- 10.2.4. Carbonic Anhydrase Inhibitors
- 10.2.5. Others
- 10.1. Market Analysis, Insights and Forecast - by Indication
- 11. Competitive Analysis
- 11.1. Global Market Share Analysis 2025
- 11.2. Company Profiles
- 11.2.1 Akorn Incorporated
- 11.2.1.1. Overview
- 11.2.1.2. Products
- 11.2.1.3. SWOT Analysis
- 11.2.1.4. Recent Developments
- 11.2.1.5. Financials (Based on Availability)
- 11.2.2 Novartis AG
- 11.2.2.1. Overview
- 11.2.2.2. Products
- 11.2.2.3. SWOT Analysis
- 11.2.2.4. Recent Developments
- 11.2.2.5. Financials (Based on Availability)
- 11.2.3 Merck & Co Inc
- 11.2.3.1. Overview
- 11.2.3.2. Products
- 11.2.3.3. SWOT Analysis
- 11.2.3.4. Recent Developments
- 11.2.3.5. Financials (Based on Availability)
- 11.2.4 Inotek Pharmaceuticals
- 11.2.4.1. Overview
- 11.2.4.2. Products
- 11.2.4.3. SWOT Analysis
- 11.2.4.4. Recent Developments
- 11.2.4.5. Financials (Based on Availability)
- 11.2.5 Santen Pharmaceutical Co Ltd
- 11.2.5.1. Overview
- 11.2.5.2. Products
- 11.2.5.3. SWOT Analysis
- 11.2.5.4. Recent Developments
- 11.2.5.5. Financials (Based on Availability)
- 11.2.6 Bausch Health (Bausch & Lomb Incorporated)
- 11.2.6.1. Overview
- 11.2.6.2. Products
- 11.2.6.3. SWOT Analysis
- 11.2.6.4. Recent Developments
- 11.2.6.5. Financials (Based on Availability)
- 11.2.7 Aerie Pharmaceuticals Inc
- 11.2.7.1. Overview
- 11.2.7.2. Products
- 11.2.7.3. SWOT Analysis
- 11.2.7.4. Recent Developments
- 11.2.7.5. Financials (Based on Availability)
- 11.2.8 Pfizer Inc
- 11.2.8.1. Overview
- 11.2.8.2. Products
- 11.2.8.3. SWOT Analysis
- 11.2.8.4. Recent Developments
- 11.2.8.5. Financials (Based on Availability)
- 11.2.9 Abbvie Inc (Allergan Plc)
- 11.2.9.1. Overview
- 11.2.9.2. Products
- 11.2.9.3. SWOT Analysis
- 11.2.9.4. Recent Developments
- 11.2.9.5. Financials (Based on Availability)
- 11.2.1 Akorn Incorporated
List of Figures
- Figure 1: Global Open Angle Glaucoma Therapeutics Industry Revenue Breakdown (billion, %) by Region 2025 & 2033
- Figure 2: Global Open Angle Glaucoma Therapeutics Industry Volume Breakdown (K Unit, %) by Region 2025 & 2033
- Figure 3: North America Open Angle Glaucoma Therapeutics Industry Revenue (billion), by Indication 2025 & 2033
- Figure 4: North America Open Angle Glaucoma Therapeutics Industry Volume (K Unit), by Indication 2025 & 2033
- Figure 5: North America Open Angle Glaucoma Therapeutics Industry Revenue Share (%), by Indication 2025 & 2033
- Figure 6: North America Open Angle Glaucoma Therapeutics Industry Volume Share (%), by Indication 2025 & 2033
- Figure 7: North America Open Angle Glaucoma Therapeutics Industry Revenue (billion), by Drug Class 2025 & 2033
- Figure 8: North America Open Angle Glaucoma Therapeutics Industry Volume (K Unit), by Drug Class 2025 & 2033
- Figure 9: North America Open Angle Glaucoma Therapeutics Industry Revenue Share (%), by Drug Class 2025 & 2033
- Figure 10: North America Open Angle Glaucoma Therapeutics Industry Volume Share (%), by Drug Class 2025 & 2033
- Figure 11: North America Open Angle Glaucoma Therapeutics Industry Revenue (billion), by Country 2025 & 2033
- Figure 12: North America Open Angle Glaucoma Therapeutics Industry Volume (K Unit), by Country 2025 & 2033
- Figure 13: North America Open Angle Glaucoma Therapeutics Industry Revenue Share (%), by Country 2025 & 2033
- Figure 14: North America Open Angle Glaucoma Therapeutics Industry Volume Share (%), by Country 2025 & 2033
- Figure 15: Europe Open Angle Glaucoma Therapeutics Industry Revenue (billion), by Indication 2025 & 2033
- Figure 16: Europe Open Angle Glaucoma Therapeutics Industry Volume (K Unit), by Indication 2025 & 2033
- Figure 17: Europe Open Angle Glaucoma Therapeutics Industry Revenue Share (%), by Indication 2025 & 2033
- Figure 18: Europe Open Angle Glaucoma Therapeutics Industry Volume Share (%), by Indication 2025 & 2033
- Figure 19: Europe Open Angle Glaucoma Therapeutics Industry Revenue (billion), by Drug Class 2025 & 2033
- Figure 20: Europe Open Angle Glaucoma Therapeutics Industry Volume (K Unit), by Drug Class 2025 & 2033
- Figure 21: Europe Open Angle Glaucoma Therapeutics Industry Revenue Share (%), by Drug Class 2025 & 2033
- Figure 22: Europe Open Angle Glaucoma Therapeutics Industry Volume Share (%), by Drug Class 2025 & 2033
- Figure 23: Europe Open Angle Glaucoma Therapeutics Industry Revenue (billion), by Country 2025 & 2033
- Figure 24: Europe Open Angle Glaucoma Therapeutics Industry Volume (K Unit), by Country 2025 & 2033
- Figure 25: Europe Open Angle Glaucoma Therapeutics Industry Revenue Share (%), by Country 2025 & 2033
- Figure 26: Europe Open Angle Glaucoma Therapeutics Industry Volume Share (%), by Country 2025 & 2033
- Figure 27: Asia Pacific Open Angle Glaucoma Therapeutics Industry Revenue (billion), by Indication 2025 & 2033
- Figure 28: Asia Pacific Open Angle Glaucoma Therapeutics Industry Volume (K Unit), by Indication 2025 & 2033
- Figure 29: Asia Pacific Open Angle Glaucoma Therapeutics Industry Revenue Share (%), by Indication 2025 & 2033
- Figure 30: Asia Pacific Open Angle Glaucoma Therapeutics Industry Volume Share (%), by Indication 2025 & 2033
- Figure 31: Asia Pacific Open Angle Glaucoma Therapeutics Industry Revenue (billion), by Drug Class 2025 & 2033
- Figure 32: Asia Pacific Open Angle Glaucoma Therapeutics Industry Volume (K Unit), by Drug Class 2025 & 2033
- Figure 33: Asia Pacific Open Angle Glaucoma Therapeutics Industry Revenue Share (%), by Drug Class 2025 & 2033
- Figure 34: Asia Pacific Open Angle Glaucoma Therapeutics Industry Volume Share (%), by Drug Class 2025 & 2033
- Figure 35: Asia Pacific Open Angle Glaucoma Therapeutics Industry Revenue (billion), by Country 2025 & 2033
- Figure 36: Asia Pacific Open Angle Glaucoma Therapeutics Industry Volume (K Unit), by Country 2025 & 2033
- Figure 37: Asia Pacific Open Angle Glaucoma Therapeutics Industry Revenue Share (%), by Country 2025 & 2033
- Figure 38: Asia Pacific Open Angle Glaucoma Therapeutics Industry Volume Share (%), by Country 2025 & 2033
- Figure 39: Middle East and Africa Open Angle Glaucoma Therapeutics Industry Revenue (billion), by Indication 2025 & 2033
- Figure 40: Middle East and Africa Open Angle Glaucoma Therapeutics Industry Volume (K Unit), by Indication 2025 & 2033
- Figure 41: Middle East and Africa Open Angle Glaucoma Therapeutics Industry Revenue Share (%), by Indication 2025 & 2033
- Figure 42: Middle East and Africa Open Angle Glaucoma Therapeutics Industry Volume Share (%), by Indication 2025 & 2033
- Figure 43: Middle East and Africa Open Angle Glaucoma Therapeutics Industry Revenue (billion), by Drug Class 2025 & 2033
- Figure 44: Middle East and Africa Open Angle Glaucoma Therapeutics Industry Volume (K Unit), by Drug Class 2025 & 2033
- Figure 45: Middle East and Africa Open Angle Glaucoma Therapeutics Industry Revenue Share (%), by Drug Class 2025 & 2033
- Figure 46: Middle East and Africa Open Angle Glaucoma Therapeutics Industry Volume Share (%), by Drug Class 2025 & 2033
- Figure 47: Middle East and Africa Open Angle Glaucoma Therapeutics Industry Revenue (billion), by Country 2025 & 2033
- Figure 48: Middle East and Africa Open Angle Glaucoma Therapeutics Industry Volume (K Unit), by Country 2025 & 2033
- Figure 49: Middle East and Africa Open Angle Glaucoma Therapeutics Industry Revenue Share (%), by Country 2025 & 2033
- Figure 50: Middle East and Africa Open Angle Glaucoma Therapeutics Industry Volume Share (%), by Country 2025 & 2033
- Figure 51: South America Open Angle Glaucoma Therapeutics Industry Revenue (billion), by Indication 2025 & 2033
- Figure 52: South America Open Angle Glaucoma Therapeutics Industry Volume (K Unit), by Indication 2025 & 2033
- Figure 53: South America Open Angle Glaucoma Therapeutics Industry Revenue Share (%), by Indication 2025 & 2033
- Figure 54: South America Open Angle Glaucoma Therapeutics Industry Volume Share (%), by Indication 2025 & 2033
- Figure 55: South America Open Angle Glaucoma Therapeutics Industry Revenue (billion), by Drug Class 2025 & 2033
- Figure 56: South America Open Angle Glaucoma Therapeutics Industry Volume (K Unit), by Drug Class 2025 & 2033
- Figure 57: South America Open Angle Glaucoma Therapeutics Industry Revenue Share (%), by Drug Class 2025 & 2033
- Figure 58: South America Open Angle Glaucoma Therapeutics Industry Volume Share (%), by Drug Class 2025 & 2033
- Figure 59: South America Open Angle Glaucoma Therapeutics Industry Revenue (billion), by Country 2025 & 2033
- Figure 60: South America Open Angle Glaucoma Therapeutics Industry Volume (K Unit), by Country 2025 & 2033
- Figure 61: South America Open Angle Glaucoma Therapeutics Industry Revenue Share (%), by Country 2025 & 2033
- Figure 62: South America Open Angle Glaucoma Therapeutics Industry Volume Share (%), by Country 2025 & 2033
List of Tables
- Table 1: Global Open Angle Glaucoma Therapeutics Industry Revenue billion Forecast, by Indication 2020 & 2033
- Table 2: Global Open Angle Glaucoma Therapeutics Industry Volume K Unit Forecast, by Indication 2020 & 2033
- Table 3: Global Open Angle Glaucoma Therapeutics Industry Revenue billion Forecast, by Drug Class 2020 & 2033
- Table 4: Global Open Angle Glaucoma Therapeutics Industry Volume K Unit Forecast, by Drug Class 2020 & 2033
- Table 5: Global Open Angle Glaucoma Therapeutics Industry Revenue billion Forecast, by Region 2020 & 2033
- Table 6: Global Open Angle Glaucoma Therapeutics Industry Volume K Unit Forecast, by Region 2020 & 2033
- Table 7: Global Open Angle Glaucoma Therapeutics Industry Revenue billion Forecast, by Indication 2020 & 2033
- Table 8: Global Open Angle Glaucoma Therapeutics Industry Volume K Unit Forecast, by Indication 2020 & 2033
- Table 9: Global Open Angle Glaucoma Therapeutics Industry Revenue billion Forecast, by Drug Class 2020 & 2033
- Table 10: Global Open Angle Glaucoma Therapeutics Industry Volume K Unit Forecast, by Drug Class 2020 & 2033
- Table 11: Global Open Angle Glaucoma Therapeutics Industry Revenue billion Forecast, by Country 2020 & 2033
- Table 12: Global Open Angle Glaucoma Therapeutics Industry Volume K Unit Forecast, by Country 2020 & 2033
- Table 13: United States Open Angle Glaucoma Therapeutics Industry Revenue (billion) Forecast, by Application 2020 & 2033
- Table 14: United States Open Angle Glaucoma Therapeutics Industry Volume (K Unit) Forecast, by Application 2020 & 2033
- Table 15: Canada Open Angle Glaucoma Therapeutics Industry Revenue (billion) Forecast, by Application 2020 & 2033
- Table 16: Canada Open Angle Glaucoma Therapeutics Industry Volume (K Unit) Forecast, by Application 2020 & 2033
- Table 17: Mexico Open Angle Glaucoma Therapeutics Industry Revenue (billion) Forecast, by Application 2020 & 2033
- Table 18: Mexico Open Angle Glaucoma Therapeutics Industry Volume (K Unit) Forecast, by Application 2020 & 2033
- Table 19: Global Open Angle Glaucoma Therapeutics Industry Revenue billion Forecast, by Indication 2020 & 2033
- Table 20: Global Open Angle Glaucoma Therapeutics Industry Volume K Unit Forecast, by Indication 2020 & 2033
- Table 21: Global Open Angle Glaucoma Therapeutics Industry Revenue billion Forecast, by Drug Class 2020 & 2033
- Table 22: Global Open Angle Glaucoma Therapeutics Industry Volume K Unit Forecast, by Drug Class 2020 & 2033
- Table 23: Global Open Angle Glaucoma Therapeutics Industry Revenue billion Forecast, by Country 2020 & 2033
- Table 24: Global Open Angle Glaucoma Therapeutics Industry Volume K Unit Forecast, by Country 2020 & 2033
- Table 25: Germany Open Angle Glaucoma Therapeutics Industry Revenue (billion) Forecast, by Application 2020 & 2033
- Table 26: Germany Open Angle Glaucoma Therapeutics Industry Volume (K Unit) Forecast, by Application 2020 & 2033
- Table 27: United Kingdom Open Angle Glaucoma Therapeutics Industry Revenue (billion) Forecast, by Application 2020 & 2033
- Table 28: United Kingdom Open Angle Glaucoma Therapeutics Industry Volume (K Unit) Forecast, by Application 2020 & 2033
- Table 29: France Open Angle Glaucoma Therapeutics Industry Revenue (billion) Forecast, by Application 2020 & 2033
- Table 30: France Open Angle Glaucoma Therapeutics Industry Volume (K Unit) Forecast, by Application 2020 & 2033
- Table 31: Italy Open Angle Glaucoma Therapeutics Industry Revenue (billion) Forecast, by Application 2020 & 2033
- Table 32: Italy Open Angle Glaucoma Therapeutics Industry Volume (K Unit) Forecast, by Application 2020 & 2033
- Table 33: Spain Open Angle Glaucoma Therapeutics Industry Revenue (billion) Forecast, by Application 2020 & 2033
- Table 34: Spain Open Angle Glaucoma Therapeutics Industry Volume (K Unit) Forecast, by Application 2020 & 2033
- Table 35: Rest of Europe Open Angle Glaucoma Therapeutics Industry Revenue (billion) Forecast, by Application 2020 & 2033
- Table 36: Rest of Europe Open Angle Glaucoma Therapeutics Industry Volume (K Unit) Forecast, by Application 2020 & 2033
- Table 37: Global Open Angle Glaucoma Therapeutics Industry Revenue billion Forecast, by Indication 2020 & 2033
- Table 38: Global Open Angle Glaucoma Therapeutics Industry Volume K Unit Forecast, by Indication 2020 & 2033
- Table 39: Global Open Angle Glaucoma Therapeutics Industry Revenue billion Forecast, by Drug Class 2020 & 2033
- Table 40: Global Open Angle Glaucoma Therapeutics Industry Volume K Unit Forecast, by Drug Class 2020 & 2033
- Table 41: Global Open Angle Glaucoma Therapeutics Industry Revenue billion Forecast, by Country 2020 & 2033
- Table 42: Global Open Angle Glaucoma Therapeutics Industry Volume K Unit Forecast, by Country 2020 & 2033
- Table 43: China Open Angle Glaucoma Therapeutics Industry Revenue (billion) Forecast, by Application 2020 & 2033
- Table 44: China Open Angle Glaucoma Therapeutics Industry Volume (K Unit) Forecast, by Application 2020 & 2033
- Table 45: Japan Open Angle Glaucoma Therapeutics Industry Revenue (billion) Forecast, by Application 2020 & 2033
- Table 46: Japan Open Angle Glaucoma Therapeutics Industry Volume (K Unit) Forecast, by Application 2020 & 2033
- Table 47: India Open Angle Glaucoma Therapeutics Industry Revenue (billion) Forecast, by Application 2020 & 2033
- Table 48: India Open Angle Glaucoma Therapeutics Industry Volume (K Unit) Forecast, by Application 2020 & 2033
- Table 49: Australia Open Angle Glaucoma Therapeutics Industry Revenue (billion) Forecast, by Application 2020 & 2033
- Table 50: Australia Open Angle Glaucoma Therapeutics Industry Volume (K Unit) Forecast, by Application 2020 & 2033
- Table 51: South Korea Open Angle Glaucoma Therapeutics Industry Revenue (billion) Forecast, by Application 2020 & 2033
- Table 52: South Korea Open Angle Glaucoma Therapeutics Industry Volume (K Unit) Forecast, by Application 2020 & 2033
- Table 53: Rest of Asia Pacific Open Angle Glaucoma Therapeutics Industry Revenue (billion) Forecast, by Application 2020 & 2033
- Table 54: Rest of Asia Pacific Open Angle Glaucoma Therapeutics Industry Volume (K Unit) Forecast, by Application 2020 & 2033
- Table 55: Global Open Angle Glaucoma Therapeutics Industry Revenue billion Forecast, by Indication 2020 & 2033
- Table 56: Global Open Angle Glaucoma Therapeutics Industry Volume K Unit Forecast, by Indication 2020 & 2033
- Table 57: Global Open Angle Glaucoma Therapeutics Industry Revenue billion Forecast, by Drug Class 2020 & 2033
- Table 58: Global Open Angle Glaucoma Therapeutics Industry Volume K Unit Forecast, by Drug Class 2020 & 2033
- Table 59: Global Open Angle Glaucoma Therapeutics Industry Revenue billion Forecast, by Country 2020 & 2033
- Table 60: Global Open Angle Glaucoma Therapeutics Industry Volume K Unit Forecast, by Country 2020 & 2033
- Table 61: GCC Open Angle Glaucoma Therapeutics Industry Revenue (billion) Forecast, by Application 2020 & 2033
- Table 62: GCC Open Angle Glaucoma Therapeutics Industry Volume (K Unit) Forecast, by Application 2020 & 2033
- Table 63: South Africa Open Angle Glaucoma Therapeutics Industry Revenue (billion) Forecast, by Application 2020 & 2033
- Table 64: South Africa Open Angle Glaucoma Therapeutics Industry Volume (K Unit) Forecast, by Application 2020 & 2033
- Table 65: Rest of Middle East and Africa Open Angle Glaucoma Therapeutics Industry Revenue (billion) Forecast, by Application 2020 & 2033
- Table 66: Rest of Middle East and Africa Open Angle Glaucoma Therapeutics Industry Volume (K Unit) Forecast, by Application 2020 & 2033
- Table 67: Global Open Angle Glaucoma Therapeutics Industry Revenue billion Forecast, by Indication 2020 & 2033
- Table 68: Global Open Angle Glaucoma Therapeutics Industry Volume K Unit Forecast, by Indication 2020 & 2033
- Table 69: Global Open Angle Glaucoma Therapeutics Industry Revenue billion Forecast, by Drug Class 2020 & 2033
- Table 70: Global Open Angle Glaucoma Therapeutics Industry Volume K Unit Forecast, by Drug Class 2020 & 2033
- Table 71: Global Open Angle Glaucoma Therapeutics Industry Revenue billion Forecast, by Country 2020 & 2033
- Table 72: Global Open Angle Glaucoma Therapeutics Industry Volume K Unit Forecast, by Country 2020 & 2033
- Table 73: Brazil Open Angle Glaucoma Therapeutics Industry Revenue (billion) Forecast, by Application 2020 & 2033
- Table 74: Brazil Open Angle Glaucoma Therapeutics Industry Volume (K Unit) Forecast, by Application 2020 & 2033
- Table 75: Argentina Open Angle Glaucoma Therapeutics Industry Revenue (billion) Forecast, by Application 2020 & 2033
- Table 76: Argentina Open Angle Glaucoma Therapeutics Industry Volume (K Unit) Forecast, by Application 2020 & 2033
- Table 77: Rest of South America Open Angle Glaucoma Therapeutics Industry Revenue (billion) Forecast, by Application 2020 & 2033
- Table 78: Rest of South America Open Angle Glaucoma Therapeutics Industry Volume (K Unit) Forecast, by Application 2020 & 2033
Frequently Asked Questions
1. What is the projected Compound Annual Growth Rate (CAGR) of the Open Angle Glaucoma Therapeutics Industry?
The projected CAGR is approximately 10.19%.
2. Which companies are prominent players in the Open Angle Glaucoma Therapeutics Industry?
Key companies in the market include Akorn Incorporated, Novartis AG, Merck & Co Inc, Inotek Pharmaceuticals, Santen Pharmaceutical Co Ltd , Bausch Health (Bausch & Lomb Incorporated), Aerie Pharmaceuticals Inc, Pfizer Inc, Abbvie Inc (Allergan Plc).
3. What are the main segments of the Open Angle Glaucoma Therapeutics Industry?
The market segments include Indication, Drug Class.
4. Can you provide details about the market size?
The market size is estimated to be USD 6.04 billion as of 2022.
5. What are some drivers contributing to market growth?
; Increasing Prevalence of Glaucoma; Rising Initiatives to Increase Awareness about the Glaucoma; Technological Advancements in the Field of Ophthalmology.
6. What are the notable trends driving market growth?
Prostaglandin Analogs is the Segment by Drug Class that is Expected to Witness Fastest Growth Over the Forecast Period.
7. Are there any restraints impacting market growth?
; Side Effects associated with the Products; Stringent Approval Process.
8. Can you provide examples of recent developments in the market?
N/A
9. What pricing options are available for accessing the report?
Pricing options include single-user, multi-user, and enterprise licenses priced at USD 4750, USD 5250, and USD 8750 respectively.
10. Is the market size provided in terms of value or volume?
The market size is provided in terms of value, measured in billion and volume, measured in K Unit.
11. Are there any specific market keywords associated with the report?
Yes, the market keyword associated with the report is "Open Angle Glaucoma Therapeutics Industry," which aids in identifying and referencing the specific market segment covered.
12. How do I determine which pricing option suits my needs best?
The pricing options vary based on user requirements and access needs. Individual users may opt for single-user licenses, while businesses requiring broader access may choose multi-user or enterprise licenses for cost-effective access to the report.
13. Are there any additional resources or data provided in the Open Angle Glaucoma Therapeutics Industry report?
While the report offers comprehensive insights, it's advisable to review the specific contents or supplementary materials provided to ascertain if additional resources or data are available.
14. How can I stay updated on further developments or reports in the Open Angle Glaucoma Therapeutics Industry?
To stay informed about further developments, trends, and reports in the Open Angle Glaucoma Therapeutics Industry, consider subscribing to industry newsletters, following relevant companies and organizations, or regularly checking reputable industry news sources and publications.
Methodology
Step 1 - Identification of Relevant Samples Size from Population Database


Step 2 - Approaches for Defining Global Market Size (Value, Volume* & Price*)

Note*: In applicable scenarios
Step 3 - Data Sources
Primary Research
- Web Analytics
- Survey Reports
- Research Institute
- Latest Research Reports
- Opinion Leaders
Secondary Research
- Annual Reports
- White Paper
- Latest Press Release
- Industry Association
- Paid Database
- Investor Presentations

Step 4 - Data Triangulation
Involves using different sources of information in order to increase the validity of a study
These sources are likely to be stakeholders in a program - participants, other researchers, program staff, other community members, and so on.
Then we put all data in single framework & apply various statistical tools to find out the dynamic on the market.
During the analysis stage, feedback from the stakeholder groups would be compared to determine areas of agreement as well as areas of divergence