

Key Insights
The global market for Non-Alcoholic Concentrated Syrup is poised for substantial growth, with an estimated market size of $10.97 billion in 2025. This impressive expansion is fueled by a robust Compound Annual Growth Rate (CAGR) of 14.17% projected over the forecast period. A key driver for this surge is the increasing consumer preference for convenient and versatile beverage solutions. The rising popularity of at-home beverage preparation, coupled with the demand for customized flavor experiences, is significantly boosting online sales of these syrups. Furthermore, the convenience store and quick-service restaurant sectors are witnessing a heightened adoption of concentrated syrups for efficient and consistent beverage production, contributing to the offline retail segment's growth. Innovations in flavor profiles, including exotic fruit and vegetable-based options, are also catering to evolving consumer tastes and expanding the market's appeal. The health-conscious trend is also playing a role, with a growing interest in syrups made with natural ingredients and lower sugar content, creating new avenues for product development and market penetration.
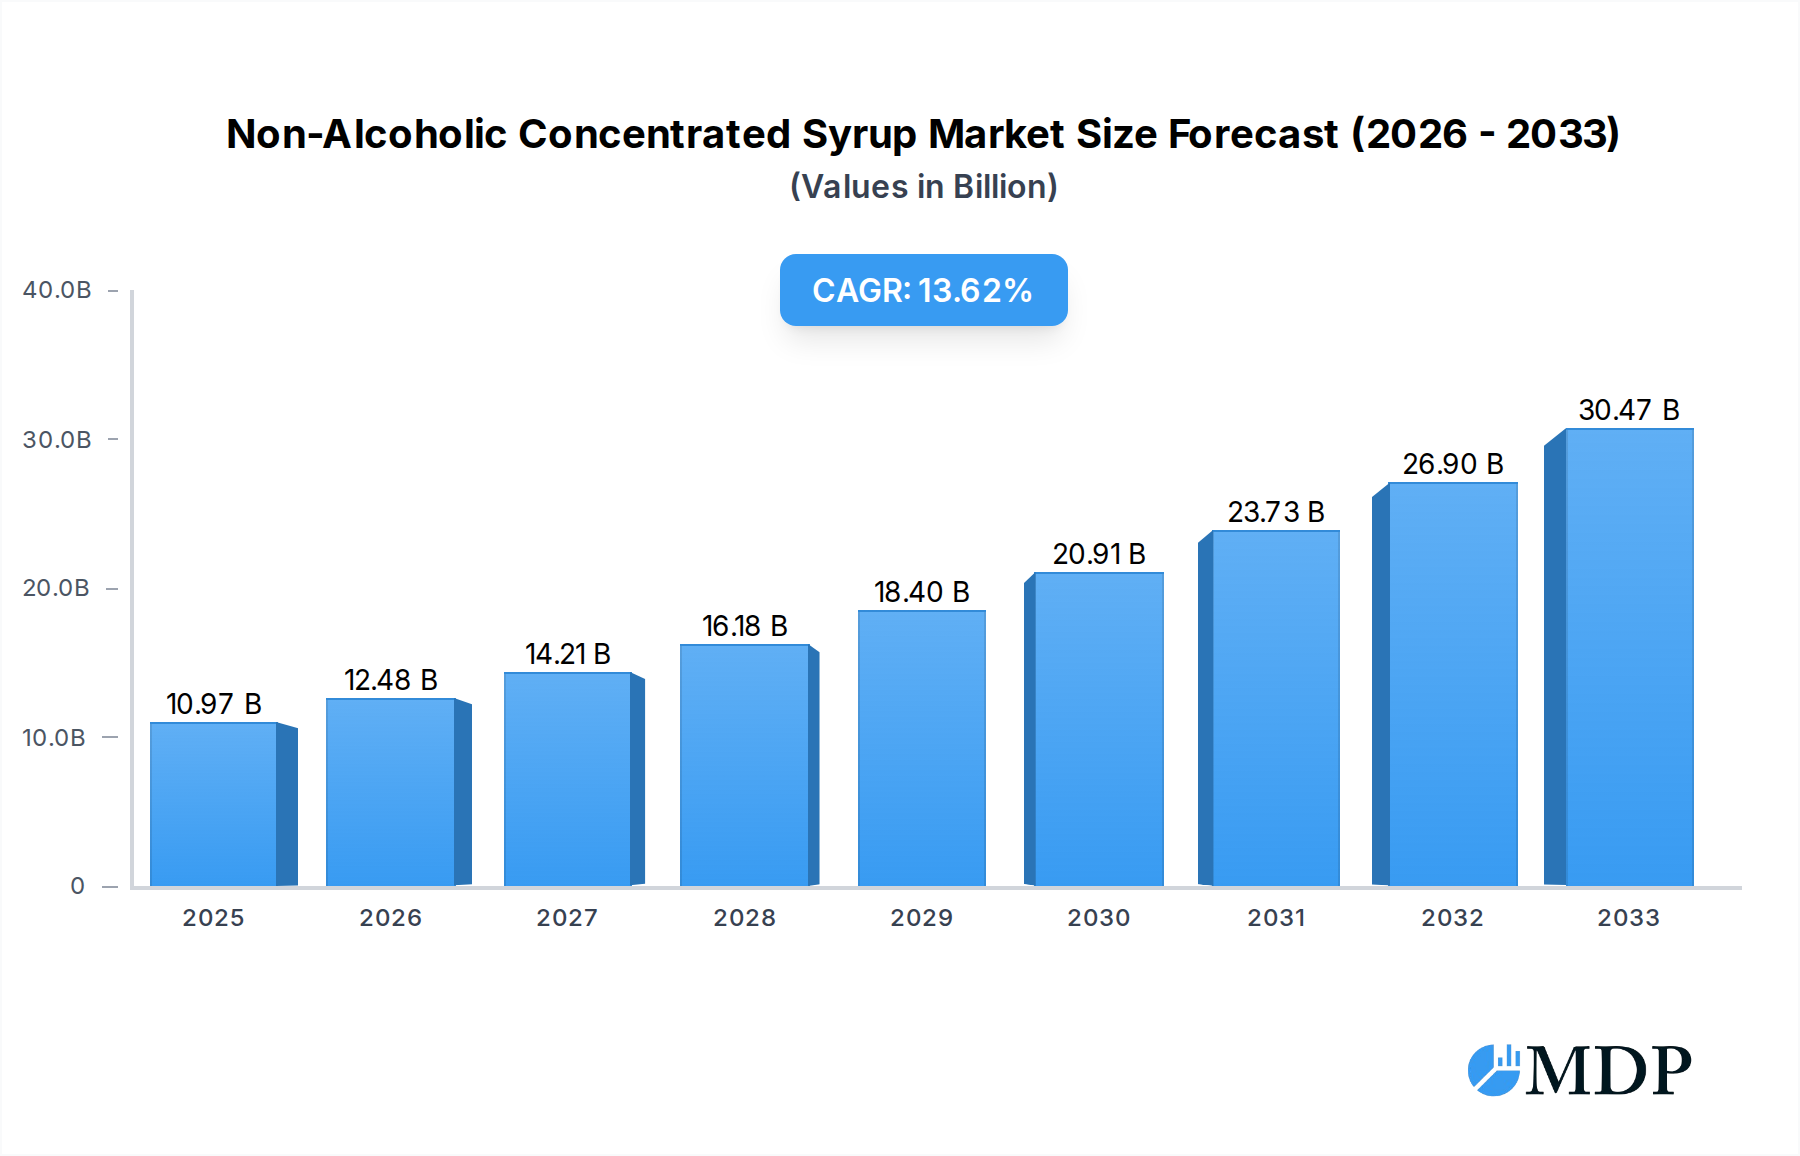
Non-Alcoholic Concentrated Syrup Market Size (In Billion)
The market is segmented across various applications, with Online Sales and Offline Retail representing the primary distribution channels. Within product types, Fruit Syrups and Flavored Syrups are anticipated to lead the market due to their widespread appeal and versatility in beverages and desserts. However, the growing interest in plant-based diets and healthy eating is also expected to drive demand for Vegetable Syrups. Major companies like The Coca-Cola Company, Hindustan Unilever Limited, and Suntory Holdings Limited are actively investing in product innovation and expanding their distribution networks to capture a larger market share. Geographically, the Asia Pacific region, driven by countries like China and India with their burgeoning middle class and increasing disposable incomes, is expected to emerge as a significant growth engine. North America and Europe, already mature markets, will continue to exhibit steady growth driven by product diversification and premiumization trends. Emerging economies in South America and the Middle East & Africa also present lucrative opportunities for market expansion.

Non-Alcoholic Concentrated Syrup Company Market Share
**Global Non-Alcoholic Concentrated Syrup Market Report: Trends, Opportunities, and Forecasts (2019-2033)**
This comprehensive report offers an in-depth analysis of the global Non-Alcoholic Concentrated Syrup market, providing actionable insights for industry stakeholders. Covering a study period from 2019 to 2033, with a base year of 2025, this research delves into market dynamics, emerging trends, leading segments, product innovations, growth drivers, challenges, and strategic opportunities.
Non-Alcoholic Concentrated Syrup Market Dynamics & Concentration
The Non-Alcoholic Concentrated Syrup market exhibits moderate to high concentration, with key players strategically vying for market share. Innovation remains a critical driver, fueled by evolving consumer preferences for healthier, natural, and functional beverage ingredients. Regulatory frameworks, encompassing food safety standards and labeling requirements, play a significant role in shaping market entry and product development. The threat of product substitutes, such as ready-to-drink beverages and alternative sweeteners, necessitates continuous product differentiation and value proposition enhancement. End-user trends lean towards convenience, customization, and ingredient transparency. Mergers and acquisitions (M&A) activity, while not pervasive, contributes to market consolidation and strategic expansion. Market share distribution sees a few dominant players holding over 60 billion in combined value, with an estimated 10-15 M&A deals annually contributing to shifts in market power.
Non-Alcoholic Concentrated Syrup Industry Trends & Analysis
The Non-Alcoholic Concentrated Syrup industry is experiencing robust growth, projected to achieve a Compound Annual Growth Rate (CAGR) of approximately 6.50% from 2025 to 2033. This expansion is underpinned by several key market growth drivers. A rising global population and increasing disposable incomes in emerging economies are directly correlating with higher consumption of flavored beverages, thereby boosting demand for concentrated syrups. Furthermore, the growing health and wellness trend is spurring innovation in the development of syrups with reduced sugar content, natural sweeteners, and added functional benefits like vitamins and probiotics. Technological disruptions, such as advancements in extraction and purification techniques, are enabling the production of higher-quality syrups with enhanced flavor profiles and extended shelf life.
Consumer preferences are shifting towards more natural and premium ingredients, creating opportunities for fruit and vegetable-based syrups. The convenience factor associated with concentrated syrups, allowing for easy preparation of various beverages at home or in foodservice establishments, also contributes significantly to market penetration. The competitive landscape is characterized by both established multinational corporations and agile regional players, each leveraging different strategies to capture market share. Private label brands are also gaining traction, offering cost-effective alternatives to consumers. The overall market penetration is estimated to reach over 70 billion in value by the end of the forecast period, indicating substantial headroom for growth and investment.
Leading Markets & Segments in Non-Alcoholic Concentrated Syrup
North America currently leads the global Non-Alcoholic Concentrated Syrup market, driven by a well-established beverage industry and high consumer spending power, contributing an estimated 30 billion to the global market. Within North America, the United States is the dominant country, accounting for over 70% of the regional market value.
Application Dominance:
- Offline Retail: This segment holds the largest market share, estimated at over 50 billion, owing to extensive distribution networks in supermarkets, convenience stores, and specialty retailers. Factors such as impulse purchases and widespread availability contribute to its leadership.
- Online Sales: Experiencing a rapid growth trajectory, online sales are projected to witness a CAGR exceeding 8% in the forecast period, reaching an estimated 25 billion by 2033. This surge is attributed to the convenience of e-commerce, wider product selection, and direct-to-consumer models.
Type Dominance:
- Fruit Syrup: This is the most dominant type, valued at over 40 billion, driven by widespread consumer preference for fruity flavors in beverages and desserts. The increasing availability of exotic fruit flavors further bolsters its appeal.
- Flavored Syrup: Following closely, flavored syrups, encompassing vanilla, caramel, and chocolate, hold a significant market share of over 35 billion. These are crucial for coffee shops, bakeries, and home baristas seeking to customize drinks.
- Vegetables Syrup: While a niche segment, vegetable syrups are gaining traction due to the health and wellness trend, with an estimated market value of 5 billion and a promising growth outlook.
- Other: This category, including medicinal and culinary syrups, accounts for an estimated 10 billion, catering to specialized applications.
Non-Alcoholic Concentrated Syrup Product Developments
Product development in the Non-Alcoholic Concentrated Syrup market is increasingly focused on health-conscious formulations. Innovations include low-sugar, sugar-free, and natural sweetener options utilizing stevia, monk fruit, or erythritol. There's a growing emphasis on natural fruit and vegetable extracts, offering vibrant colors and authentic flavors without artificial additives. Functional syrups, fortified with vitamins, minerals, and adaptogens, are emerging to cater to specific health needs. Packaging innovation also plays a role, with a move towards sustainable and user-friendly options. Competitive advantages are being carved out through unique flavor combinations, organic certifications, and transparent ingredient sourcing, aligning with growing consumer demand for ethical and healthy products.
Key Drivers of Non-Alcoholic Concentrated Syrup Growth
The growth of the Non-Alcoholic Concentrated Syrup market is primarily driven by several converging factors. Increasing demand for convenient and customizable beverage solutions is a major catalyst, enabling consumers to easily create personalized drinks at home or in foodservice settings. The rising global health consciousness is fostering a shift towards low-sugar, natural, and functional ingredient options, pushing manufacturers to innovate in product formulations. Expanding economies and growing middle-class populations in emerging markets are translating into higher disposable incomes and increased consumption of flavored beverages. Furthermore, advancements in food processing technologies are enabling the creation of more stable, flavorful, and cost-effective concentrated syrups, broadening their appeal and accessibility across diverse applications.
Challenges in the Non-Alcoholic Concentrated Syrup Market
Despite its growth trajectory, the Non-Alcoholic Concentrated Syrup market faces several challenges. Intense competition from ready-to-drink beverages and alternative flavoring agents presents a constant threat, necessitating strong differentiation strategies. Fluctuating raw material prices, particularly for fruits and natural sweeteners, can impact production costs and profit margins, leading to an estimated 5-10% volatility in ingredient expenses annually. Stringent food safety regulations and evolving labeling requirements in different regions can pose compliance hurdles and increase operational complexities. Consumer perception regarding the "artificiality" of some syrups, even those with natural bases, requires ongoing marketing efforts to educate and build trust. The logistical complexities of global supply chains, especially for perishable fruit-based ingredients, can also lead to delays and increased costs, impacting market responsiveness.
Emerging Opportunities in Non-Alcoholic Concentrated Syrup
Emerging opportunities in the Non-Alcoholic Concentrated Syrup market are abundant, driven by evolving consumer trends and technological advancements. The growing interest in plant-based and vegan diets presents a significant opportunity for fruit and vegetable-based syrups with clean ingredient labels. Personalized nutrition is another burgeoning area, with potential for custom-blended syrups catering to specific dietary needs and health goals. Strategic partnerships between syrup manufacturers and beverage brands, or even health and wellness influencers, can unlock new distribution channels and expand market reach. Furthermore, the expansion of e-commerce and direct-to-consumer (DTC) models offers direct access to a wider customer base and enables personalized product offerings, with online sales projected to grow by over 8% annually.
Leading Players in the Non-Alcoholic Concentrated Syrup Sector
- Pioma Industries Pvt
- Britvic Plc
- Himdard Laboratory
- Nichols
- Suntory Holdings Limited
- The Coca-Cola Company
- Cottee’s Pvt. Ltd
- Hindustan Unilever Limited
- Elvin Group
- Monin
Key Milestones in Non-Alcoholic Concentrated Syrup Industry
- 2019: Launch of a range of organic fruit syrups by Monin, responding to growing consumer demand for natural ingredients.
- 2020: The Coca-Cola Company expands its portfolio with a focus on reduced-sugar beverage options, indirectly impacting the demand for syrup bases.
- 2021: Hindustan Unilever Limited introduces innovative, shelf-stable fruit syrup formulations for the foodservice sector.
- 2022: Britvic Plc invests in advanced flavor extraction technologies to enhance the authenticity of its fruit syrup offerings.
- 2023: Pioma Industries Pvt. Ltd. announces strategic partnerships to expand its distribution network in emerging Asian markets.
- 2024 (Q1): Nichols plc showcases a new line of vegetable-based syrups at a major international food and beverage expo, signaling a move towards diversification.
- 2025 (Estimated): Further consolidation through strategic acquisitions is anticipated, with at least 3-5 major deals expected.
Strategic Outlook for Non-Alcoholic Concentrated Syrup Market
The strategic outlook for the Non-Alcoholic Concentrated Syrup market remains highly positive, driven by ongoing innovation and expanding consumer adoption. Growth accelerators will include the continued development of healthier formulations, such as low-sugar and natural ingredient-based syrups, catering to the persistent wellness trend. Expansion into emerging economies, with their rapidly growing middle classes and increasing demand for flavored beverages, presents a significant avenue for market penetration. Leveraging digital platforms and e-commerce channels will be crucial for direct consumer engagement and targeted marketing. Furthermore, diversification into niche applications, such as functional beverages and gourmet culinary uses, will unlock new revenue streams and fortify market positions. Strategic alliances and potential acquisitions will continue to shape the competitive landscape, fostering innovation and expanding market reach.
Non-Alcoholic Concentrated Syrup Segmentation
-
1. Application
- 1.1. Online Sales
- 1.2. Offline Retail
-
2. Types
- 2.1. Fruit Syrup
- 2.2. Vegetables Syrup
- 2.3. Flavored Syrup
- 2.4. Other
Non-Alcoholic Concentrated Syrup Segmentation By Geography
-
1. North America
- 1.1. United States
- 1.2. Canada
- 1.3. Mexico
-
2. South America
- 2.1. Brazil
- 2.2. Argentina
- 2.3. Rest of South America
-
3. Europe
- 3.1. United Kingdom
- 3.2. Germany
- 3.3. France
- 3.4. Italy
- 3.5. Spain
- 3.6. Russia
- 3.7. Benelux
- 3.8. Nordics
- 3.9. Rest of Europe
-
4. Middle East & Africa
- 4.1. Turkey
- 4.2. Israel
- 4.3. GCC
- 4.4. North Africa
- 4.5. South Africa
- 4.6. Rest of Middle East & Africa
-
5. Asia Pacific
- 5.1. China
- 5.2. India
- 5.3. Japan
- 5.4. South Korea
- 5.5. ASEAN
- 5.6. Oceania
- 5.7. Rest of Asia Pacific
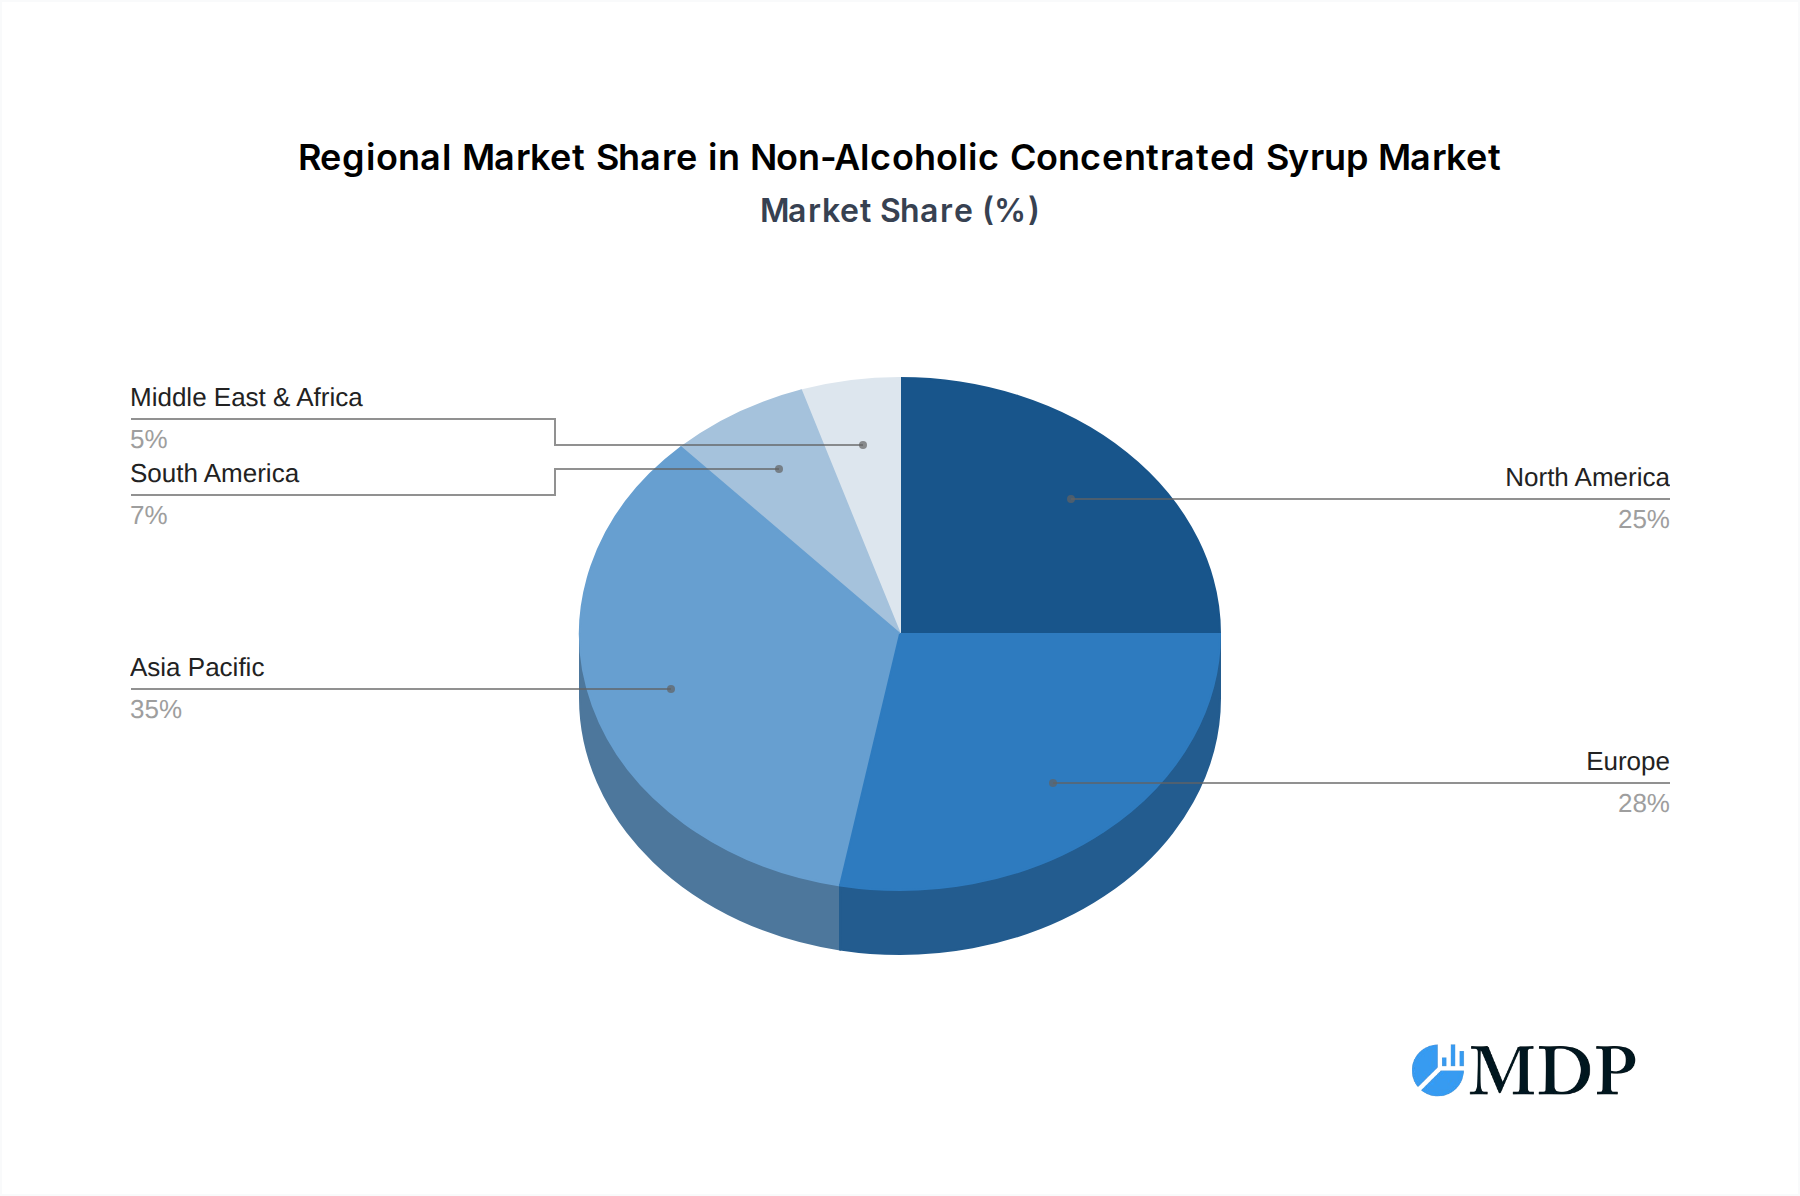
Non-Alcoholic Concentrated Syrup Regional Market Share
Geographic Coverage of Non-Alcoholic Concentrated Syrup
Non-Alcoholic Concentrated Syrup REPORT HIGHLIGHTS
| Aspects | Details |
|---|---|
| Study Period | 2020-2034 |
| Base Year | 2025 |
| Estimated Year | 2026 |
| Forecast Period | 2026-2034 |
| Historical Period | 2020-2025 |
| Growth Rate | CAGR of 14.17% from 2020-2034 |
| Segmentation |
|
Table of Contents
- 1. Introduction
- 1.1. Research Scope
- 1.2. Market Segmentation
- 1.3. Research Methodology
- 1.4. Definitions and Assumptions
- 2. Executive Summary
- 2.1. Introduction
- 3. Market Dynamics
- 3.1. Introduction
- 3.2. Market Drivers
- 3.3. Market Restrains
- 3.4. Market Trends
- 4. Market Factor Analysis
- 4.1. Porters Five Forces
- 4.2. Supply/Value Chain
- 4.3. PESTEL analysis
- 4.4. Market Entropy
- 4.5. Patent/Trademark Analysis
- 5. Global Non-Alcoholic Concentrated Syrup Analysis, Insights and Forecast, 2020-2032
- 5.1. Market Analysis, Insights and Forecast - by Application
- 5.1.1. Online Sales
- 5.1.2. Offline Retail
- 5.2. Market Analysis, Insights and Forecast - by Types
- 5.2.1. Fruit Syrup
- 5.2.2. Vegetables Syrup
- 5.2.3. Flavored Syrup
- 5.2.4. Other
- 5.3. Market Analysis, Insights and Forecast - by Region
- 5.3.1. North America
- 5.3.2. South America
- 5.3.3. Europe
- 5.3.4. Middle East & Africa
- 5.3.5. Asia Pacific
- 5.1. Market Analysis, Insights and Forecast - by Application
- 6. North America Non-Alcoholic Concentrated Syrup Analysis, Insights and Forecast, 2020-2032
- 6.1. Market Analysis, Insights and Forecast - by Application
- 6.1.1. Online Sales
- 6.1.2. Offline Retail
- 6.2. Market Analysis, Insights and Forecast - by Types
- 6.2.1. Fruit Syrup
- 6.2.2. Vegetables Syrup
- 6.2.3. Flavored Syrup
- 6.2.4. Other
- 6.1. Market Analysis, Insights and Forecast - by Application
- 7. South America Non-Alcoholic Concentrated Syrup Analysis, Insights and Forecast, 2020-2032
- 7.1. Market Analysis, Insights and Forecast - by Application
- 7.1.1. Online Sales
- 7.1.2. Offline Retail
- 7.2. Market Analysis, Insights and Forecast - by Types
- 7.2.1. Fruit Syrup
- 7.2.2. Vegetables Syrup
- 7.2.3. Flavored Syrup
- 7.2.4. Other
- 7.1. Market Analysis, Insights and Forecast - by Application
- 8. Europe Non-Alcoholic Concentrated Syrup Analysis, Insights and Forecast, 2020-2032
- 8.1. Market Analysis, Insights and Forecast - by Application
- 8.1.1. Online Sales
- 8.1.2. Offline Retail
- 8.2. Market Analysis, Insights and Forecast - by Types
- 8.2.1. Fruit Syrup
- 8.2.2. Vegetables Syrup
- 8.2.3. Flavored Syrup
- 8.2.4. Other
- 8.1. Market Analysis, Insights and Forecast - by Application
- 9. Middle East & Africa Non-Alcoholic Concentrated Syrup Analysis, Insights and Forecast, 2020-2032
- 9.1. Market Analysis, Insights and Forecast - by Application
- 9.1.1. Online Sales
- 9.1.2. Offline Retail
- 9.2. Market Analysis, Insights and Forecast - by Types
- 9.2.1. Fruit Syrup
- 9.2.2. Vegetables Syrup
- 9.2.3. Flavored Syrup
- 9.2.4. Other
- 9.1. Market Analysis, Insights and Forecast - by Application
- 10. Asia Pacific Non-Alcoholic Concentrated Syrup Analysis, Insights and Forecast, 2020-2032
- 10.1. Market Analysis, Insights and Forecast - by Application
- 10.1.1. Online Sales
- 10.1.2. Offline Retail
- 10.2. Market Analysis, Insights and Forecast - by Types
- 10.2.1. Fruit Syrup
- 10.2.2. Vegetables Syrup
- 10.2.3. Flavored Syrup
- 10.2.4. Other
- 10.1. Market Analysis, Insights and Forecast - by Application
- 11. Competitive Analysis
- 11.1. Global Market Share Analysis 2025
- 11.2. Company Profiles
- 11.2.1 Pioma Industries Pvt
- 11.2.1.1. Overview
- 11.2.1.2. Products
- 11.2.1.3. SWOT Analysis
- 11.2.1.4. Recent Developments
- 11.2.1.5. Financials (Based on Availability)
- 11.2.2 Britvic Plc
- 11.2.2.1. Overview
- 11.2.2.2. Products
- 11.2.2.3. SWOT Analysis
- 11.2.2.4. Recent Developments
- 11.2.2.5. Financials (Based on Availability)
- 11.2.3 Himdard Laboratory
- 11.2.3.1. Overview
- 11.2.3.2. Products
- 11.2.3.3. SWOT Analysis
- 11.2.3.4. Recent Developments
- 11.2.3.5. Financials (Based on Availability)
- 11.2.4 Nichols
- 11.2.4.1. Overview
- 11.2.4.2. Products
- 11.2.4.3. SWOT Analysis
- 11.2.4.4. Recent Developments
- 11.2.4.5. Financials (Based on Availability)
- 11.2.5 Suntory Holdings Limited
- 11.2.5.1. Overview
- 11.2.5.2. Products
- 11.2.5.3. SWOT Analysis
- 11.2.5.4. Recent Developments
- 11.2.5.5. Financials (Based on Availability)
- 11.2.6 The Coca-Cola Company
- 11.2.6.1. Overview
- 11.2.6.2. Products
- 11.2.6.3. SWOT Analysis
- 11.2.6.4. Recent Developments
- 11.2.6.5. Financials (Based on Availability)
- 11.2.7 Cottee’s Pvt. Ltd
- 11.2.7.1. Overview
- 11.2.7.2. Products
- 11.2.7.3. SWOT Analysis
- 11.2.7.4. Recent Developments
- 11.2.7.5. Financials (Based on Availability)
- 11.2.8 Hindustan Unilever Limited
- 11.2.8.1. Overview
- 11.2.8.2. Products
- 11.2.8.3. SWOT Analysis
- 11.2.8.4. Recent Developments
- 11.2.8.5. Financials (Based on Availability)
- 11.2.9 Elvin Group
- 11.2.9.1. Overview
- 11.2.9.2. Products
- 11.2.9.3. SWOT Analysis
- 11.2.9.4. Recent Developments
- 11.2.9.5. Financials (Based on Availability)
- 11.2.10 Monin
- 11.2.10.1. Overview
- 11.2.10.2. Products
- 11.2.10.3. SWOT Analysis
- 11.2.10.4. Recent Developments
- 11.2.10.5. Financials (Based on Availability)
- 11.2.1 Pioma Industries Pvt
List of Figures
- Figure 1: Global Non-Alcoholic Concentrated Syrup Revenue Breakdown (billion, %) by Region 2025 & 2033
- Figure 2: North America Non-Alcoholic Concentrated Syrup Revenue (billion), by Application 2025 & 2033
- Figure 3: North America Non-Alcoholic Concentrated Syrup Revenue Share (%), by Application 2025 & 2033
- Figure 4: North America Non-Alcoholic Concentrated Syrup Revenue (billion), by Types 2025 & 2033
- Figure 5: North America Non-Alcoholic Concentrated Syrup Revenue Share (%), by Types 2025 & 2033
- Figure 6: North America Non-Alcoholic Concentrated Syrup Revenue (billion), by Country 2025 & 2033
- Figure 7: North America Non-Alcoholic Concentrated Syrup Revenue Share (%), by Country 2025 & 2033
- Figure 8: South America Non-Alcoholic Concentrated Syrup Revenue (billion), by Application 2025 & 2033
- Figure 9: South America Non-Alcoholic Concentrated Syrup Revenue Share (%), by Application 2025 & 2033
- Figure 10: South America Non-Alcoholic Concentrated Syrup Revenue (billion), by Types 2025 & 2033
- Figure 11: South America Non-Alcoholic Concentrated Syrup Revenue Share (%), by Types 2025 & 2033
- Figure 12: South America Non-Alcoholic Concentrated Syrup Revenue (billion), by Country 2025 & 2033
- Figure 13: South America Non-Alcoholic Concentrated Syrup Revenue Share (%), by Country 2025 & 2033
- Figure 14: Europe Non-Alcoholic Concentrated Syrup Revenue (billion), by Application 2025 & 2033
- Figure 15: Europe Non-Alcoholic Concentrated Syrup Revenue Share (%), by Application 2025 & 2033
- Figure 16: Europe Non-Alcoholic Concentrated Syrup Revenue (billion), by Types 2025 & 2033
- Figure 17: Europe Non-Alcoholic Concentrated Syrup Revenue Share (%), by Types 2025 & 2033
- Figure 18: Europe Non-Alcoholic Concentrated Syrup Revenue (billion), by Country 2025 & 2033
- Figure 19: Europe Non-Alcoholic Concentrated Syrup Revenue Share (%), by Country 2025 & 2033
- Figure 20: Middle East & Africa Non-Alcoholic Concentrated Syrup Revenue (billion), by Application 2025 & 2033
- Figure 21: Middle East & Africa Non-Alcoholic Concentrated Syrup Revenue Share (%), by Application 2025 & 2033
- Figure 22: Middle East & Africa Non-Alcoholic Concentrated Syrup Revenue (billion), by Types 2025 & 2033
- Figure 23: Middle East & Africa Non-Alcoholic Concentrated Syrup Revenue Share (%), by Types 2025 & 2033
- Figure 24: Middle East & Africa Non-Alcoholic Concentrated Syrup Revenue (billion), by Country 2025 & 2033
- Figure 25: Middle East & Africa Non-Alcoholic Concentrated Syrup Revenue Share (%), by Country 2025 & 2033
- Figure 26: Asia Pacific Non-Alcoholic Concentrated Syrup Revenue (billion), by Application 2025 & 2033
- Figure 27: Asia Pacific Non-Alcoholic Concentrated Syrup Revenue Share (%), by Application 2025 & 2033
- Figure 28: Asia Pacific Non-Alcoholic Concentrated Syrup Revenue (billion), by Types 2025 & 2033
- Figure 29: Asia Pacific Non-Alcoholic Concentrated Syrup Revenue Share (%), by Types 2025 & 2033
- Figure 30: Asia Pacific Non-Alcoholic Concentrated Syrup Revenue (billion), by Country 2025 & 2033
- Figure 31: Asia Pacific Non-Alcoholic Concentrated Syrup Revenue Share (%), by Country 2025 & 2033
List of Tables
- Table 1: Global Non-Alcoholic Concentrated Syrup Revenue billion Forecast, by Application 2020 & 2033
- Table 2: Global Non-Alcoholic Concentrated Syrup Revenue billion Forecast, by Types 2020 & 2033
- Table 3: Global Non-Alcoholic Concentrated Syrup Revenue billion Forecast, by Region 2020 & 2033
- Table 4: Global Non-Alcoholic Concentrated Syrup Revenue billion Forecast, by Application 2020 & 2033
- Table 5: Global Non-Alcoholic Concentrated Syrup Revenue billion Forecast, by Types 2020 & 2033
- Table 6: Global Non-Alcoholic Concentrated Syrup Revenue billion Forecast, by Country 2020 & 2033
- Table 7: United States Non-Alcoholic Concentrated Syrup Revenue (billion) Forecast, by Application 2020 & 2033
- Table 8: Canada Non-Alcoholic Concentrated Syrup Revenue (billion) Forecast, by Application 2020 & 2033
- Table 9: Mexico Non-Alcoholic Concentrated Syrup Revenue (billion) Forecast, by Application 2020 & 2033
- Table 10: Global Non-Alcoholic Concentrated Syrup Revenue billion Forecast, by Application 2020 & 2033
- Table 11: Global Non-Alcoholic Concentrated Syrup Revenue billion Forecast, by Types 2020 & 2033
- Table 12: Global Non-Alcoholic Concentrated Syrup Revenue billion Forecast, by Country 2020 & 2033
- Table 13: Brazil Non-Alcoholic Concentrated Syrup Revenue (billion) Forecast, by Application 2020 & 2033
- Table 14: Argentina Non-Alcoholic Concentrated Syrup Revenue (billion) Forecast, by Application 2020 & 2033
- Table 15: Rest of South America Non-Alcoholic Concentrated Syrup Revenue (billion) Forecast, by Application 2020 & 2033
- Table 16: Global Non-Alcoholic Concentrated Syrup Revenue billion Forecast, by Application 2020 & 2033
- Table 17: Global Non-Alcoholic Concentrated Syrup Revenue billion Forecast, by Types 2020 & 2033
- Table 18: Global Non-Alcoholic Concentrated Syrup Revenue billion Forecast, by Country 2020 & 2033
- Table 19: United Kingdom Non-Alcoholic Concentrated Syrup Revenue (billion) Forecast, by Application 2020 & 2033
- Table 20: Germany Non-Alcoholic Concentrated Syrup Revenue (billion) Forecast, by Application 2020 & 2033
- Table 21: France Non-Alcoholic Concentrated Syrup Revenue (billion) Forecast, by Application 2020 & 2033
- Table 22: Italy Non-Alcoholic Concentrated Syrup Revenue (billion) Forecast, by Application 2020 & 2033
- Table 23: Spain Non-Alcoholic Concentrated Syrup Revenue (billion) Forecast, by Application 2020 & 2033
- Table 24: Russia Non-Alcoholic Concentrated Syrup Revenue (billion) Forecast, by Application 2020 & 2033
- Table 25: Benelux Non-Alcoholic Concentrated Syrup Revenue (billion) Forecast, by Application 2020 & 2033
- Table 26: Nordics Non-Alcoholic Concentrated Syrup Revenue (billion) Forecast, by Application 2020 & 2033
- Table 27: Rest of Europe Non-Alcoholic Concentrated Syrup Revenue (billion) Forecast, by Application 2020 & 2033
- Table 28: Global Non-Alcoholic Concentrated Syrup Revenue billion Forecast, by Application 2020 & 2033
- Table 29: Global Non-Alcoholic Concentrated Syrup Revenue billion Forecast, by Types 2020 & 2033
- Table 30: Global Non-Alcoholic Concentrated Syrup Revenue billion Forecast, by Country 2020 & 2033
- Table 31: Turkey Non-Alcoholic Concentrated Syrup Revenue (billion) Forecast, by Application 2020 & 2033
- Table 32: Israel Non-Alcoholic Concentrated Syrup Revenue (billion) Forecast, by Application 2020 & 2033
- Table 33: GCC Non-Alcoholic Concentrated Syrup Revenue (billion) Forecast, by Application 2020 & 2033
- Table 34: North Africa Non-Alcoholic Concentrated Syrup Revenue (billion) Forecast, by Application 2020 & 2033
- Table 35: South Africa Non-Alcoholic Concentrated Syrup Revenue (billion) Forecast, by Application 2020 & 2033
- Table 36: Rest of Middle East & Africa Non-Alcoholic Concentrated Syrup Revenue (billion) Forecast, by Application 2020 & 2033
- Table 37: Global Non-Alcoholic Concentrated Syrup Revenue billion Forecast, by Application 2020 & 2033
- Table 38: Global Non-Alcoholic Concentrated Syrup Revenue billion Forecast, by Types 2020 & 2033
- Table 39: Global Non-Alcoholic Concentrated Syrup Revenue billion Forecast, by Country 2020 & 2033
- Table 40: China Non-Alcoholic Concentrated Syrup Revenue (billion) Forecast, by Application 2020 & 2033
- Table 41: India Non-Alcoholic Concentrated Syrup Revenue (billion) Forecast, by Application 2020 & 2033
- Table 42: Japan Non-Alcoholic Concentrated Syrup Revenue (billion) Forecast, by Application 2020 & 2033
- Table 43: South Korea Non-Alcoholic Concentrated Syrup Revenue (billion) Forecast, by Application 2020 & 2033
- Table 44: ASEAN Non-Alcoholic Concentrated Syrup Revenue (billion) Forecast, by Application 2020 & 2033
- Table 45: Oceania Non-Alcoholic Concentrated Syrup Revenue (billion) Forecast, by Application 2020 & 2033
- Table 46: Rest of Asia Pacific Non-Alcoholic Concentrated Syrup Revenue (billion) Forecast, by Application 2020 & 2033
Frequently Asked Questions
1. What is the projected Compound Annual Growth Rate (CAGR) of the Non-Alcoholic Concentrated Syrup?
The projected CAGR is approximately 14.17%.
2. Which companies are prominent players in the Non-Alcoholic Concentrated Syrup?
Key companies in the market include Pioma Industries Pvt, Britvic Plc, Himdard Laboratory, Nichols, Suntory Holdings Limited, The Coca-Cola Company, Cottee’s Pvt. Ltd, Hindustan Unilever Limited, Elvin Group, Monin.
3. What are the main segments of the Non-Alcoholic Concentrated Syrup?
The market segments include Application, Types.
4. Can you provide details about the market size?
The market size is estimated to be USD 10.97 billion as of 2022.
5. What are some drivers contributing to market growth?
N/A
6. What are the notable trends driving market growth?
N/A
7. Are there any restraints impacting market growth?
N/A
8. Can you provide examples of recent developments in the market?
N/A
9. What pricing options are available for accessing the report?
Pricing options include single-user, multi-user, and enterprise licenses priced at USD 4900.00, USD 7350.00, and USD 9800.00 respectively.
10. Is the market size provided in terms of value or volume?
The market size is provided in terms of value, measured in billion.
11. Are there any specific market keywords associated with the report?
Yes, the market keyword associated with the report is "Non-Alcoholic Concentrated Syrup," which aids in identifying and referencing the specific market segment covered.
12. How do I determine which pricing option suits my needs best?
The pricing options vary based on user requirements and access needs. Individual users may opt for single-user licenses, while businesses requiring broader access may choose multi-user or enterprise licenses for cost-effective access to the report.
13. Are there any additional resources or data provided in the Non-Alcoholic Concentrated Syrup report?
While the report offers comprehensive insights, it's advisable to review the specific contents or supplementary materials provided to ascertain if additional resources or data are available.
14. How can I stay updated on further developments or reports in the Non-Alcoholic Concentrated Syrup?
To stay informed about further developments, trends, and reports in the Non-Alcoholic Concentrated Syrup, consider subscribing to industry newsletters, following relevant companies and organizations, or regularly checking reputable industry news sources and publications.
Methodology
Step 1 - Identification of Relevant Samples Size from Population Database


Step 2 - Approaches for Defining Global Market Size (Value, Volume* & Price*)

Note*: In applicable scenarios
Step 3 - Data Sources
Primary Research
- Web Analytics
- Survey Reports
- Research Institute
- Latest Research Reports
- Opinion Leaders
Secondary Research
- Annual Reports
- White Paper
- Latest Press Release
- Industry Association
- Paid Database
- Investor Presentations

Step 4 - Data Triangulation
Involves using different sources of information in order to increase the validity of a study
These sources are likely to be stakeholders in a program - participants, other researchers, program staff, other community members, and so on.
Then we put all data in single framework & apply various statistical tools to find out the dynamic on the market.
During the analysis stage, feedback from the stakeholder groups would be compared to determine areas of agreement as well as areas of divergence