

Key Insights
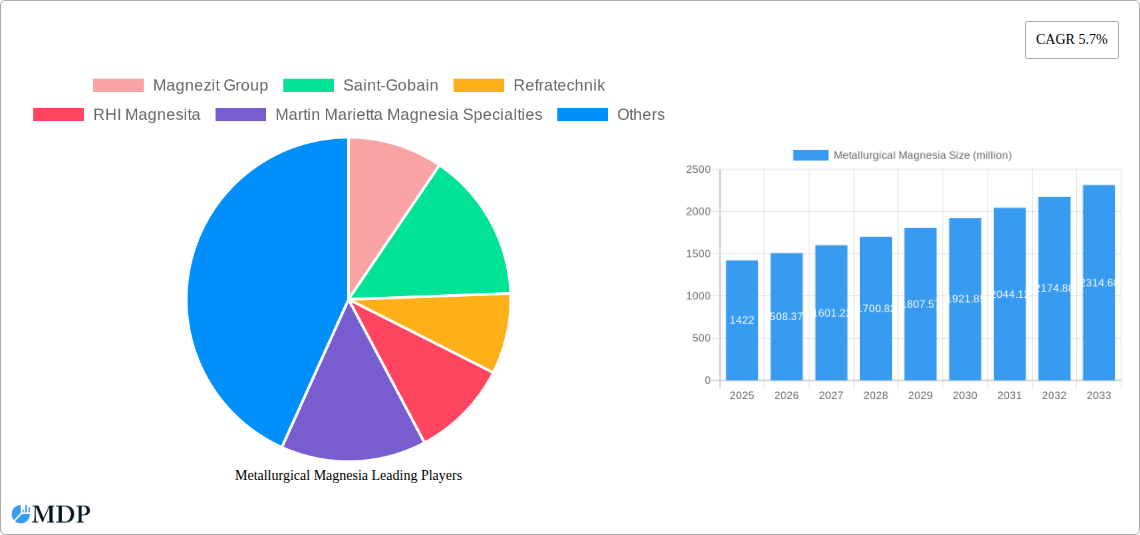
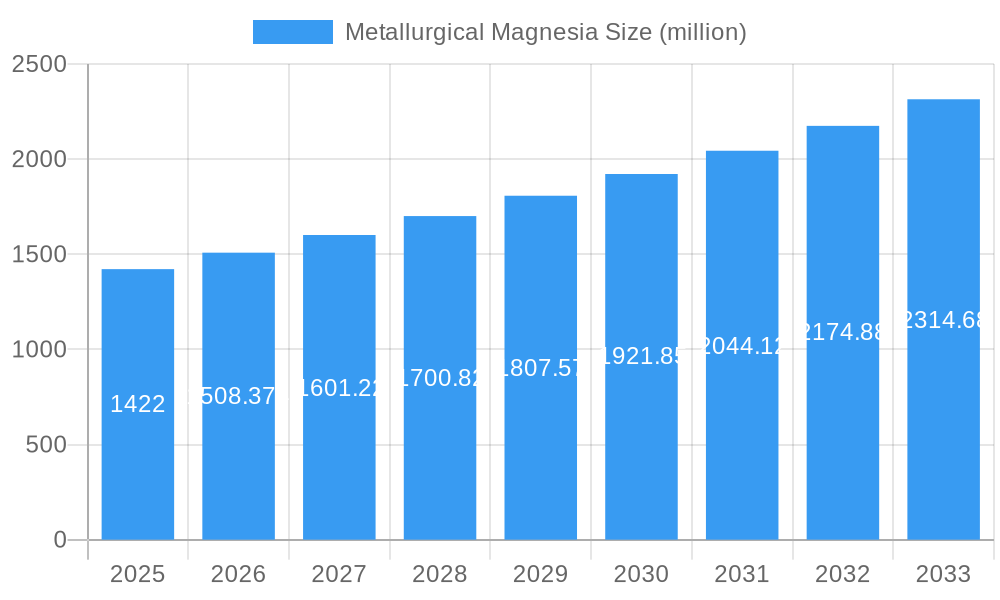
The global metallurgical magnesia market, valued at $1422 million in 2025, is projected to experience robust growth, driven by a compound annual growth rate (CAGR) of 5.7% from 2025 to 2033. This expansion is primarily fueled by the burgeoning steel and iron industries, which rely heavily on metallurgical magnesia as a crucial refractory material in high-temperature applications like converters, electric arc furnaces, and blast furnaces. The increasing demand for higher-efficiency and longer-lasting refractory linings, coupled with advancements in metallurgical processes requiring more sophisticated refractory solutions, are key drivers. Growth is further propelled by the rising global infrastructure development, particularly in emerging economies, stimulating the construction and manufacturing sectors and subsequently increasing the demand for steel production. The market is segmented by application (converters, electric arc furnaces, blast furnaces, and others) and type (ordinary metallurgical magnesia and synthetic metallurgical magnesia, also known as Martin sand). The synthetic segment is anticipated to witness faster growth due to its superior properties like higher purity and improved performance. While challenges exist, such as price volatility of raw materials and environmental regulations concerning magnesia production, the overall market outlook remains positive, driven by the sustained growth of the global steel industry and technological advancements in refractory materials.
Metallurgical Magnesia Market Size (In Billion)
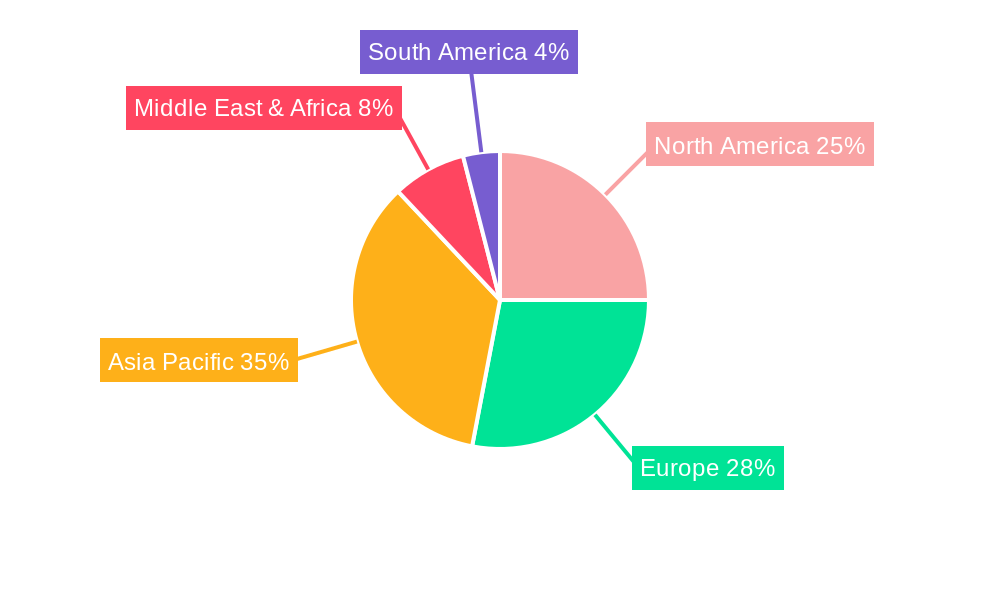
The market's regional distribution shows a significant presence across North America, Europe, and Asia-Pacific. China, India, and other Asian economies are expected to contribute significantly to market growth, driven by rapid industrialization and infrastructure development. Europe and North America will continue to hold substantial market shares due to established industrial bases and advanced technological capabilities. However, the increasing adoption of sustainable practices and the development of eco-friendly alternatives might influence the market in the long term. Key players in the market, such as Magnezit Group, Saint-Gobain, RHI Magnesita, and others, are actively engaged in research and development, focusing on improving the quality and performance of metallurgical magnesia products to meet the evolving needs of the steel industry and maintain their competitive edge. This competitive landscape fosters innovation and ensures a consistent supply of high-quality metallurgical magnesia to global markets.
Metallurgical Magnesia Company Market Share
Metallurgical Magnesia Market Report: 2019-2033
This comprehensive report provides a detailed analysis of the global metallurgical magnesia market, offering invaluable insights for industry stakeholders, investors, and strategic decision-makers. Covering the period from 2019 to 2033, with a focus on 2025, this report analyzes market dynamics, trends, leading players, and future growth potential. The report leverages extensive primary and secondary research to deliver actionable intelligence on market size (valued in millions), market share, CAGR, and key performance indicators.
Metallurgical Magnesia Market Dynamics & Concentration
The global metallurgical magnesia market, valued at $XX million in 2025, exhibits a moderately consolidated structure. Key players such as Magnezit Group, Saint-Gobain, Refratechnik, RHI Magnesita, and Martin Marietta Magnesia Specialties hold significant market share, collectively accounting for approximately xx%. Market concentration is influenced by factors such as economies of scale, technological advancements, and strategic mergers and acquisitions (M&A).
- Market Share: Magnezit Group (xx%), Saint-Gobain (xx%), RHI Magnesita (xx%), Others (xx%).
- M&A Activity: The historical period (2019-2024) witnessed xx major M&A deals, primarily driven by efforts to expand geographic reach and product portfolios. This trend is expected to continue during the forecast period (2025-2033).
- Innovation Drivers: Continuous research and development efforts focusing on enhancing the quality, performance, and efficiency of metallurgical magnesia products are key innovation drivers. This includes advancements in synthetic production methods.
- Regulatory Frameworks: Environmental regulations related to emissions and waste management significantly impact the industry, driving the adoption of more sustainable production practices.
- Product Substitutes: While limited, alternative refractory materials are emerging, posing a potential challenge to market growth.
- End-User Trends: The increasing demand for high-quality steel and other metallurgical products fuels the growth of the metallurgical magnesia market.
Metallurgical Magnesia Industry Trends & Analysis
The metallurgical magnesia market is projected to experience a CAGR of xx% during the forecast period (2025-2033), driven by several factors. The rising global steel production, particularly in developing economies, is a significant growth driver. Technological advancements, such as the development of high-purity synthetic metallurgical magnesia, further enhance market expansion. Consumer preference is shifting towards superior-quality, high-performance refractory materials, creating a demand for innovative products. Competitive dynamics are characterized by intense rivalry among established players and emerging regional producers. Market penetration of synthetic metallurgical magnesia (Martin Sand) is expected to increase from xx% in 2025 to xx% by 2033.
Leading Markets & Segments in Metallurgical Magnesia
The Asia-Pacific region dominates the global metallurgical magnesia market, driven by robust steel production and infrastructure development in countries like China, India, and South Korea.
Application Segments:
- Blast Furnace: This segment holds the largest market share, driven by the extensive use of metallurgical magnesia in blast furnace linings. Key drivers include the expansion of iron and steel production capacity, and increasing demand for durable refractory materials.
- Converters: The converters segment is experiencing steady growth, fueled by the increasing adoption of efficient and high-performance refractory materials in steelmaking processes.
- Electric Arc: This segment is witnessing moderate growth, mainly driven by the rising demand for electric arc furnace (EAF) steelmaking globally.
- Others: This segment includes smaller applications in various metallurgical processes.
Type Segments:
- Ordinary Metallurgical Magnesia: This remains the largest segment due to its cost-effectiveness and wide applicability.
- Synthetic Metallurgical Magnesia (Martin Sand): This segment is experiencing significant growth due to its superior properties and performance characteristics.
Metallurgical Magnesia Product Developments
Recent product innovations have focused on improving the purity, density, and thermal shock resistance of metallurgical magnesia. The development of high-purity synthetic magnesia (Martin Sand) offers enhanced performance characteristics, leading to extended refractory lifespan and reduced maintenance costs. These advancements align with market demand for sustainable and high-performance solutions in the metallurgical industry.
Key Drivers of Metallurgical Magnesia Growth
The growth of the metallurgical magnesia market is driven by:
- Rising Steel Production: The global increase in steel production fuels demand for refractory materials.
- Infrastructure Development: Expanding infrastructure projects, particularly in developing economies, create demand for steel and consequently for metallurgical magnesia.
- Technological Advancements: Innovations in synthetic magnesia production methods lead to improved product quality and performance.
Challenges in the Metallurgical Magnesia Market
The market faces challenges including:
- Fluctuating Raw Material Prices: Price volatility in raw materials impacts production costs and profitability.
- Stringent Environmental Regulations: Compliance with environmental regulations requires investments in pollution control technologies.
- Intense Competition: The market is competitive, with several established and emerging players.
Emerging Opportunities in Metallurgical Magnesia
Emerging opportunities include:
- Expanding into New Applications: Exploring new applications of metallurgical magnesia in specialized metallurgical processes.
- Strategic Partnerships: Collaborations with steel producers and other industry players to develop innovative solutions.
- Market Expansion in Developing Economies: Targeting high-growth markets in developing regions.
Leading Players in the Metallurgical Magnesia Sector
- Magnezit Group
- Saint-Gobain
- Refratechnik
- RHI Magnesita
- Martin Marietta Magnesia Specialties
- Grecian Magnesite
- Yingkou Xintian Special Minerals
- Liaoning Zhongmei Holding
- Changzhou Sunai Metallurgy and Fireproofing Materials
- Jiangsu Chianaref Refrectory
- Yixing Angrefractory Plant Factory
Key Milestones in Metallurgical Magnesia Industry
- 2020: RHI Magnesita launched a new range of high-performance metallurgical magnesia products.
- 2022: Magnezit Group acquired a major refractory producer in Southeast Asia.
- 2023: Significant investments in R&D by several key players to improve the sustainability and efficiency of production processes. (Further milestones would be included based on data available)
Strategic Outlook for Metallurgical Magnesia Market
The metallurgical magnesia market is poised for significant growth driven by the sustained expansion of the steel industry and ongoing technological innovations. Strategic opportunities exist in developing high-value, specialized products tailored to specific metallurgical applications and expanding into emerging markets with strong growth potential. Companies focused on sustainability and operational efficiency are expected to thrive in the competitive landscape.
Metallurgical Magnesia Segmentation
-
1. Application
- 1.1. Converters
- 1.2. Electric Arch
- 1.3. Blast Furnace
- 1.4. Others
-
2. Type
- 2.1. Ordinary Metallurgical Magnesia
- 2.2. Synthetic Metallurgical Magnesia(Martin Sand)
Metallurgical Magnesia Segmentation By Geography
-
1. North America
- 1.1. United States
- 1.2. Canada
- 1.3. Mexico
-
2. South America
- 2.1. Brazil
- 2.2. Argentina
- 2.3. Rest of South America
-
3. Europe
- 3.1. United Kingdom
- 3.2. Germany
- 3.3. France
- 3.4. Italy
- 3.5. Spain
- 3.6. Russia
- 3.7. Benelux
- 3.8. Nordics
- 3.9. Rest of Europe
-
4. Middle East & Africa
- 4.1. Turkey
- 4.2. Israel
- 4.3. GCC
- 4.4. North Africa
- 4.5. South Africa
- 4.6. Rest of Middle East & Africa
-
5. Asia Pacific
- 5.1. China
- 5.2. India
- 5.3. Japan
- 5.4. South Korea
- 5.5. ASEAN
- 5.6. Oceania
- 5.7. Rest of Asia Pacific
Metallurgical Magnesia Regional Market Share
Geographic Coverage of Metallurgical Magnesia
Metallurgical Magnesia REPORT HIGHLIGHTS
| Aspects | Details |
|---|---|
| Study Period | 2020-2034 |
| Base Year | 2025 |
| Estimated Year | 2026 |
| Forecast Period | 2026-2034 |
| Historical Period | 2020-2025 |
| Growth Rate | CAGR of 5.7% from 2020-2034 |
| Segmentation |
|
Table of Contents
- 1. Introduction
- 1.1. Research Scope
- 1.2. Market Segmentation
- 1.3. Research Methodology
- 1.4. Definitions and Assumptions
- 2. Executive Summary
- 2.1. Introduction
- 3. Market Dynamics
- 3.1. Introduction
- 3.2. Market Drivers
- 3.3. Market Restrains
- 3.4. Market Trends
- 4. Market Factor Analysis
- 4.1. Porters Five Forces
- 4.2. Supply/Value Chain
- 4.3. PESTEL analysis
- 4.4. Market Entropy
- 4.5. Patent/Trademark Analysis
- 5. Global Metallurgical Magnesia Analysis, Insights and Forecast, 2020-2032
- 5.1. Market Analysis, Insights and Forecast - by Application
- 5.1.1. Converters
- 5.1.2. Electric Arch
- 5.1.3. Blast Furnace
- 5.1.4. Others
- 5.2. Market Analysis, Insights and Forecast - by Type
- 5.2.1. Ordinary Metallurgical Magnesia
- 5.2.2. Synthetic Metallurgical Magnesia(Martin Sand)
- 5.3. Market Analysis, Insights and Forecast - by Region
- 5.3.1. North America
- 5.3.2. South America
- 5.3.3. Europe
- 5.3.4. Middle East & Africa
- 5.3.5. Asia Pacific
- 5.1. Market Analysis, Insights and Forecast - by Application
- 6. North America Metallurgical Magnesia Analysis, Insights and Forecast, 2020-2032
- 6.1. Market Analysis, Insights and Forecast - by Application
- 6.1.1. Converters
- 6.1.2. Electric Arch
- 6.1.3. Blast Furnace
- 6.1.4. Others
- 6.2. Market Analysis, Insights and Forecast - by Type
- 6.2.1. Ordinary Metallurgical Magnesia
- 6.2.2. Synthetic Metallurgical Magnesia(Martin Sand)
- 6.1. Market Analysis, Insights and Forecast - by Application
- 7. South America Metallurgical Magnesia Analysis, Insights and Forecast, 2020-2032
- 7.1. Market Analysis, Insights and Forecast - by Application
- 7.1.1. Converters
- 7.1.2. Electric Arch
- 7.1.3. Blast Furnace
- 7.1.4. Others
- 7.2. Market Analysis, Insights and Forecast - by Type
- 7.2.1. Ordinary Metallurgical Magnesia
- 7.2.2. Synthetic Metallurgical Magnesia(Martin Sand)
- 7.1. Market Analysis, Insights and Forecast - by Application
- 8. Europe Metallurgical Magnesia Analysis, Insights and Forecast, 2020-2032
- 8.1. Market Analysis, Insights and Forecast - by Application
- 8.1.1. Converters
- 8.1.2. Electric Arch
- 8.1.3. Blast Furnace
- 8.1.4. Others
- 8.2. Market Analysis, Insights and Forecast - by Type
- 8.2.1. Ordinary Metallurgical Magnesia
- 8.2.2. Synthetic Metallurgical Magnesia(Martin Sand)
- 8.1. Market Analysis, Insights and Forecast - by Application
- 9. Middle East & Africa Metallurgical Magnesia Analysis, Insights and Forecast, 2020-2032
- 9.1. Market Analysis, Insights and Forecast - by Application
- 9.1.1. Converters
- 9.1.2. Electric Arch
- 9.1.3. Blast Furnace
- 9.1.4. Others
- 9.2. Market Analysis, Insights and Forecast - by Type
- 9.2.1. Ordinary Metallurgical Magnesia
- 9.2.2. Synthetic Metallurgical Magnesia(Martin Sand)
- 9.1. Market Analysis, Insights and Forecast - by Application
- 10. Asia Pacific Metallurgical Magnesia Analysis, Insights and Forecast, 2020-2032
- 10.1. Market Analysis, Insights and Forecast - by Application
- 10.1.1. Converters
- 10.1.2. Electric Arch
- 10.1.3. Blast Furnace
- 10.1.4. Others
- 10.2. Market Analysis, Insights and Forecast - by Type
- 10.2.1. Ordinary Metallurgical Magnesia
- 10.2.2. Synthetic Metallurgical Magnesia(Martin Sand)
- 10.1. Market Analysis, Insights and Forecast - by Application
- 11. Competitive Analysis
- 11.1. Global Market Share Analysis 2025
- 11.2. Company Profiles
- 11.2.1 Magnezit Group
- 11.2.1.1. Overview
- 11.2.1.2. Products
- 11.2.1.3. SWOT Analysis
- 11.2.1.4. Recent Developments
- 11.2.1.5. Financials (Based on Availability)
- 11.2.2 Saint-Gobain
- 11.2.2.1. Overview
- 11.2.2.2. Products
- 11.2.2.3. SWOT Analysis
- 11.2.2.4. Recent Developments
- 11.2.2.5. Financials (Based on Availability)
- 11.2.3 Refratechnik
- 11.2.3.1. Overview
- 11.2.3.2. Products
- 11.2.3.3. SWOT Analysis
- 11.2.3.4. Recent Developments
- 11.2.3.5. Financials (Based on Availability)
- 11.2.4 RHI Magnesita
- 11.2.4.1. Overview
- 11.2.4.2. Products
- 11.2.4.3. SWOT Analysis
- 11.2.4.4. Recent Developments
- 11.2.4.5. Financials (Based on Availability)
- 11.2.5 Martin Marietta Magnesia Specialties
- 11.2.5.1. Overview
- 11.2.5.2. Products
- 11.2.5.3. SWOT Analysis
- 11.2.5.4. Recent Developments
- 11.2.5.5. Financials (Based on Availability)
- 11.2.6 Grecian Magnesite
- 11.2.6.1. Overview
- 11.2.6.2. Products
- 11.2.6.3. SWOT Analysis
- 11.2.6.4. Recent Developments
- 11.2.6.5. Financials (Based on Availability)
- 11.2.7 Yingkou Xintian Special Minerals
- 11.2.7.1. Overview
- 11.2.7.2. Products
- 11.2.7.3. SWOT Analysis
- 11.2.7.4. Recent Developments
- 11.2.7.5. Financials (Based on Availability)
- 11.2.8 Liaoning Zhongmei Holding
- 11.2.8.1. Overview
- 11.2.8.2. Products
- 11.2.8.3. SWOT Analysis
- 11.2.8.4. Recent Developments
- 11.2.8.5. Financials (Based on Availability)
- 11.2.9 Changzhou Sunai Metallurgy and Fireproofing Materials
- 11.2.9.1. Overview
- 11.2.9.2. Products
- 11.2.9.3. SWOT Analysis
- 11.2.9.4. Recent Developments
- 11.2.9.5. Financials (Based on Availability)
- 11.2.10 Jiangsu Chianaref Refrectory
- 11.2.10.1. Overview
- 11.2.10.2. Products
- 11.2.10.3. SWOT Analysis
- 11.2.10.4. Recent Developments
- 11.2.10.5. Financials (Based on Availability)
- 11.2.11 Yixing Angrefractory Plant Factory
- 11.2.11.1. Overview
- 11.2.11.2. Products
- 11.2.11.3. SWOT Analysis
- 11.2.11.4. Recent Developments
- 11.2.11.5. Financials (Based on Availability)
- 11.2.1 Magnezit Group
List of Figures
- Figure 1: Global Metallurgical Magnesia Revenue Breakdown (million, %) by Region 2025 & 2033
- Figure 2: North America Metallurgical Magnesia Revenue (million), by Application 2025 & 2033
- Figure 3: North America Metallurgical Magnesia Revenue Share (%), by Application 2025 & 2033
- Figure 4: North America Metallurgical Magnesia Revenue (million), by Type 2025 & 2033
- Figure 5: North America Metallurgical Magnesia Revenue Share (%), by Type 2025 & 2033
- Figure 6: North America Metallurgical Magnesia Revenue (million), by Country 2025 & 2033
- Figure 7: North America Metallurgical Magnesia Revenue Share (%), by Country 2025 & 2033
- Figure 8: South America Metallurgical Magnesia Revenue (million), by Application 2025 & 2033
- Figure 9: South America Metallurgical Magnesia Revenue Share (%), by Application 2025 & 2033
- Figure 10: South America Metallurgical Magnesia Revenue (million), by Type 2025 & 2033
- Figure 11: South America Metallurgical Magnesia Revenue Share (%), by Type 2025 & 2033
- Figure 12: South America Metallurgical Magnesia Revenue (million), by Country 2025 & 2033
- Figure 13: South America Metallurgical Magnesia Revenue Share (%), by Country 2025 & 2033
- Figure 14: Europe Metallurgical Magnesia Revenue (million), by Application 2025 & 2033
- Figure 15: Europe Metallurgical Magnesia Revenue Share (%), by Application 2025 & 2033
- Figure 16: Europe Metallurgical Magnesia Revenue (million), by Type 2025 & 2033
- Figure 17: Europe Metallurgical Magnesia Revenue Share (%), by Type 2025 & 2033
- Figure 18: Europe Metallurgical Magnesia Revenue (million), by Country 2025 & 2033
- Figure 19: Europe Metallurgical Magnesia Revenue Share (%), by Country 2025 & 2033
- Figure 20: Middle East & Africa Metallurgical Magnesia Revenue (million), by Application 2025 & 2033
- Figure 21: Middle East & Africa Metallurgical Magnesia Revenue Share (%), by Application 2025 & 2033
- Figure 22: Middle East & Africa Metallurgical Magnesia Revenue (million), by Type 2025 & 2033
- Figure 23: Middle East & Africa Metallurgical Magnesia Revenue Share (%), by Type 2025 & 2033
- Figure 24: Middle East & Africa Metallurgical Magnesia Revenue (million), by Country 2025 & 2033
- Figure 25: Middle East & Africa Metallurgical Magnesia Revenue Share (%), by Country 2025 & 2033
- Figure 26: Asia Pacific Metallurgical Magnesia Revenue (million), by Application 2025 & 2033
- Figure 27: Asia Pacific Metallurgical Magnesia Revenue Share (%), by Application 2025 & 2033
- Figure 28: Asia Pacific Metallurgical Magnesia Revenue (million), by Type 2025 & 2033
- Figure 29: Asia Pacific Metallurgical Magnesia Revenue Share (%), by Type 2025 & 2033
- Figure 30: Asia Pacific Metallurgical Magnesia Revenue (million), by Country 2025 & 2033
- Figure 31: Asia Pacific Metallurgical Magnesia Revenue Share (%), by Country 2025 & 2033
List of Tables
- Table 1: Global Metallurgical Magnesia Revenue million Forecast, by Application 2020 & 2033
- Table 2: Global Metallurgical Magnesia Revenue million Forecast, by Type 2020 & 2033
- Table 3: Global Metallurgical Magnesia Revenue million Forecast, by Region 2020 & 2033
- Table 4: Global Metallurgical Magnesia Revenue million Forecast, by Application 2020 & 2033
- Table 5: Global Metallurgical Magnesia Revenue million Forecast, by Type 2020 & 2033
- Table 6: Global Metallurgical Magnesia Revenue million Forecast, by Country 2020 & 2033
- Table 7: United States Metallurgical Magnesia Revenue (million) Forecast, by Application 2020 & 2033
- Table 8: Canada Metallurgical Magnesia Revenue (million) Forecast, by Application 2020 & 2033
- Table 9: Mexico Metallurgical Magnesia Revenue (million) Forecast, by Application 2020 & 2033
- Table 10: Global Metallurgical Magnesia Revenue million Forecast, by Application 2020 & 2033
- Table 11: Global Metallurgical Magnesia Revenue million Forecast, by Type 2020 & 2033
- Table 12: Global Metallurgical Magnesia Revenue million Forecast, by Country 2020 & 2033
- Table 13: Brazil Metallurgical Magnesia Revenue (million) Forecast, by Application 2020 & 2033
- Table 14: Argentina Metallurgical Magnesia Revenue (million) Forecast, by Application 2020 & 2033
- Table 15: Rest of South America Metallurgical Magnesia Revenue (million) Forecast, by Application 2020 & 2033
- Table 16: Global Metallurgical Magnesia Revenue million Forecast, by Application 2020 & 2033
- Table 17: Global Metallurgical Magnesia Revenue million Forecast, by Type 2020 & 2033
- Table 18: Global Metallurgical Magnesia Revenue million Forecast, by Country 2020 & 2033
- Table 19: United Kingdom Metallurgical Magnesia Revenue (million) Forecast, by Application 2020 & 2033
- Table 20: Germany Metallurgical Magnesia Revenue (million) Forecast, by Application 2020 & 2033
- Table 21: France Metallurgical Magnesia Revenue (million) Forecast, by Application 2020 & 2033
- Table 22: Italy Metallurgical Magnesia Revenue (million) Forecast, by Application 2020 & 2033
- Table 23: Spain Metallurgical Magnesia Revenue (million) Forecast, by Application 2020 & 2033
- Table 24: Russia Metallurgical Magnesia Revenue (million) Forecast, by Application 2020 & 2033
- Table 25: Benelux Metallurgical Magnesia Revenue (million) Forecast, by Application 2020 & 2033
- Table 26: Nordics Metallurgical Magnesia Revenue (million) Forecast, by Application 2020 & 2033
- Table 27: Rest of Europe Metallurgical Magnesia Revenue (million) Forecast, by Application 2020 & 2033
- Table 28: Global Metallurgical Magnesia Revenue million Forecast, by Application 2020 & 2033
- Table 29: Global Metallurgical Magnesia Revenue million Forecast, by Type 2020 & 2033
- Table 30: Global Metallurgical Magnesia Revenue million Forecast, by Country 2020 & 2033
- Table 31: Turkey Metallurgical Magnesia Revenue (million) Forecast, by Application 2020 & 2033
- Table 32: Israel Metallurgical Magnesia Revenue (million) Forecast, by Application 2020 & 2033
- Table 33: GCC Metallurgical Magnesia Revenue (million) Forecast, by Application 2020 & 2033
- Table 34: North Africa Metallurgical Magnesia Revenue (million) Forecast, by Application 2020 & 2033
- Table 35: South Africa Metallurgical Magnesia Revenue (million) Forecast, by Application 2020 & 2033
- Table 36: Rest of Middle East & Africa Metallurgical Magnesia Revenue (million) Forecast, by Application 2020 & 2033
- Table 37: Global Metallurgical Magnesia Revenue million Forecast, by Application 2020 & 2033
- Table 38: Global Metallurgical Magnesia Revenue million Forecast, by Type 2020 & 2033
- Table 39: Global Metallurgical Magnesia Revenue million Forecast, by Country 2020 & 2033
- Table 40: China Metallurgical Magnesia Revenue (million) Forecast, by Application 2020 & 2033
- Table 41: India Metallurgical Magnesia Revenue (million) Forecast, by Application 2020 & 2033
- Table 42: Japan Metallurgical Magnesia Revenue (million) Forecast, by Application 2020 & 2033
- Table 43: South Korea Metallurgical Magnesia Revenue (million) Forecast, by Application 2020 & 2033
- Table 44: ASEAN Metallurgical Magnesia Revenue (million) Forecast, by Application 2020 & 2033
- Table 45: Oceania Metallurgical Magnesia Revenue (million) Forecast, by Application 2020 & 2033
- Table 46: Rest of Asia Pacific Metallurgical Magnesia Revenue (million) Forecast, by Application 2020 & 2033
Frequently Asked Questions
1. What is the projected Compound Annual Growth Rate (CAGR) of the Metallurgical Magnesia?
The projected CAGR is approximately 5.7%.
2. Which companies are prominent players in the Metallurgical Magnesia?
Key companies in the market include Magnezit Group, Saint-Gobain, Refratechnik, RHI Magnesita, Martin Marietta Magnesia Specialties, Grecian Magnesite, Yingkou Xintian Special Minerals, Liaoning Zhongmei Holding, Changzhou Sunai Metallurgy and Fireproofing Materials, Jiangsu Chianaref Refrectory, Yixing Angrefractory Plant Factory.
3. What are the main segments of the Metallurgical Magnesia?
The market segments include Application, Type.
4. Can you provide details about the market size?
The market size is estimated to be USD 1422 million as of 2022.
5. What are some drivers contributing to market growth?
N/A
6. What are the notable trends driving market growth?
N/A
7. Are there any restraints impacting market growth?
N/A
8. Can you provide examples of recent developments in the market?
N/A
9. What pricing options are available for accessing the report?
Pricing options include single-user, multi-user, and enterprise licenses priced at USD 4250.00, USD 6375.00, and USD 8500.00 respectively.
10. Is the market size provided in terms of value or volume?
The market size is provided in terms of value, measured in million.
11. Are there any specific market keywords associated with the report?
Yes, the market keyword associated with the report is "Metallurgical Magnesia," which aids in identifying and referencing the specific market segment covered.
12. How do I determine which pricing option suits my needs best?
The pricing options vary based on user requirements and access needs. Individual users may opt for single-user licenses, while businesses requiring broader access may choose multi-user or enterprise licenses for cost-effective access to the report.
13. Are there any additional resources or data provided in the Metallurgical Magnesia report?
While the report offers comprehensive insights, it's advisable to review the specific contents or supplementary materials provided to ascertain if additional resources or data are available.
14. How can I stay updated on further developments or reports in the Metallurgical Magnesia?
To stay informed about further developments, trends, and reports in the Metallurgical Magnesia, consider subscribing to industry newsletters, following relevant companies and organizations, or regularly checking reputable industry news sources and publications.
Methodology
Step 1 - Identification of Relevant Samples Size from Population Database


Step 2 - Approaches for Defining Global Market Size (Value, Volume* & Price*)

Note*: In applicable scenarios
Step 3 - Data Sources
Primary Research
- Web Analytics
- Survey Reports
- Research Institute
- Latest Research Reports
- Opinion Leaders
Secondary Research
- Annual Reports
- White Paper
- Latest Press Release
- Industry Association
- Paid Database
- Investor Presentations

Step 4 - Data Triangulation
Involves using different sources of information in order to increase the validity of a study
These sources are likely to be stakeholders in a program - participants, other researchers, program staff, other community members, and so on.
Then we put all data in single framework & apply various statistical tools to find out the dynamic on the market.
During the analysis stage, feedback from the stakeholder groups would be compared to determine areas of agreement as well as areas of divergence