

Key Insights
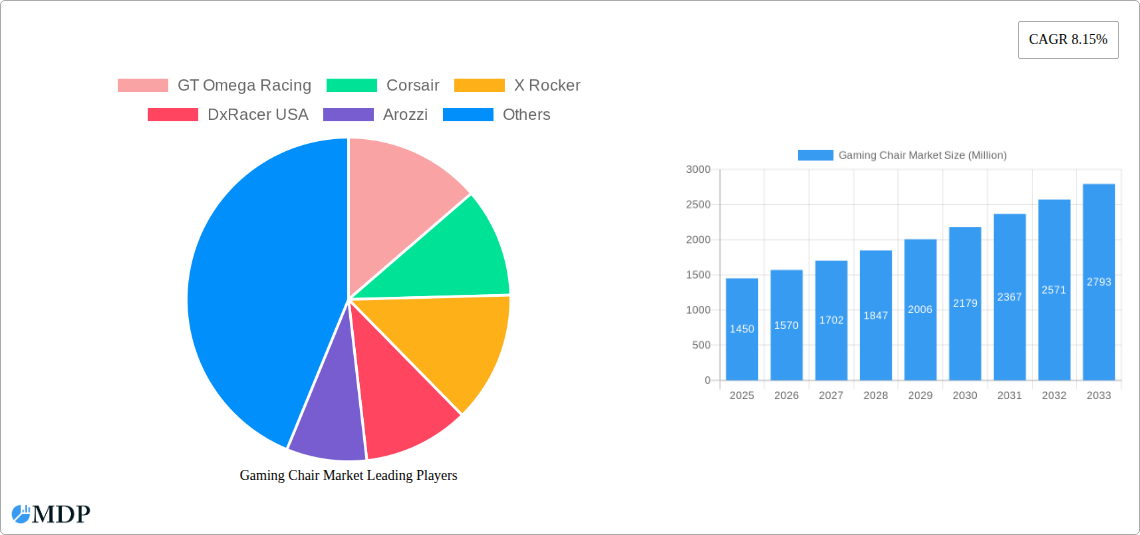
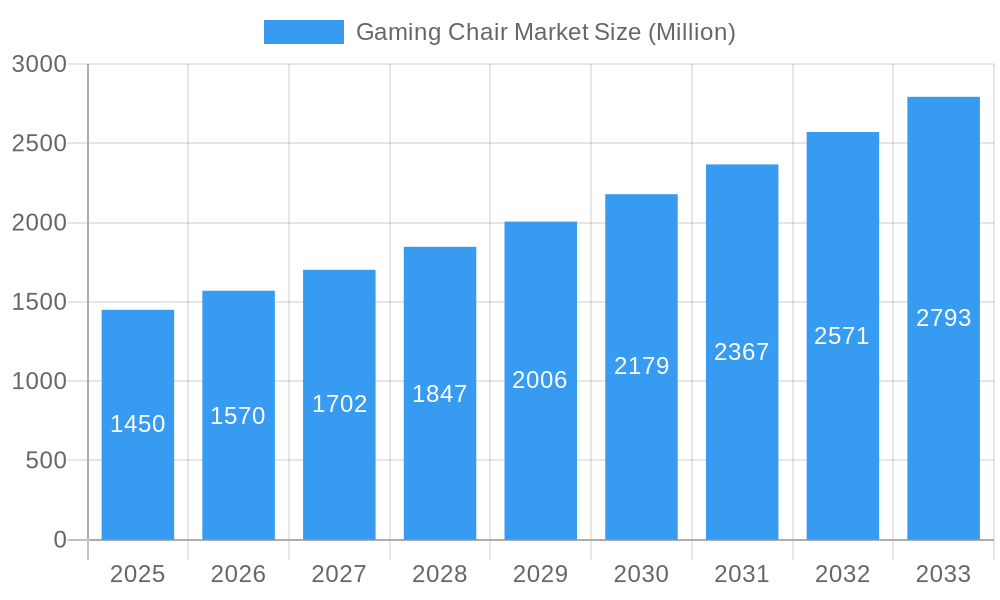
The global gaming chair market, valued at $1.45 billion in 2025, is projected to experience robust growth, driven by several key factors. The rising popularity of esports and competitive gaming, coupled with increased time spent gaming at home, fuels demand for ergonomic and comfortable seating solutions. Technological advancements, such as enhanced lumbar support, adjustable features, and integrated audio systems, are further enhancing the appeal of gaming chairs. The market is segmented by end-user (residential and commercial), distribution channel (home centers, specialty stores, online, and others), and chair type (PC gaming, hybrid, platform, and others). The online distribution channel is experiencing significant growth, driven by e-commerce platforms and improved online shopping experiences. North America currently holds a substantial market share, driven by a large gaming community and high disposable incomes. However, Asia-Pacific is expected to witness considerable growth in the coming years, fueled by increasing internet penetration and rising gaming adoption across countries like China and India. Competitive pricing strategies and innovative product launches by key players, such as GT Omega Racing, Corsair, and Secretlab, are shaping market dynamics. While the market faces restraints such as high prices for premium models and fluctuating raw material costs, the overall growth trajectory remains positive, with a Compound Annual Growth Rate (CAGR) of 8.15% projected from 2025 to 2033.
Gaming Chair Market Market Size (In Billion)
The continued expansion of the gaming industry, along with the increasing preference for ergonomic furniture among gamers and professionals, will propel market growth. Furthermore, the growing adoption of hybrid work models is expected to drive demand for comfortable and functional chairs suitable for both work and gaming. The market's segmentation provides opportunities for niche players to focus on specific end-user segments and distribution channels, further fueling innovation and competition. The development of sustainable and environmentally friendly materials will also be a key factor influencing market trends. Geographic expansion into emerging markets will also be crucial for overall market growth, with a particular focus on regions with high growth potential in gaming adoption. Analyzing market trends and consumer preferences will be crucial for manufacturers to adapt their product offerings and remain competitive in this evolving landscape.
Gaming Chair Market Company Market Share
Gaming Chair Market: A Comprehensive Report (2019-2033)
This in-depth report provides a comprehensive analysis of the global gaming chair market, offering invaluable insights for industry stakeholders, investors, and businesses seeking to navigate this dynamic landscape. With a study period spanning 2019-2033, a base year of 2025, and a forecast period of 2025-2033, this report delivers actionable intelligence based on rigorous data analysis and expert insights. The report value is estimated at xx Million.
Gaming Chair Market Market Dynamics & Concentration
The gaming chair market is experiencing significant growth fueled by the booming esports industry, increasing gaming hours, and rising consumer disposable income. Market concentration is moderate, with several key players holding substantial market share, but also allowing for smaller niche players to thrive. Innovation is driven by the demand for enhanced ergonomics, advanced features (like integrated speakers and RGB lighting), and sustainable materials. Regulatory frameworks vary by region, primarily focusing on safety and product standards. Product substitutes, such as regular office chairs, are readily available but lack the specialized ergonomic design and features desired by gamers. End-user trends lean towards greater comfort, personalization, and aesthetic appeal. Mergers and acquisitions (M&A) activity has been moderate in recent years, with around xx M&A deals recorded between 2019 and 2024, reflecting strategic consolidation efforts within the industry. Key players have focused on expanding product lines and market reach through organic growth and strategic partnerships.
- Market Share: Top 5 players hold approximately xx% of the market share in 2025.
- M&A Activity: An estimated xx M&A deals occurred between 2019 and 2024.
- Innovation Focus: Ergonomic design, advanced features (integrated tech, customizable settings), sustainable materials.
Gaming Chair Market Industry Trends & Analysis
The global gaming chair market exhibits robust growth, with a projected CAGR of xx% during the forecast period (2025-2033). This growth is driven by several factors: the escalating popularity of esports and competitive gaming, increased consumer spending on gaming peripherals and accessories, and a growing awareness of the importance of ergonomic seating for prolonged gaming sessions. Technological advancements, such as the incorporation of advanced comfort features and smart functionalities, are shaping market dynamics. Consumer preferences are shifting towards customization options, premium materials, and aesthetically pleasing designs. The competitive landscape is intensely dynamic, with established brands and emerging players vying for market share through product innovation, strategic partnerships, and aggressive marketing campaigns. Market penetration remains relatively high in developed economies, while growth opportunities are primarily concentrated in emerging markets.
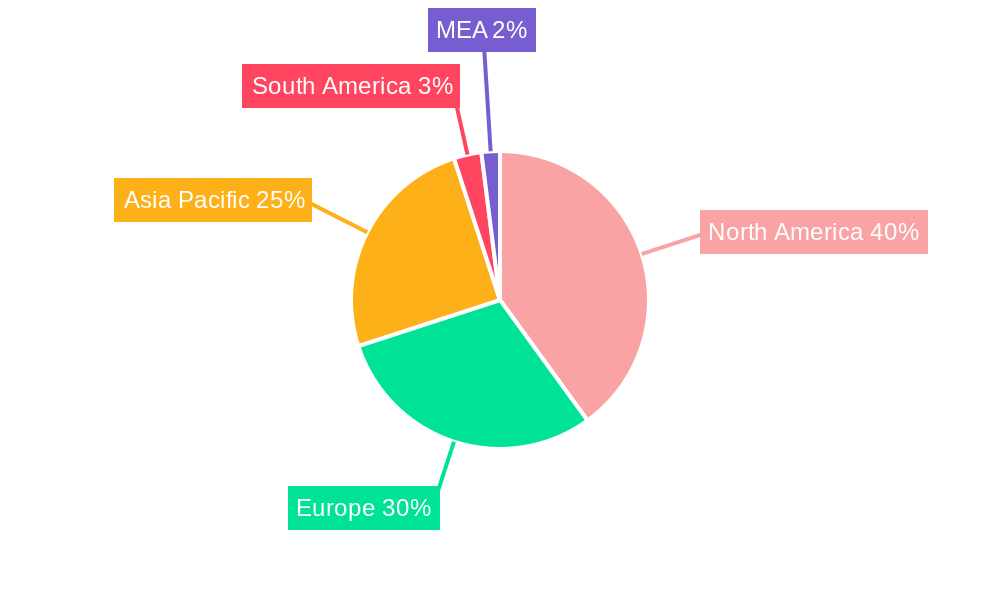
Leading Markets & Segments in Gaming Chair Market
The North American region currently dominates the gaming chair market, accounting for approximately xx% of global sales in 2025. This dominance can be attributed to several factors:
- High Gaming Penetration: A large and established gaming community fuels high demand.
- Strong Disposable Income: Higher consumer spending power enables premium product purchases.
- Well-Developed E-commerce Infrastructure: Online sales channels facilitate convenient access for consumers.
By End-User: The residential segment accounts for the largest share, driven by the rising number of gamers at home.
- Residential: xx% of market share in 2025
- Commercial: (Esports arenas, gaming cafes) xx% of market share in 2025
By Distribution Channel: Online sales continue to grow rapidly, exceeding traditional retail channels in 2025.
- Online: xx% of market share in 2025
- Specialty Stores: xx% of market share in 2025
- Home Centers: xx% of market share in 2025
By Type: PC Gaming chairs represent the most significant segment, due to the widespread use of personal computers for gaming.
- PC Gaming Chairs: xx% of market share in 2025
- Hybrid Gaming Chairs: xx% of market share in 2025
- Platform Gaming Chairs: xx% of market share in 2025
Gaming Chair Market Product Developments
Recent product innovations focus on improved ergonomics, enhanced comfort features (adjustable lumbar support, headrests, armrests), and the integration of smart technology (RGB lighting, Bluetooth speakers). Manufacturers are also emphasizing the use of high-quality, durable materials and sustainable practices. These developments cater to the evolving needs and preferences of gamers, enhancing both their gaming experience and overall well-being. The competitive advantage lies in offering unique features, superior ergonomics, and a strong brand reputation for quality and reliability.
Key Drivers of Gaming Chair Market Growth
The gaming chair market's growth is driven by a confluence of factors: the surging popularity of esports and competitive gaming, increasing gaming hours among individuals, rising consumer disposable incomes, and the growing awareness of the importance of ergonomic seating for long gaming sessions. Furthermore, technological advancements resulting in enhanced comfort and functionality within gaming chairs further contribute to this expanding market.
Challenges in the Gaming Chair Market Market
The gaming chair market faces several challenges, including intense competition from established and new players, supply chain disruptions affecting raw material costs and delivery times, and potential regulatory hurdles regarding safety and environmental standards. These factors could impact market growth and profitability. Increased raw material costs have led to approximately xx% increase in production costs between 2021 and 2024.
Emerging Opportunities in Gaming Chair Market
Significant opportunities exist for growth through technological advancements (e.g., incorporating haptic feedback, virtual reality integration), strategic partnerships with gaming companies and esports organizations, and expansion into emerging markets. Personalized customization options and sustainable manufacturing practices will also drive demand in the coming years.
Leading Players in the Gaming Chair Market Sector
- GT Omega Racing
- Corsair
- X Rocker
- DxRacer USA
- Arozzi
- AkRacing
- Noblechairs
- Vertagear
- Ace Casual Furniture
- Secretlab
Key Milestones in Gaming Chair Market Industry
- June 2022: CORSAIR launched the CORSAIR TC200 Fabric and Leatherette Gaming Chairs, expanding their gaming furniture lineup.
- August 2022: Cybeart announced the world's first Lord of the Rings Chair, leveraging a partnership with Warner Bros.
Strategic Outlook for Gaming Chair Market Market
The gaming chair market exhibits strong growth potential driven by continuous innovation, increasing consumer demand for enhanced comfort and features, and expansion into new geographic markets. Strategic partnerships, focus on sustainability, and personalized product offerings will be crucial for future success within the industry. The market is expected to reach xx Million by 2033.
Gaming Chair Market Segmentation
-
1. Type
- 1.1. PC Gaming Chair
- 1.2. Hybrid Gaming Chair
- 1.3. Platform Gaming Chair
-
2. End User
- 2.1. Residential
- 2.2. Commercial
-
3. Distribution Channel
- 3.1. Home Centers
- 3.2. Specialty Stores
- 3.3. Online
Gaming Chair Market Segmentation By Geography
-
1. North America
- 1.1. United States
- 1.2. Canada
- 1.3. Rest of North America
-
2. Europe
- 2.1. United Kingdom
- 2.2. Germany
- 2.3. Rest of Europe
-
3. Asia Pacific
- 3.1. India
- 3.2. Japan
- 3.3. Rest of Asia Pacific
-
4. South America
- 4.1. Brazil
- 4.2. Peru
- 4.3. Rest of South America
-
5. Middle East and Africa
- 5.1. Saudi Arabia
- 5.2. United Arab Emirates
- 5.3. Rest of Middle East and Africa
Gaming Chair Market Regional Market Share
Geographic Coverage of Gaming Chair Market
Gaming Chair Market REPORT HIGHLIGHTS
| Aspects | Details |
|---|---|
| Study Period | 2020-2034 |
| Base Year | 2025 |
| Estimated Year | 2026 |
| Forecast Period | 2026-2034 |
| Historical Period | 2020-2025 |
| Growth Rate | CAGR of 8.15% from 2020-2034 |
| Segmentation |
|
Table of Contents
- 1. Introduction
- 1.1. Research Scope
- 1.2. Market Segmentation
- 1.3. Research Objective
- 1.4. Definitions and Assumptions
- 2. Executive Summary
- 2.1. Market Snapshot
- 3. Market Dynamics
- 3.1. Market Drivers
- 3.2. Market Restrains
- 3.3. Market Trends
- 3.4. Market Opportunities
- 4. Market Factor Analysis
- 4.1. Porters Five Forces
- 4.1.1. Bargaining Power of Suppliers
- 4.1.2. Bargaining Power of Buyers
- 4.1.3. Threat of New Entrants
- 4.1.4. Threat of Substitutes
- 4.1.5. Competitive Rivalry
- 4.2. PESTEL analysis
- 4.3. BCG Analysis
- 4.3.1. Stars (High Growth, High Market Share)
- 4.3.2. Cash Cows (Low Growth, High Market Share)
- 4.3.3. Question Mark (High Growth, Low Market Share)
- 4.3.4. Dogs (Low Growth, Low Market Share)
- 4.4. Ansoff Matrix Analysis
- 4.5. Supply Chain Analysis
- 4.6. Regulatory Landscape
- 4.7. Current Market Potential and Opportunity Assessment (TAM–SAM–SOM Framework)
- 4.8. MDP Analyst Note
- 4.1. Porters Five Forces
- 5. Market Analysis, Insights and Forecast 2021-2033
- 5.1. Market Analysis, Insights and Forecast - by Type
- 5.1.1. PC Gaming Chair
- 5.1.2. Hybrid Gaming Chair
- 5.1.3. Platform Gaming Chair
- 5.2. Market Analysis, Insights and Forecast - by End User
- 5.2.1. Residential
- 5.2.2. Commercial
- 5.3. Market Analysis, Insights and Forecast - by Distribution Channel
- 5.3.1. Home Centers
- 5.3.2. Specialty Stores
- 5.3.3. Online
- 5.4. Market Analysis, Insights and Forecast - by Region
- 5.4.1. North America
- 5.4.2. Europe
- 5.4.3. Asia Pacific
- 5.4.4. South America
- 5.4.5. Middle East and Africa
- 5.1. Market Analysis, Insights and Forecast - by Type
- 6. Global Gaming Chair Market Analysis, Insights and Forecast, 2021-2033
- 6.1. Market Analysis, Insights and Forecast - by Type
- 6.1.1. PC Gaming Chair
- 6.1.2. Hybrid Gaming Chair
- 6.1.3. Platform Gaming Chair
- 6.2. Market Analysis, Insights and Forecast - by End User
- 6.2.1. Residential
- 6.2.2. Commercial
- 6.3. Market Analysis, Insights and Forecast - by Distribution Channel
- 6.3.1. Home Centers
- 6.3.2. Specialty Stores
- 6.3.3. Online
- 6.1. Market Analysis, Insights and Forecast - by Type
- 7. North America Gaming Chair Market Analysis, Insights and Forecast, 2020-2032
- 7.1. Market Analysis, Insights and Forecast - by Type
- 7.1.1. PC Gaming Chair
- 7.1.2. Hybrid Gaming Chair
- 7.1.3. Platform Gaming Chair
- 7.2. Market Analysis, Insights and Forecast - by End User
- 7.2.1. Residential
- 7.2.2. Commercial
- 7.3. Market Analysis, Insights and Forecast - by Distribution Channel
- 7.3.1. Home Centers
- 7.3.2. Specialty Stores
- 7.3.3. Online
- 7.1. Market Analysis, Insights and Forecast - by Type
- 8. Europe Gaming Chair Market Analysis, Insights and Forecast, 2020-2032
- 8.1. Market Analysis, Insights and Forecast - by Type
- 8.1.1. PC Gaming Chair
- 8.1.2. Hybrid Gaming Chair
- 8.1.3. Platform Gaming Chair
- 8.2. Market Analysis, Insights and Forecast - by End User
- 8.2.1. Residential
- 8.2.2. Commercial
- 8.3. Market Analysis, Insights and Forecast - by Distribution Channel
- 8.3.1. Home Centers
- 8.3.2. Specialty Stores
- 8.3.3. Online
- 8.1. Market Analysis, Insights and Forecast - by Type
- 9. Asia Pacific Gaming Chair Market Analysis, Insights and Forecast, 2020-2032
- 9.1. Market Analysis, Insights and Forecast - by Type
- 9.1.1. PC Gaming Chair
- 9.1.2. Hybrid Gaming Chair
- 9.1.3. Platform Gaming Chair
- 9.2. Market Analysis, Insights and Forecast - by End User
- 9.2.1. Residential
- 9.2.2. Commercial
- 9.3. Market Analysis, Insights and Forecast - by Distribution Channel
- 9.3.1. Home Centers
- 9.3.2. Specialty Stores
- 9.3.3. Online
- 9.1. Market Analysis, Insights and Forecast - by Type
- 10. South America Gaming Chair Market Analysis, Insights and Forecast, 2020-2032
- 10.1. Market Analysis, Insights and Forecast - by Type
- 10.1.1. PC Gaming Chair
- 10.1.2. Hybrid Gaming Chair
- 10.1.3. Platform Gaming Chair
- 10.2. Market Analysis, Insights and Forecast - by End User
- 10.2.1. Residential
- 10.2.2. Commercial
- 10.3. Market Analysis, Insights and Forecast - by Distribution Channel
- 10.3.1. Home Centers
- 10.3.2. Specialty Stores
- 10.3.3. Online
- 10.1. Market Analysis, Insights and Forecast - by Type
- 11. Middle East and Africa Gaming Chair Market Analysis, Insights and Forecast, 2020-2032
- 11.1. Market Analysis, Insights and Forecast - by Type
- 11.1.1. PC Gaming Chair
- 11.1.2. Hybrid Gaming Chair
- 11.1.3. Platform Gaming Chair
- 11.2. Market Analysis, Insights and Forecast - by End User
- 11.2.1. Residential
- 11.2.2. Commercial
- 11.3. Market Analysis, Insights and Forecast - by Distribution Channel
- 11.3.1. Home Centers
- 11.3.2. Specialty Stores
- 11.3.3. Online
- 11.1. Market Analysis, Insights and Forecast - by Type
- 12. Competitive Analysis
- 12.1. Company Profiles
- 12.1.1 GT Omega Racing
- 12.1.1.1. Company Overview
- 12.1.1.2. Products
- 12.1.1.3. Company Financials
- 12.1.1.4. SWOT Analysis
- 12.1.2 Corsair
- 12.1.2.1. Company Overview
- 12.1.2.2. Products
- 12.1.2.3. Company Financials
- 12.1.2.4. SWOT Analysis
- 12.1.3 X Rocker
- 12.1.3.1. Company Overview
- 12.1.3.2. Products
- 12.1.3.3. Company Financials
- 12.1.3.4. SWOT Analysis
- 12.1.4 DxRacer USA
- 12.1.4.1. Company Overview
- 12.1.4.2. Products
- 12.1.4.3. Company Financials
- 12.1.4.4. SWOT Analysis
- 12.1.5 Arozzi
- 12.1.5.1. Company Overview
- 12.1.5.2. Products
- 12.1.5.3. Company Financials
- 12.1.5.4. SWOT Analysis
- 12.1.6 AkRacing
- 12.1.6.1. Company Overview
- 12.1.6.2. Products
- 12.1.6.3. Company Financials
- 12.1.6.4. SWOT Analysis
- 12.1.7 Noblechairs
- 12.1.7.1. Company Overview
- 12.1.7.2. Products
- 12.1.7.3. Company Financials
- 12.1.7.4. SWOT Analysis
- 12.1.8 Vertagear
- 12.1.8.1. Company Overview
- 12.1.8.2. Products
- 12.1.8.3. Company Financials
- 12.1.8.4. SWOT Analysis
- 12.1.9 Ace Casual Furniture
- 12.1.9.1. Company Overview
- 12.1.9.2. Products
- 12.1.9.3. Company Financials
- 12.1.9.4. SWOT Analysis
- 12.1.10 Secretlab
- 12.1.10.1. Company Overview
- 12.1.10.2. Products
- 12.1.10.3. Company Financials
- 12.1.10.4. SWOT Analysis
- 12.1.1 GT Omega Racing
- 12.2. Market Entropy
- 12.2.1 Company's Key Areas Served
- 12.2.2 Recent Developments
- 12.3. Company Market Share Analysis 2025
- 12.3.1 Top 5 Companies Market Share Analysis
- 12.3.2 Top 3 Companies Market Share Analysis
- 12.4. List of Potential Customers
- 13. Research Methodology
List of Figures
- Figure 1: Global Gaming Chair Market Revenue Breakdown (Million, %) by Region 2025 & 2033
- Figure 2: Global Gaming Chair Market Volume Breakdown (K Units, %) by Region 2025 & 2033
- Figure 3: North America Gaming Chair Market Revenue (Million), by Type 2025 & 2033
- Figure 4: North America Gaming Chair Market Volume (K Units), by Type 2025 & 2033
- Figure 5: North America Gaming Chair Market Revenue Share (%), by Type 2025 & 2033
- Figure 6: North America Gaming Chair Market Volume Share (%), by Type 2025 & 2033
- Figure 7: North America Gaming Chair Market Revenue (Million), by End User 2025 & 2033
- Figure 8: North America Gaming Chair Market Volume (K Units), by End User 2025 & 2033
- Figure 9: North America Gaming Chair Market Revenue Share (%), by End User 2025 & 2033
- Figure 10: North America Gaming Chair Market Volume Share (%), by End User 2025 & 2033
- Figure 11: North America Gaming Chair Market Revenue (Million), by Distribution Channel 2025 & 2033
- Figure 12: North America Gaming Chair Market Volume (K Units), by Distribution Channel 2025 & 2033
- Figure 13: North America Gaming Chair Market Revenue Share (%), by Distribution Channel 2025 & 2033
- Figure 14: North America Gaming Chair Market Volume Share (%), by Distribution Channel 2025 & 2033
- Figure 15: North America Gaming Chair Market Revenue (Million), by Country 2025 & 2033
- Figure 16: North America Gaming Chair Market Volume (K Units), by Country 2025 & 2033
- Figure 17: North America Gaming Chair Market Revenue Share (%), by Country 2025 & 2033
- Figure 18: North America Gaming Chair Market Volume Share (%), by Country 2025 & 2033
- Figure 19: Europe Gaming Chair Market Revenue (Million), by Type 2025 & 2033
- Figure 20: Europe Gaming Chair Market Volume (K Units), by Type 2025 & 2033
- Figure 21: Europe Gaming Chair Market Revenue Share (%), by Type 2025 & 2033
- Figure 22: Europe Gaming Chair Market Volume Share (%), by Type 2025 & 2033
- Figure 23: Europe Gaming Chair Market Revenue (Million), by End User 2025 & 2033
- Figure 24: Europe Gaming Chair Market Volume (K Units), by End User 2025 & 2033
- Figure 25: Europe Gaming Chair Market Revenue Share (%), by End User 2025 & 2033
- Figure 26: Europe Gaming Chair Market Volume Share (%), by End User 2025 & 2033
- Figure 27: Europe Gaming Chair Market Revenue (Million), by Distribution Channel 2025 & 2033
- Figure 28: Europe Gaming Chair Market Volume (K Units), by Distribution Channel 2025 & 2033
- Figure 29: Europe Gaming Chair Market Revenue Share (%), by Distribution Channel 2025 & 2033
- Figure 30: Europe Gaming Chair Market Volume Share (%), by Distribution Channel 2025 & 2033
- Figure 31: Europe Gaming Chair Market Revenue (Million), by Country 2025 & 2033
- Figure 32: Europe Gaming Chair Market Volume (K Units), by Country 2025 & 2033
- Figure 33: Europe Gaming Chair Market Revenue Share (%), by Country 2025 & 2033
- Figure 34: Europe Gaming Chair Market Volume Share (%), by Country 2025 & 2033
- Figure 35: Asia Pacific Gaming Chair Market Revenue (Million), by Type 2025 & 2033
- Figure 36: Asia Pacific Gaming Chair Market Volume (K Units), by Type 2025 & 2033
- Figure 37: Asia Pacific Gaming Chair Market Revenue Share (%), by Type 2025 & 2033
- Figure 38: Asia Pacific Gaming Chair Market Volume Share (%), by Type 2025 & 2033
- Figure 39: Asia Pacific Gaming Chair Market Revenue (Million), by End User 2025 & 2033
- Figure 40: Asia Pacific Gaming Chair Market Volume (K Units), by End User 2025 & 2033
- Figure 41: Asia Pacific Gaming Chair Market Revenue Share (%), by End User 2025 & 2033
- Figure 42: Asia Pacific Gaming Chair Market Volume Share (%), by End User 2025 & 2033
- Figure 43: Asia Pacific Gaming Chair Market Revenue (Million), by Distribution Channel 2025 & 2033
- Figure 44: Asia Pacific Gaming Chair Market Volume (K Units), by Distribution Channel 2025 & 2033
- Figure 45: Asia Pacific Gaming Chair Market Revenue Share (%), by Distribution Channel 2025 & 2033
- Figure 46: Asia Pacific Gaming Chair Market Volume Share (%), by Distribution Channel 2025 & 2033
- Figure 47: Asia Pacific Gaming Chair Market Revenue (Million), by Country 2025 & 2033
- Figure 48: Asia Pacific Gaming Chair Market Volume (K Units), by Country 2025 & 2033
- Figure 49: Asia Pacific Gaming Chair Market Revenue Share (%), by Country 2025 & 2033
- Figure 50: Asia Pacific Gaming Chair Market Volume Share (%), by Country 2025 & 2033
- Figure 51: South America Gaming Chair Market Revenue (Million), by Type 2025 & 2033
- Figure 52: South America Gaming Chair Market Volume (K Units), by Type 2025 & 2033
- Figure 53: South America Gaming Chair Market Revenue Share (%), by Type 2025 & 2033
- Figure 54: South America Gaming Chair Market Volume Share (%), by Type 2025 & 2033
- Figure 55: South America Gaming Chair Market Revenue (Million), by End User 2025 & 2033
- Figure 56: South America Gaming Chair Market Volume (K Units), by End User 2025 & 2033
- Figure 57: South America Gaming Chair Market Revenue Share (%), by End User 2025 & 2033
- Figure 58: South America Gaming Chair Market Volume Share (%), by End User 2025 & 2033
- Figure 59: South America Gaming Chair Market Revenue (Million), by Distribution Channel 2025 & 2033
- Figure 60: South America Gaming Chair Market Volume (K Units), by Distribution Channel 2025 & 2033
- Figure 61: South America Gaming Chair Market Revenue Share (%), by Distribution Channel 2025 & 2033
- Figure 62: South America Gaming Chair Market Volume Share (%), by Distribution Channel 2025 & 2033
- Figure 63: South America Gaming Chair Market Revenue (Million), by Country 2025 & 2033
- Figure 64: South America Gaming Chair Market Volume (K Units), by Country 2025 & 2033
- Figure 65: South America Gaming Chair Market Revenue Share (%), by Country 2025 & 2033
- Figure 66: South America Gaming Chair Market Volume Share (%), by Country 2025 & 2033
- Figure 67: Middle East and Africa Gaming Chair Market Revenue (Million), by Type 2025 & 2033
- Figure 68: Middle East and Africa Gaming Chair Market Volume (K Units), by Type 2025 & 2033
- Figure 69: Middle East and Africa Gaming Chair Market Revenue Share (%), by Type 2025 & 2033
- Figure 70: Middle East and Africa Gaming Chair Market Volume Share (%), by Type 2025 & 2033
- Figure 71: Middle East and Africa Gaming Chair Market Revenue (Million), by End User 2025 & 2033
- Figure 72: Middle East and Africa Gaming Chair Market Volume (K Units), by End User 2025 & 2033
- Figure 73: Middle East and Africa Gaming Chair Market Revenue Share (%), by End User 2025 & 2033
- Figure 74: Middle East and Africa Gaming Chair Market Volume Share (%), by End User 2025 & 2033
- Figure 75: Middle East and Africa Gaming Chair Market Revenue (Million), by Distribution Channel 2025 & 2033
- Figure 76: Middle East and Africa Gaming Chair Market Volume (K Units), by Distribution Channel 2025 & 2033
- Figure 77: Middle East and Africa Gaming Chair Market Revenue Share (%), by Distribution Channel 2025 & 2033
- Figure 78: Middle East and Africa Gaming Chair Market Volume Share (%), by Distribution Channel 2025 & 2033
- Figure 79: Middle East and Africa Gaming Chair Market Revenue (Million), by Country 2025 & 2033
- Figure 80: Middle East and Africa Gaming Chair Market Volume (K Units), by Country 2025 & 2033
- Figure 81: Middle East and Africa Gaming Chair Market Revenue Share (%), by Country 2025 & 2033
- Figure 82: Middle East and Africa Gaming Chair Market Volume Share (%), by Country 2025 & 2033
List of Tables
- Table 1: Global Gaming Chair Market Revenue Million Forecast, by Type 2020 & 2033
- Table 2: Global Gaming Chair Market Volume K Units Forecast, by Type 2020 & 2033
- Table 3: Global Gaming Chair Market Revenue Million Forecast, by End User 2020 & 2033
- Table 4: Global Gaming Chair Market Volume K Units Forecast, by End User 2020 & 2033
- Table 5: Global Gaming Chair Market Revenue Million Forecast, by Distribution Channel 2020 & 2033
- Table 6: Global Gaming Chair Market Volume K Units Forecast, by Distribution Channel 2020 & 2033
- Table 7: Global Gaming Chair Market Revenue Million Forecast, by Region 2020 & 2033
- Table 8: Global Gaming Chair Market Volume K Units Forecast, by Region 2020 & 2033
- Table 9: Global Gaming Chair Market Revenue Million Forecast, by Type 2020 & 2033
- Table 10: Global Gaming Chair Market Volume K Units Forecast, by Type 2020 & 2033
- Table 11: Global Gaming Chair Market Revenue Million Forecast, by End User 2020 & 2033
- Table 12: Global Gaming Chair Market Volume K Units Forecast, by End User 2020 & 2033
- Table 13: Global Gaming Chair Market Revenue Million Forecast, by Distribution Channel 2020 & 2033
- Table 14: Global Gaming Chair Market Volume K Units Forecast, by Distribution Channel 2020 & 2033
- Table 15: Global Gaming Chair Market Revenue Million Forecast, by Country 2020 & 2033
- Table 16: Global Gaming Chair Market Volume K Units Forecast, by Country 2020 & 2033
- Table 17: United States Gaming Chair Market Revenue (Million) Forecast, by Application 2020 & 2033
- Table 18: United States Gaming Chair Market Volume (K Units) Forecast, by Application 2020 & 2033
- Table 19: Canada Gaming Chair Market Revenue (Million) Forecast, by Application 2020 & 2033
- Table 20: Canada Gaming Chair Market Volume (K Units) Forecast, by Application 2020 & 2033
- Table 21: Rest of North America Gaming Chair Market Revenue (Million) Forecast, by Application 2020 & 2033
- Table 22: Rest of North America Gaming Chair Market Volume (K Units) Forecast, by Application 2020 & 2033
- Table 23: Global Gaming Chair Market Revenue Million Forecast, by Type 2020 & 2033
- Table 24: Global Gaming Chair Market Volume K Units Forecast, by Type 2020 & 2033
- Table 25: Global Gaming Chair Market Revenue Million Forecast, by End User 2020 & 2033
- Table 26: Global Gaming Chair Market Volume K Units Forecast, by End User 2020 & 2033
- Table 27: Global Gaming Chair Market Revenue Million Forecast, by Distribution Channel 2020 & 2033
- Table 28: Global Gaming Chair Market Volume K Units Forecast, by Distribution Channel 2020 & 2033
- Table 29: Global Gaming Chair Market Revenue Million Forecast, by Country 2020 & 2033
- Table 30: Global Gaming Chair Market Volume K Units Forecast, by Country 2020 & 2033
- Table 31: United Kingdom Gaming Chair Market Revenue (Million) Forecast, by Application 2020 & 2033
- Table 32: United Kingdom Gaming Chair Market Volume (K Units) Forecast, by Application 2020 & 2033
- Table 33: Germany Gaming Chair Market Revenue (Million) Forecast, by Application 2020 & 2033
- Table 34: Germany Gaming Chair Market Volume (K Units) Forecast, by Application 2020 & 2033
- Table 35: Rest of Europe Gaming Chair Market Revenue (Million) Forecast, by Application 2020 & 2033
- Table 36: Rest of Europe Gaming Chair Market Volume (K Units) Forecast, by Application 2020 & 2033
- Table 37: Global Gaming Chair Market Revenue Million Forecast, by Type 2020 & 2033
- Table 38: Global Gaming Chair Market Volume K Units Forecast, by Type 2020 & 2033
- Table 39: Global Gaming Chair Market Revenue Million Forecast, by End User 2020 & 2033
- Table 40: Global Gaming Chair Market Volume K Units Forecast, by End User 2020 & 2033
- Table 41: Global Gaming Chair Market Revenue Million Forecast, by Distribution Channel 2020 & 2033
- Table 42: Global Gaming Chair Market Volume K Units Forecast, by Distribution Channel 2020 & 2033
- Table 43: Global Gaming Chair Market Revenue Million Forecast, by Country 2020 & 2033
- Table 44: Global Gaming Chair Market Volume K Units Forecast, by Country 2020 & 2033
- Table 45: India Gaming Chair Market Revenue (Million) Forecast, by Application 2020 & 2033
- Table 46: India Gaming Chair Market Volume (K Units) Forecast, by Application 2020 & 2033
- Table 47: Japan Gaming Chair Market Revenue (Million) Forecast, by Application 2020 & 2033
- Table 48: Japan Gaming Chair Market Volume (K Units) Forecast, by Application 2020 & 2033
- Table 49: Rest of Asia Pacific Gaming Chair Market Revenue (Million) Forecast, by Application 2020 & 2033
- Table 50: Rest of Asia Pacific Gaming Chair Market Volume (K Units) Forecast, by Application 2020 & 2033
- Table 51: Global Gaming Chair Market Revenue Million Forecast, by Type 2020 & 2033
- Table 52: Global Gaming Chair Market Volume K Units Forecast, by Type 2020 & 2033
- Table 53: Global Gaming Chair Market Revenue Million Forecast, by End User 2020 & 2033
- Table 54: Global Gaming Chair Market Volume K Units Forecast, by End User 2020 & 2033
- Table 55: Global Gaming Chair Market Revenue Million Forecast, by Distribution Channel 2020 & 2033
- Table 56: Global Gaming Chair Market Volume K Units Forecast, by Distribution Channel 2020 & 2033
- Table 57: Global Gaming Chair Market Revenue Million Forecast, by Country 2020 & 2033
- Table 58: Global Gaming Chair Market Volume K Units Forecast, by Country 2020 & 2033
- Table 59: Brazil Gaming Chair Market Revenue (Million) Forecast, by Application 2020 & 2033
- Table 60: Brazil Gaming Chair Market Volume (K Units) Forecast, by Application 2020 & 2033
- Table 61: Peru Gaming Chair Market Revenue (Million) Forecast, by Application 2020 & 2033
- Table 62: Peru Gaming Chair Market Volume (K Units) Forecast, by Application 2020 & 2033
- Table 63: Rest of South America Gaming Chair Market Revenue (Million) Forecast, by Application 2020 & 2033
- Table 64: Rest of South America Gaming Chair Market Volume (K Units) Forecast, by Application 2020 & 2033
- Table 65: Global Gaming Chair Market Revenue Million Forecast, by Type 2020 & 2033
- Table 66: Global Gaming Chair Market Volume K Units Forecast, by Type 2020 & 2033
- Table 67: Global Gaming Chair Market Revenue Million Forecast, by End User 2020 & 2033
- Table 68: Global Gaming Chair Market Volume K Units Forecast, by End User 2020 & 2033
- Table 69: Global Gaming Chair Market Revenue Million Forecast, by Distribution Channel 2020 & 2033
- Table 70: Global Gaming Chair Market Volume K Units Forecast, by Distribution Channel 2020 & 2033
- Table 71: Global Gaming Chair Market Revenue Million Forecast, by Country 2020 & 2033
- Table 72: Global Gaming Chair Market Volume K Units Forecast, by Country 2020 & 2033
- Table 73: Saudi Arabia Gaming Chair Market Revenue (Million) Forecast, by Application 2020 & 2033
- Table 74: Saudi Arabia Gaming Chair Market Volume (K Units) Forecast, by Application 2020 & 2033
- Table 75: United Arab Emirates Gaming Chair Market Revenue (Million) Forecast, by Application 2020 & 2033
- Table 76: United Arab Emirates Gaming Chair Market Volume (K Units) Forecast, by Application 2020 & 2033
- Table 77: Rest of Middle East and Africa Gaming Chair Market Revenue (Million) Forecast, by Application 2020 & 2033
- Table 78: Rest of Middle East and Africa Gaming Chair Market Volume (K Units) Forecast, by Application 2020 & 2033
Frequently Asked Questions
1. What is the projected Compound Annual Growth Rate (CAGR) of the Gaming Chair Market?
The projected CAGR is approximately 8.15%.
2. Which companies are prominent players in the Gaming Chair Market?
Key companies in the market include GT Omega Racing, Corsair, X Rocker, DxRacer USA, Arozzi, AkRacing, Noblechairs, Vertagear, Ace Casual Furniture, Secretlab.
3. What are the main segments of the Gaming Chair Market?
The market segments include Type, End User, Distribution Channel.
4. Can you provide details about the market size?
The market size is estimated to be USD 1.45 Million as of 2022.
5. What are some drivers contributing to market growth?
Technological Advancement booming the industry; Focus on Ergonomics and Comfort.
6. What are the notable trends driving market growth?
Expanding Video Gaming Industry is Driving the Market.
7. Are there any restraints impacting market growth?
High cost; Limited Target Audience.
8. Can you provide examples of recent developments in the market?
August 2022: Cybeart, a Canadian manufacturer of premium gaming accessories, announced the world's first Lord of the Rings Chair on 25th August 2022. In addition to Cybeart's existing range of officially licensed products, the upcoming product line will be a continuation of its ongoing partnership with Warner Bros.
9. What pricing options are available for accessing the report?
Pricing options include single-user, multi-user, and enterprise licenses priced at USD 4750, USD 5250, and USD 8750 respectively.
10. Is the market size provided in terms of value or volume?
The market size is provided in terms of value, measured in Million and volume, measured in K Units.
11. Are there any specific market keywords associated with the report?
Yes, the market keyword associated with the report is "Gaming Chair Market," which aids in identifying and referencing the specific market segment covered.
12. How do I determine which pricing option suits my needs best?
The pricing options vary based on user requirements and access needs. Individual users may opt for single-user licenses, while businesses requiring broader access may choose multi-user or enterprise licenses for cost-effective access to the report.
13. Are there any additional resources or data provided in the Gaming Chair Market report?
While the report offers comprehensive insights, it's advisable to review the specific contents or supplementary materials provided to ascertain if additional resources or data are available.
14. How can I stay updated on further developments or reports in the Gaming Chair Market?
To stay informed about further developments, trends, and reports in the Gaming Chair Market, consider subscribing to industry newsletters, following relevant companies and organizations, or regularly checking reputable industry news sources and publications.
Methodology
Step 1 - Identification of Relevant Samples Size from Population Database


Step 2 - Approaches for Defining Global Market Size (Value, Volume* & Price*)

Note*: In applicable scenarios
Step 3 - Data Sources
Primary Research
- Web Analytics
- Survey Reports
- Research Institute
- Latest Research Reports
- Opinion Leaders
Secondary Research
- Annual Reports
- White Paper
- Latest Press Release
- Industry Association
- Paid Database
- Investor Presentations

Step 4 - Data Triangulation
Involves using different sources of information in order to increase the validity of a study
These sources are likely to be stakeholders in a program - participants, other researchers, program staff, other community members, and so on.
Then we put all data in single framework & apply various statistical tools to find out the dynamic on the market.
During the analysis stage, feedback from the stakeholder groups would be compared to determine areas of agreement as well as areas of divergence