

Key Insights
The global market for Food and Beverage Metal Cans is poised for steady expansion, projected to reach $64,160 million by 2025. This growth is underpinned by a 3% CAGR over the study period, indicating a consistent demand for these essential packaging solutions. The primary drivers for this market include the increasing consumer preference for convenience and portability in food and beverage consumption, especially among the burgeoning millennial and Gen Z populations. Furthermore, the inherent sustainability benefits of metal cans, such as their recyclability and durability, align with growing environmental consciousness among consumers and manufacturers alike. The food industry remains a dominant segment, driven by the demand for canned fruits, vegetables, meats, and pet food, while the beverage industry is experiencing robust growth fueled by sparkling beverages, beer, and ready-to-drink (RTD) options. Innovations in can design, such as enhanced barrier properties and improved shelf appeal, also contribute to market vitality.
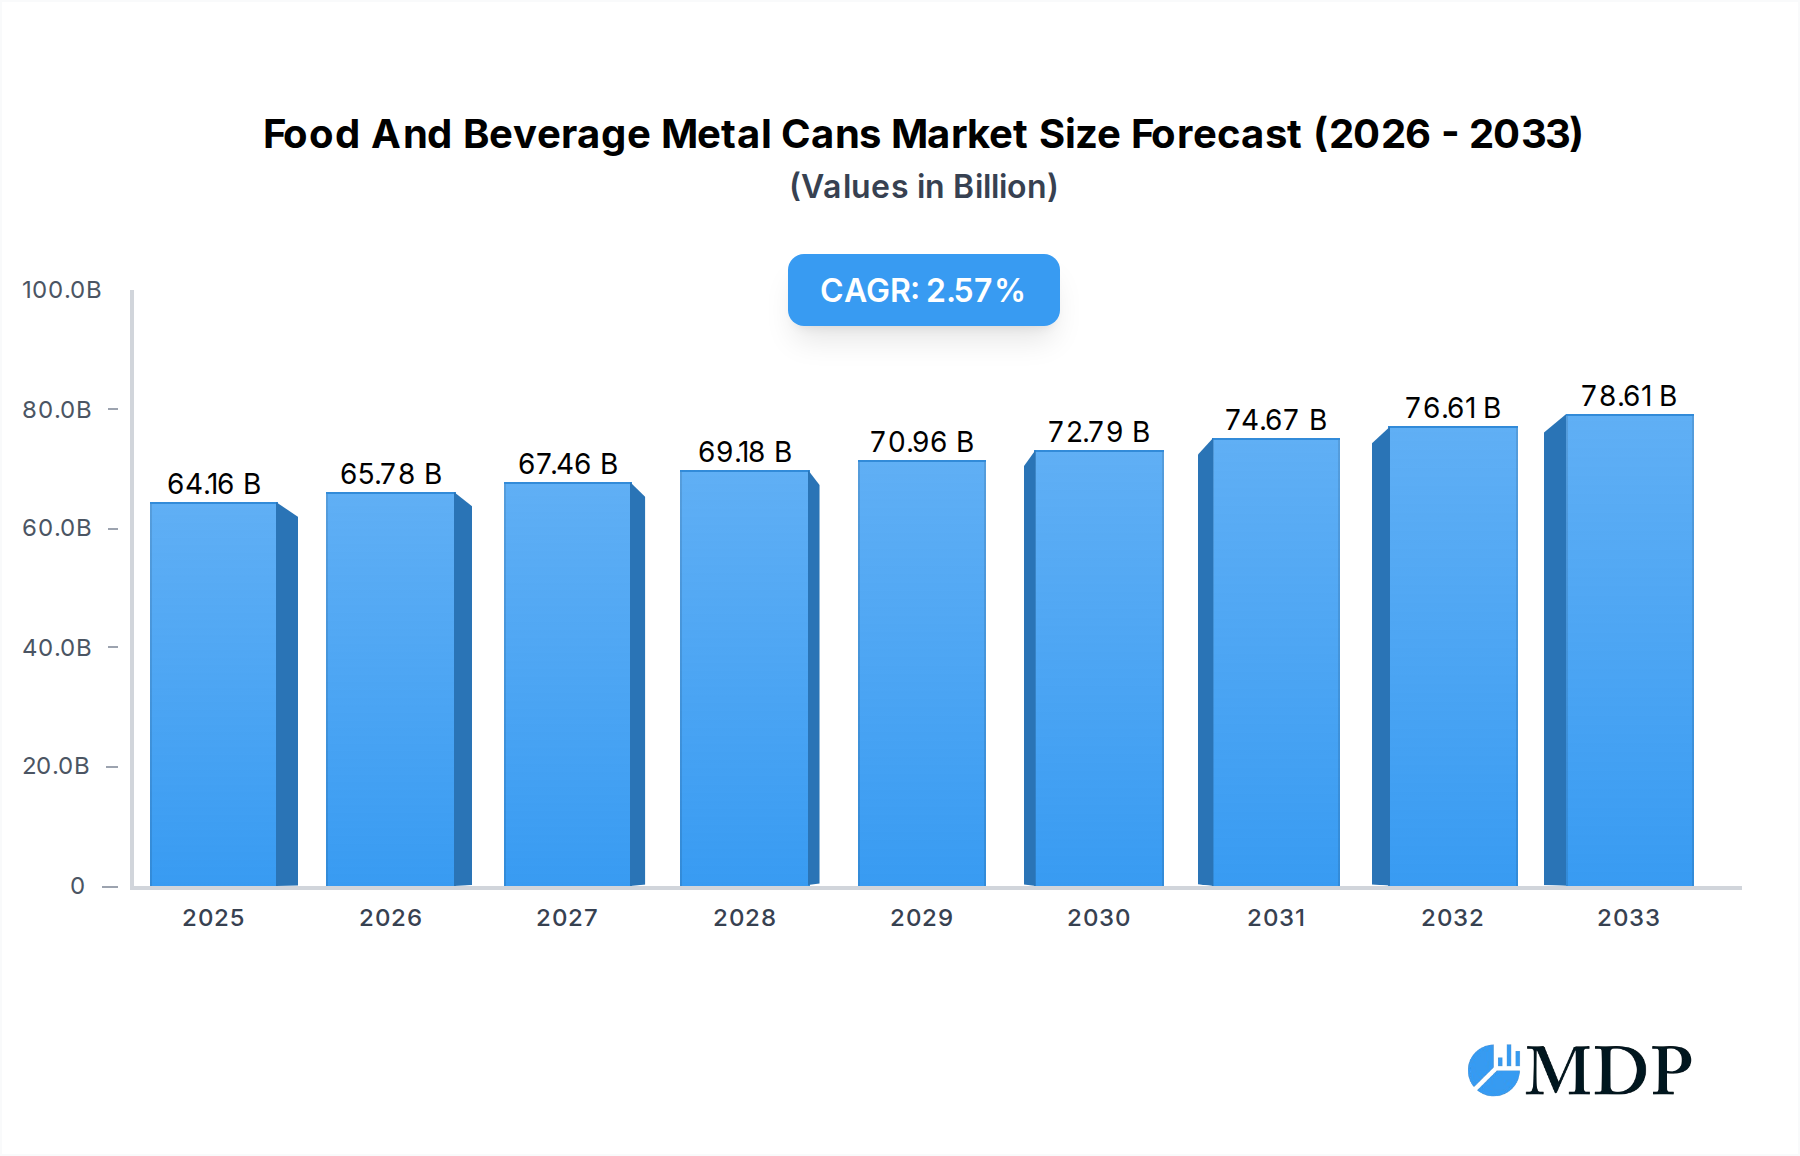
Food And Beverage Metal Cans Market Size (In Billion)
Despite the positive outlook, certain factors could temper growth. The rising cost of raw materials, particularly aluminum and steel, presents a significant restraint, potentially impacting profit margins for manufacturers and leading to price increases for end-users. Intense competition within the packaging industry, coupled with the emergence of alternative packaging materials like flexible pouches and glass, also poses a challenge. However, the resilience of metal cans in protecting product integrity, their established supply chains, and ongoing technological advancements in manufacturing processes are expected to mitigate these restraints. The market is characterized by a fragmented landscape with major players like Ball Corporation and Crown Holdings actively engaged in strategic partnerships, mergers, and acquisitions to expand their geographical reach and product portfolios. The Asia Pacific region, particularly China and India, is anticipated to be a key growth engine due to rapid urbanization, a growing middle class, and increasing disposable incomes, leading to higher consumption of packaged food and beverages.

Food And Beverage Metal Cans Company Market Share
Food and Beverage Metal Cans Market: Comprehensive Analysis and Forecast (2019–2033)
This in-depth report provides a strategic analysis of the global Food and Beverage Metal Cans market, offering critical insights for industry stakeholders. Covering the period from 2019 to 2033, with a base and estimated year of 2025, this report delves into market dynamics, key trends, leading segments, product innovations, growth drivers, challenges, opportunities, and a comprehensive overview of leading players and their milestones.
Food And Beverage Metal Cans Market Dynamics & Concentration
The global Food and Beverage Metal Cans market exhibits a moderate to high concentration, with key players like Ball Corporation, Crown Holdings, and Ardagh Group commanding a significant portion of the market share, estimated to be over sixty million in combined revenue. Innovation remains a crucial driver, fueled by advancements in material science and manufacturing processes, leading to the development of lighter, more sustainable, and aesthetically appealing cans. Regulatory frameworks, particularly concerning food safety, recyclability, and environmental impact, are continuously evolving, influencing manufacturing standards and consumer choices. While product substitutes like plastic and glass containers exist, metal cans continue to maintain their dominance due to superior barrier properties, durability, and cost-effectiveness. End-user trends are leaning towards convenient packaging formats, single-serve options, and a growing preference for recycled content. Mergers and acquisitions (M&A) activities have been a strategic tool for market expansion and consolidation, with approximately twenty-five major M&A deals recorded in the historical period, further shaping the competitive landscape.
Food And Beverage Metal Cans Industry Trends & Analysis
The Food and Beverage Metal Cans industry is experiencing robust growth, propelled by an estimated Compound Annual Growth Rate (CAGR) of approximately 4.8% during the forecast period of 2025–2033. This expansion is primarily driven by increasing global consumption of processed foods and beverages, coupled with a rising demand for convenient and portable packaging solutions. Technological disruptions, such as advancements in can manufacturing techniques (e.g., improved metal forming, thinner wall technology, and enhanced coating formulations), are contributing to cost efficiencies and improved product quality. Consumer preferences are shifting towards sustainable packaging, which has spurred innovation in recyclable and lightweight metal cans, leading to a significant increase in market penetration for these eco-friendly options. The competitive dynamics within the industry are characterized by a blend of established global players and regional manufacturers, all vying for market share through product differentiation, strategic pricing, and robust distribution networks. The beverage industry, in particular, continues to be a major consumer of metal cans, driven by the popularity of carbonated soft drinks, beer, and ready-to-drink (RTD) beverages. The food industry is also witnessing steady growth, with increasing adoption of metal cans for products like soups, vegetables, fruits, and pet food. Market penetration for metal cans is projected to reach over eighty-five percent in key application segments by 2025, a testament to their enduring appeal and versatility.
Leading Markets & Segments in Food And Beverage Metal Cans
The Beverage Industry segment stands out as the dominant market for Food and Beverage Metal Cans, accounting for an estimated seventy-five million in market share. Within this segment, carbonated soft drinks and alcoholic beverages, including beer, represent the largest sub-segments due to their widespread consumer appeal and the inherent suitability of metal cans for maintaining carbonation and freshness. The Food Industry segment, while smaller, is exhibiting strong growth, particularly in categories like ready-to-eat meals, processed fruits and vegetables, and pet food.
- Dominant Region: North America and Asia Pacific. These regions are leading the global market due to a confluence of factors including high disposable incomes, a growing population, and a well-established food and beverage processing industry. Economic policies that encourage domestic manufacturing and robust infrastructure supporting logistics and distribution further bolster their dominance.
- Type: Two-piece Cans are increasingly preferred over Three-piece Cans due to their superior aesthetics, lighter weight, and cost-effectiveness in production. This shift is driven by advancements in deep drawing and ironing (D&I) technology, allowing for seamless, stronger, and more visually appealing packaging. The demand for two-piece cans is projected to continue its upward trajectory, capturing an estimated seventy percent of the market share by 2033.
- Key Drivers for Dominance:
- Consumer Demand for Convenience: The growing urbanization and fast-paced lifestyles are fueling the demand for single-serve and easy-to-open food and beverage packaging.
- Shelf Stability and Product Protection: Metal cans offer excellent barrier properties against light, oxygen, and moisture, ensuring extended shelf life and product integrity, which is crucial for a wide range of food and beverage products.
- Sustainability Initiatives: Increasing consumer and regulatory focus on recyclability and circular economy principles favors metal cans, which boast high recycling rates globally.
Food And Beverage Metal Cans Product Developments
Product innovation in the Food and Beverage Metal Cans sector is characterized by a focus on enhanced sustainability, improved functionality, and aesthetic appeal. Advancements include the development of lighter-weight cans with reduced material usage, sophisticated interior and exterior coatings that enhance product protection and branding, and easy-open lid technologies. The integration of smart packaging features, such as QR codes for enhanced traceability and consumer engagement, is also gaining traction. These innovations aim to provide manufacturers with a competitive edge by offering cost-effective, environmentally friendly, and consumer-centric packaging solutions that meet evolving market demands and regulatory requirements, with an estimated thirty million in new product development investments in the historical period.
Key Drivers of Food And Beverage Metal Cans Growth
Several key factors are propelling the growth of the Food and Beverage Metal Cans market. Technologically, advancements in can manufacturing, such as high-speed production lines and energy-efficient processes, are reducing costs and increasing output. Economically, rising global disposable incomes and the expanding middle class in emerging economies are driving increased consumption of packaged foods and beverages. Regulatory support for recycling and sustainable packaging further incentivizes the use of metal cans. The expanding ready-to-drink (RTD) beverage market and the growing demand for convenient, single-serve portions are also significant growth accelerators.
Challenges in the Food And Beverage Metal Cans Market
Despite the positive growth trajectory, the Food and Beverage Metal Cans market faces certain challenges. Fluctuations in the prices of raw materials, particularly aluminum and steel, can impact manufacturing costs and profitability. Intense competition from alternative packaging materials like plastics and flexible packaging remains a constant pressure. Stringent environmental regulations concerning waste management and emissions, while promoting sustainability, also necessitate significant investments in compliance and process upgrades. Furthermore, global supply chain disruptions can affect the availability of raw materials and the timely delivery of finished products, leading to potential production delays and increased logistical costs, with an estimated impact of over five million in supply chain disruptions in the historical period.
Emerging Opportunities in Food And Beverage Metal Cans
Emerging opportunities within the Food and Beverage Metal Cans market lie in the growing demand for sustainable and recyclable packaging solutions, driven by increasing consumer awareness and governmental regulations. Technological breakthroughs in material science are enabling the development of thinner, lighter, and stronger metal cans, reducing both material costs and carbon footprint. Strategic partnerships between can manufacturers and beverage and food companies can foster innovation in specialized packaging designs and functionalities. Furthermore, market expansion into untapped developing economies, where processed food and beverage consumption is on the rise, presents significant growth potential, with an estimated thirty million in untapped market potential.
Leading Players in the Food And Beverage Metal Cans Sector
- Ball Corporation
- Crown Holdings
- Ardagh Group
- Toyo Seikan
- Silgan Holdings Inc
- Can Pack Group
- Daiwa Can Company
- ORG Technology
- CPMC Holdings
- Hokkan Holdings
- Baosteel Packaging
- Showa Aluminum Can Corporation
- ShengXing Group
Key Milestones in Food And Beverage Metal Cans Industry
- 2019: Ball Corporation acquires Alco Standard Corporation, enhancing its beverage packaging portfolio.
- 2020: Crown Holdings launches new lightweight aluminum cans for beverages, focusing on sustainability.
- 2021: Ardagh Group announces significant investments in expanding its beverage can manufacturing capacity in Europe.
- 2022: Toyo Seikan Group Holdings develops innovative, thinner wall cans for food products, improving efficiency.
- 2023: Silgan Holdings Inc. completes the acquisition of Albéa’s rigid packaging business, expanding its reach in the food and beverage sector.
- 2024: Can Pack Group invests in advanced recycling technologies to enhance the sustainability of its metal cans.
Strategic Outlook for Food And Beverage Metal Cans Market
The strategic outlook for the Food and Beverage Metal Cans market is highly promising, driven by a confluence of factors including a growing global population, increasing demand for convenience, and a strong emphasis on sustainable packaging. Manufacturers are expected to continue investing in technological advancements to optimize production processes, reduce environmental impact, and enhance product appeal. Strategic opportunities for growth include further penetration into emerging markets, diversification into new food and beverage applications, and continued innovation in recyclable and lightweight can designs. Collaboration with value chain partners and a proactive approach to regulatory changes will be crucial for sustained success in this dynamic market, with an estimated growth acceleration of over six million in strategic investments foreseen.
Food And Beverage Metal Cans Segmentation
-
1. Application
- 1.1. Food Industry
- 1.2. Beverage Industry
-
2. Type
- 2.1. Three-piece Cans
- 2.2. Two-piece Cans
Food And Beverage Metal Cans Segmentation By Geography
-
1. North America
- 1.1. United States
- 1.2. Canada
- 1.3. Mexico
-
2. South America
- 2.1. Brazil
- 2.2. Argentina
- 2.3. Rest of South America
-
3. Europe
- 3.1. United Kingdom
- 3.2. Germany
- 3.3. France
- 3.4. Italy
- 3.5. Spain
- 3.6. Russia
- 3.7. Benelux
- 3.8. Nordics
- 3.9. Rest of Europe
-
4. Middle East & Africa
- 4.1. Turkey
- 4.2. Israel
- 4.3. GCC
- 4.4. North Africa
- 4.5. South Africa
- 4.6. Rest of Middle East & Africa
-
5. Asia Pacific
- 5.1. China
- 5.2. India
- 5.3. Japan
- 5.4. South Korea
- 5.5. ASEAN
- 5.6. Oceania
- 5.7. Rest of Asia Pacific
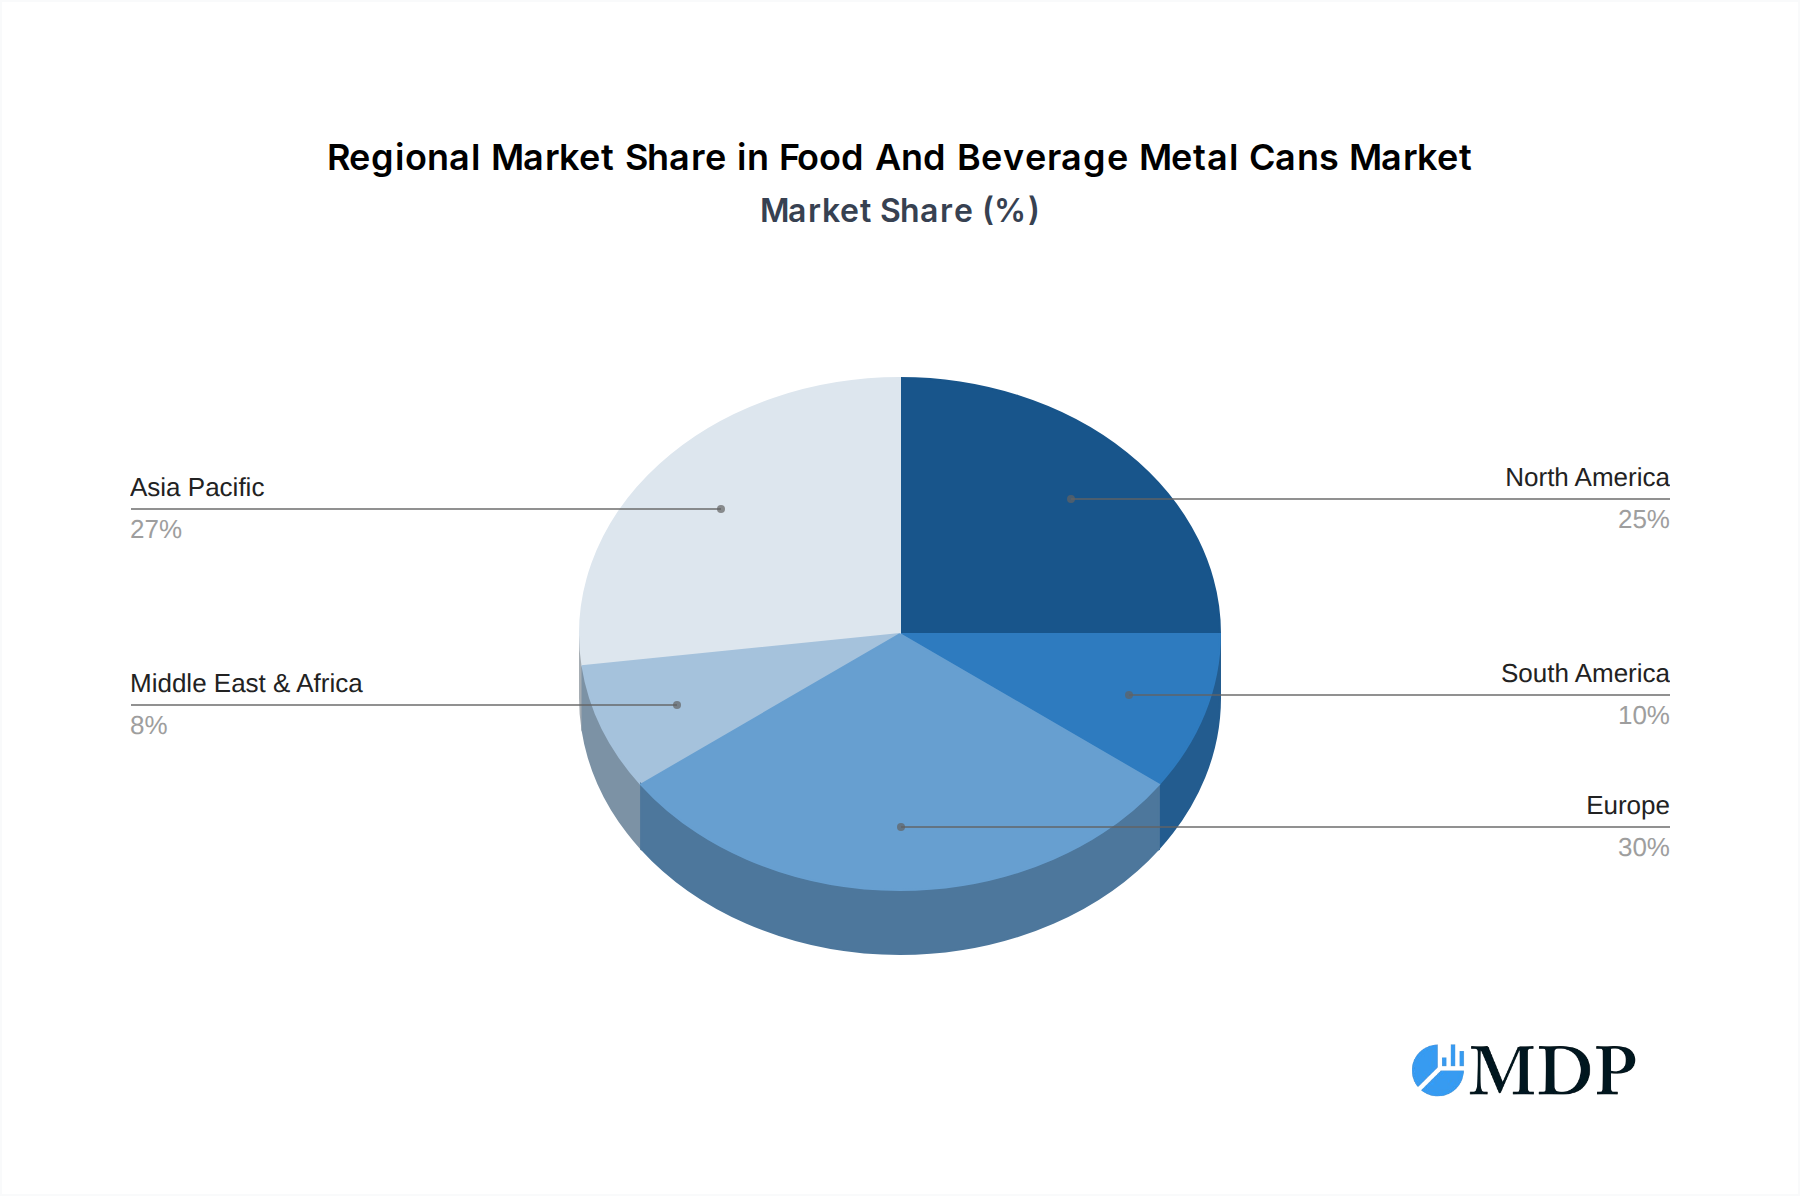
Food And Beverage Metal Cans Regional Market Share
Geographic Coverage of Food And Beverage Metal Cans
Food And Beverage Metal Cans REPORT HIGHLIGHTS
| Aspects | Details |
|---|---|
| Study Period | 2020-2034 |
| Base Year | 2025 |
| Estimated Year | 2026 |
| Forecast Period | 2026-2034 |
| Historical Period | 2020-2025 |
| Growth Rate | CAGR of 3% from 2020-2034 |
| Segmentation |
|
Table of Contents
- 1. Introduction
- 1.1. Research Scope
- 1.2. Market Segmentation
- 1.3. Research Methodology
- 1.4. Definitions and Assumptions
- 2. Executive Summary
- 2.1. Introduction
- 3. Market Dynamics
- 3.1. Introduction
- 3.2. Market Drivers
- 3.3. Market Restrains
- 3.4. Market Trends
- 4. Market Factor Analysis
- 4.1. Porters Five Forces
- 4.2. Supply/Value Chain
- 4.3. PESTEL analysis
- 4.4. Market Entropy
- 4.5. Patent/Trademark Analysis
- 5. Global Food And Beverage Metal Cans Analysis, Insights and Forecast, 2020-2032
- 5.1. Market Analysis, Insights and Forecast - by Application
- 5.1.1. Food Industry
- 5.1.2. Beverage Industry
- 5.2. Market Analysis, Insights and Forecast - by Type
- 5.2.1. Three-piece Cans
- 5.2.2. Two-piece Cans
- 5.3. Market Analysis, Insights and Forecast - by Region
- 5.3.1. North America
- 5.3.2. South America
- 5.3.3. Europe
- 5.3.4. Middle East & Africa
- 5.3.5. Asia Pacific
- 5.1. Market Analysis, Insights and Forecast - by Application
- 6. North America Food And Beverage Metal Cans Analysis, Insights and Forecast, 2020-2032
- 6.1. Market Analysis, Insights and Forecast - by Application
- 6.1.1. Food Industry
- 6.1.2. Beverage Industry
- 6.2. Market Analysis, Insights and Forecast - by Type
- 6.2.1. Three-piece Cans
- 6.2.2. Two-piece Cans
- 6.1. Market Analysis, Insights and Forecast - by Application
- 7. South America Food And Beverage Metal Cans Analysis, Insights and Forecast, 2020-2032
- 7.1. Market Analysis, Insights and Forecast - by Application
- 7.1.1. Food Industry
- 7.1.2. Beverage Industry
- 7.2. Market Analysis, Insights and Forecast - by Type
- 7.2.1. Three-piece Cans
- 7.2.2. Two-piece Cans
- 7.1. Market Analysis, Insights and Forecast - by Application
- 8. Europe Food And Beverage Metal Cans Analysis, Insights and Forecast, 2020-2032
- 8.1. Market Analysis, Insights and Forecast - by Application
- 8.1.1. Food Industry
- 8.1.2. Beverage Industry
- 8.2. Market Analysis, Insights and Forecast - by Type
- 8.2.1. Three-piece Cans
- 8.2.2. Two-piece Cans
- 8.1. Market Analysis, Insights and Forecast - by Application
- 9. Middle East & Africa Food And Beverage Metal Cans Analysis, Insights and Forecast, 2020-2032
- 9.1. Market Analysis, Insights and Forecast - by Application
- 9.1.1. Food Industry
- 9.1.2. Beverage Industry
- 9.2. Market Analysis, Insights and Forecast - by Type
- 9.2.1. Three-piece Cans
- 9.2.2. Two-piece Cans
- 9.1. Market Analysis, Insights and Forecast - by Application
- 10. Asia Pacific Food And Beverage Metal Cans Analysis, Insights and Forecast, 2020-2032
- 10.1. Market Analysis, Insights and Forecast - by Application
- 10.1.1. Food Industry
- 10.1.2. Beverage Industry
- 10.2. Market Analysis, Insights and Forecast - by Type
- 10.2.1. Three-piece Cans
- 10.2.2. Two-piece Cans
- 10.1. Market Analysis, Insights and Forecast - by Application
- 11. Competitive Analysis
- 11.1. Global Market Share Analysis 2025
- 11.2. Company Profiles
- 11.2.1 Ball Corporation
- 11.2.1.1. Overview
- 11.2.1.2. Products
- 11.2.1.3. SWOT Analysis
- 11.2.1.4. Recent Developments
- 11.2.1.5. Financials (Based on Availability)
- 11.2.2 Crown Holdings
- 11.2.2.1. Overview
- 11.2.2.2. Products
- 11.2.2.3. SWOT Analysis
- 11.2.2.4. Recent Developments
- 11.2.2.5. Financials (Based on Availability)
- 11.2.3 Ardagh group
- 11.2.3.1. Overview
- 11.2.3.2. Products
- 11.2.3.3. SWOT Analysis
- 11.2.3.4. Recent Developments
- 11.2.3.5. Financials (Based on Availability)
- 11.2.4 Toyo Seikan
- 11.2.4.1. Overview
- 11.2.4.2. Products
- 11.2.4.3. SWOT Analysis
- 11.2.4.4. Recent Developments
- 11.2.4.5. Financials (Based on Availability)
- 11.2.5 Silgan Holdings Inc
- 11.2.5.1. Overview
- 11.2.5.2. Products
- 11.2.5.3. SWOT Analysis
- 11.2.5.4. Recent Developments
- 11.2.5.5. Financials (Based on Availability)
- 11.2.6 Can Pack Group
- 11.2.6.1. Overview
- 11.2.6.2. Products
- 11.2.6.3. SWOT Analysis
- 11.2.6.4. Recent Developments
- 11.2.6.5. Financials (Based on Availability)
- 11.2.7 Daiwa Can Company
- 11.2.7.1. Overview
- 11.2.7.2. Products
- 11.2.7.3. SWOT Analysis
- 11.2.7.4. Recent Developments
- 11.2.7.5. Financials (Based on Availability)
- 11.2.8 ORG Technology
- 11.2.8.1. Overview
- 11.2.8.2. Products
- 11.2.8.3. SWOT Analysis
- 11.2.8.4. Recent Developments
- 11.2.8.5. Financials (Based on Availability)
- 11.2.9 CPMC Holdings
- 11.2.9.1. Overview
- 11.2.9.2. Products
- 11.2.9.3. SWOT Analysis
- 11.2.9.4. Recent Developments
- 11.2.9.5. Financials (Based on Availability)
- 11.2.10 Hokkan Holdings
- 11.2.10.1. Overview
- 11.2.10.2. Products
- 11.2.10.3. SWOT Analysis
- 11.2.10.4. Recent Developments
- 11.2.10.5. Financials (Based on Availability)
- 11.2.11 Baosteel Packaging
- 11.2.11.1. Overview
- 11.2.11.2. Products
- 11.2.11.3. SWOT Analysis
- 11.2.11.4. Recent Developments
- 11.2.11.5. Financials (Based on Availability)
- 11.2.12 Showa Aluminum Can Corporation
- 11.2.12.1. Overview
- 11.2.12.2. Products
- 11.2.12.3. SWOT Analysis
- 11.2.12.4. Recent Developments
- 11.2.12.5. Financials (Based on Availability)
- 11.2.13 ShengXing Group
- 11.2.13.1. Overview
- 11.2.13.2. Products
- 11.2.13.3. SWOT Analysis
- 11.2.13.4. Recent Developments
- 11.2.13.5. Financials (Based on Availability)
- 11.2.1 Ball Corporation
List of Figures
- Figure 1: Global Food And Beverage Metal Cans Revenue Breakdown (million, %) by Region 2025 & 2033
- Figure 2: Global Food And Beverage Metal Cans Volume Breakdown (K, %) by Region 2025 & 2033
- Figure 3: North America Food And Beverage Metal Cans Revenue (million), by Application 2025 & 2033
- Figure 4: North America Food And Beverage Metal Cans Volume (K), by Application 2025 & 2033
- Figure 5: North America Food And Beverage Metal Cans Revenue Share (%), by Application 2025 & 2033
- Figure 6: North America Food And Beverage Metal Cans Volume Share (%), by Application 2025 & 2033
- Figure 7: North America Food And Beverage Metal Cans Revenue (million), by Type 2025 & 2033
- Figure 8: North America Food And Beverage Metal Cans Volume (K), by Type 2025 & 2033
- Figure 9: North America Food And Beverage Metal Cans Revenue Share (%), by Type 2025 & 2033
- Figure 10: North America Food And Beverage Metal Cans Volume Share (%), by Type 2025 & 2033
- Figure 11: North America Food And Beverage Metal Cans Revenue (million), by Country 2025 & 2033
- Figure 12: North America Food And Beverage Metal Cans Volume (K), by Country 2025 & 2033
- Figure 13: North America Food And Beverage Metal Cans Revenue Share (%), by Country 2025 & 2033
- Figure 14: North America Food And Beverage Metal Cans Volume Share (%), by Country 2025 & 2033
- Figure 15: South America Food And Beverage Metal Cans Revenue (million), by Application 2025 & 2033
- Figure 16: South America Food And Beverage Metal Cans Volume (K), by Application 2025 & 2033
- Figure 17: South America Food And Beverage Metal Cans Revenue Share (%), by Application 2025 & 2033
- Figure 18: South America Food And Beverage Metal Cans Volume Share (%), by Application 2025 & 2033
- Figure 19: South America Food And Beverage Metal Cans Revenue (million), by Type 2025 & 2033
- Figure 20: South America Food And Beverage Metal Cans Volume (K), by Type 2025 & 2033
- Figure 21: South America Food And Beverage Metal Cans Revenue Share (%), by Type 2025 & 2033
- Figure 22: South America Food And Beverage Metal Cans Volume Share (%), by Type 2025 & 2033
- Figure 23: South America Food And Beverage Metal Cans Revenue (million), by Country 2025 & 2033
- Figure 24: South America Food And Beverage Metal Cans Volume (K), by Country 2025 & 2033
- Figure 25: South America Food And Beverage Metal Cans Revenue Share (%), by Country 2025 & 2033
- Figure 26: South America Food And Beverage Metal Cans Volume Share (%), by Country 2025 & 2033
- Figure 27: Europe Food And Beverage Metal Cans Revenue (million), by Application 2025 & 2033
- Figure 28: Europe Food And Beverage Metal Cans Volume (K), by Application 2025 & 2033
- Figure 29: Europe Food And Beverage Metal Cans Revenue Share (%), by Application 2025 & 2033
- Figure 30: Europe Food And Beverage Metal Cans Volume Share (%), by Application 2025 & 2033
- Figure 31: Europe Food And Beverage Metal Cans Revenue (million), by Type 2025 & 2033
- Figure 32: Europe Food And Beverage Metal Cans Volume (K), by Type 2025 & 2033
- Figure 33: Europe Food And Beverage Metal Cans Revenue Share (%), by Type 2025 & 2033
- Figure 34: Europe Food And Beverage Metal Cans Volume Share (%), by Type 2025 & 2033
- Figure 35: Europe Food And Beverage Metal Cans Revenue (million), by Country 2025 & 2033
- Figure 36: Europe Food And Beverage Metal Cans Volume (K), by Country 2025 & 2033
- Figure 37: Europe Food And Beverage Metal Cans Revenue Share (%), by Country 2025 & 2033
- Figure 38: Europe Food And Beverage Metal Cans Volume Share (%), by Country 2025 & 2033
- Figure 39: Middle East & Africa Food And Beverage Metal Cans Revenue (million), by Application 2025 & 2033
- Figure 40: Middle East & Africa Food And Beverage Metal Cans Volume (K), by Application 2025 & 2033
- Figure 41: Middle East & Africa Food And Beverage Metal Cans Revenue Share (%), by Application 2025 & 2033
- Figure 42: Middle East & Africa Food And Beverage Metal Cans Volume Share (%), by Application 2025 & 2033
- Figure 43: Middle East & Africa Food And Beverage Metal Cans Revenue (million), by Type 2025 & 2033
- Figure 44: Middle East & Africa Food And Beverage Metal Cans Volume (K), by Type 2025 & 2033
- Figure 45: Middle East & Africa Food And Beverage Metal Cans Revenue Share (%), by Type 2025 & 2033
- Figure 46: Middle East & Africa Food And Beverage Metal Cans Volume Share (%), by Type 2025 & 2033
- Figure 47: Middle East & Africa Food And Beverage Metal Cans Revenue (million), by Country 2025 & 2033
- Figure 48: Middle East & Africa Food And Beverage Metal Cans Volume (K), by Country 2025 & 2033
- Figure 49: Middle East & Africa Food And Beverage Metal Cans Revenue Share (%), by Country 2025 & 2033
- Figure 50: Middle East & Africa Food And Beverage Metal Cans Volume Share (%), by Country 2025 & 2033
- Figure 51: Asia Pacific Food And Beverage Metal Cans Revenue (million), by Application 2025 & 2033
- Figure 52: Asia Pacific Food And Beverage Metal Cans Volume (K), by Application 2025 & 2033
- Figure 53: Asia Pacific Food And Beverage Metal Cans Revenue Share (%), by Application 2025 & 2033
- Figure 54: Asia Pacific Food And Beverage Metal Cans Volume Share (%), by Application 2025 & 2033
- Figure 55: Asia Pacific Food And Beverage Metal Cans Revenue (million), by Type 2025 & 2033
- Figure 56: Asia Pacific Food And Beverage Metal Cans Volume (K), by Type 2025 & 2033
- Figure 57: Asia Pacific Food And Beverage Metal Cans Revenue Share (%), by Type 2025 & 2033
- Figure 58: Asia Pacific Food And Beverage Metal Cans Volume Share (%), by Type 2025 & 2033
- Figure 59: Asia Pacific Food And Beverage Metal Cans Revenue (million), by Country 2025 & 2033
- Figure 60: Asia Pacific Food And Beverage Metal Cans Volume (K), by Country 2025 & 2033
- Figure 61: Asia Pacific Food And Beverage Metal Cans Revenue Share (%), by Country 2025 & 2033
- Figure 62: Asia Pacific Food And Beverage Metal Cans Volume Share (%), by Country 2025 & 2033
List of Tables
- Table 1: Global Food And Beverage Metal Cans Revenue million Forecast, by Application 2020 & 2033
- Table 2: Global Food And Beverage Metal Cans Volume K Forecast, by Application 2020 & 2033
- Table 3: Global Food And Beverage Metal Cans Revenue million Forecast, by Type 2020 & 2033
- Table 4: Global Food And Beverage Metal Cans Volume K Forecast, by Type 2020 & 2033
- Table 5: Global Food And Beverage Metal Cans Revenue million Forecast, by Region 2020 & 2033
- Table 6: Global Food And Beverage Metal Cans Volume K Forecast, by Region 2020 & 2033
- Table 7: Global Food And Beverage Metal Cans Revenue million Forecast, by Application 2020 & 2033
- Table 8: Global Food And Beverage Metal Cans Volume K Forecast, by Application 2020 & 2033
- Table 9: Global Food And Beverage Metal Cans Revenue million Forecast, by Type 2020 & 2033
- Table 10: Global Food And Beverage Metal Cans Volume K Forecast, by Type 2020 & 2033
- Table 11: Global Food And Beverage Metal Cans Revenue million Forecast, by Country 2020 & 2033
- Table 12: Global Food And Beverage Metal Cans Volume K Forecast, by Country 2020 & 2033
- Table 13: United States Food And Beverage Metal Cans Revenue (million) Forecast, by Application 2020 & 2033
- Table 14: United States Food And Beverage Metal Cans Volume (K) Forecast, by Application 2020 & 2033
- Table 15: Canada Food And Beverage Metal Cans Revenue (million) Forecast, by Application 2020 & 2033
- Table 16: Canada Food And Beverage Metal Cans Volume (K) Forecast, by Application 2020 & 2033
- Table 17: Mexico Food And Beverage Metal Cans Revenue (million) Forecast, by Application 2020 & 2033
- Table 18: Mexico Food And Beverage Metal Cans Volume (K) Forecast, by Application 2020 & 2033
- Table 19: Global Food And Beverage Metal Cans Revenue million Forecast, by Application 2020 & 2033
- Table 20: Global Food And Beverage Metal Cans Volume K Forecast, by Application 2020 & 2033
- Table 21: Global Food And Beverage Metal Cans Revenue million Forecast, by Type 2020 & 2033
- Table 22: Global Food And Beverage Metal Cans Volume K Forecast, by Type 2020 & 2033
- Table 23: Global Food And Beverage Metal Cans Revenue million Forecast, by Country 2020 & 2033
- Table 24: Global Food And Beverage Metal Cans Volume K Forecast, by Country 2020 & 2033
- Table 25: Brazil Food And Beverage Metal Cans Revenue (million) Forecast, by Application 2020 & 2033
- Table 26: Brazil Food And Beverage Metal Cans Volume (K) Forecast, by Application 2020 & 2033
- Table 27: Argentina Food And Beverage Metal Cans Revenue (million) Forecast, by Application 2020 & 2033
- Table 28: Argentina Food And Beverage Metal Cans Volume (K) Forecast, by Application 2020 & 2033
- Table 29: Rest of South America Food And Beverage Metal Cans Revenue (million) Forecast, by Application 2020 & 2033
- Table 30: Rest of South America Food And Beverage Metal Cans Volume (K) Forecast, by Application 2020 & 2033
- Table 31: Global Food And Beverage Metal Cans Revenue million Forecast, by Application 2020 & 2033
- Table 32: Global Food And Beverage Metal Cans Volume K Forecast, by Application 2020 & 2033
- Table 33: Global Food And Beverage Metal Cans Revenue million Forecast, by Type 2020 & 2033
- Table 34: Global Food And Beverage Metal Cans Volume K Forecast, by Type 2020 & 2033
- Table 35: Global Food And Beverage Metal Cans Revenue million Forecast, by Country 2020 & 2033
- Table 36: Global Food And Beverage Metal Cans Volume K Forecast, by Country 2020 & 2033
- Table 37: United Kingdom Food And Beverage Metal Cans Revenue (million) Forecast, by Application 2020 & 2033
- Table 38: United Kingdom Food And Beverage Metal Cans Volume (K) Forecast, by Application 2020 & 2033
- Table 39: Germany Food And Beverage Metal Cans Revenue (million) Forecast, by Application 2020 & 2033
- Table 40: Germany Food And Beverage Metal Cans Volume (K) Forecast, by Application 2020 & 2033
- Table 41: France Food And Beverage Metal Cans Revenue (million) Forecast, by Application 2020 & 2033
- Table 42: France Food And Beverage Metal Cans Volume (K) Forecast, by Application 2020 & 2033
- Table 43: Italy Food And Beverage Metal Cans Revenue (million) Forecast, by Application 2020 & 2033
- Table 44: Italy Food And Beverage Metal Cans Volume (K) Forecast, by Application 2020 & 2033
- Table 45: Spain Food And Beverage Metal Cans Revenue (million) Forecast, by Application 2020 & 2033
- Table 46: Spain Food And Beverage Metal Cans Volume (K) Forecast, by Application 2020 & 2033
- Table 47: Russia Food And Beverage Metal Cans Revenue (million) Forecast, by Application 2020 & 2033
- Table 48: Russia Food And Beverage Metal Cans Volume (K) Forecast, by Application 2020 & 2033
- Table 49: Benelux Food And Beverage Metal Cans Revenue (million) Forecast, by Application 2020 & 2033
- Table 50: Benelux Food And Beverage Metal Cans Volume (K) Forecast, by Application 2020 & 2033
- Table 51: Nordics Food And Beverage Metal Cans Revenue (million) Forecast, by Application 2020 & 2033
- Table 52: Nordics Food And Beverage Metal Cans Volume (K) Forecast, by Application 2020 & 2033
- Table 53: Rest of Europe Food And Beverage Metal Cans Revenue (million) Forecast, by Application 2020 & 2033
- Table 54: Rest of Europe Food And Beverage Metal Cans Volume (K) Forecast, by Application 2020 & 2033
- Table 55: Global Food And Beverage Metal Cans Revenue million Forecast, by Application 2020 & 2033
- Table 56: Global Food And Beverage Metal Cans Volume K Forecast, by Application 2020 & 2033
- Table 57: Global Food And Beverage Metal Cans Revenue million Forecast, by Type 2020 & 2033
- Table 58: Global Food And Beverage Metal Cans Volume K Forecast, by Type 2020 & 2033
- Table 59: Global Food And Beverage Metal Cans Revenue million Forecast, by Country 2020 & 2033
- Table 60: Global Food And Beverage Metal Cans Volume K Forecast, by Country 2020 & 2033
- Table 61: Turkey Food And Beverage Metal Cans Revenue (million) Forecast, by Application 2020 & 2033
- Table 62: Turkey Food And Beverage Metal Cans Volume (K) Forecast, by Application 2020 & 2033
- Table 63: Israel Food And Beverage Metal Cans Revenue (million) Forecast, by Application 2020 & 2033
- Table 64: Israel Food And Beverage Metal Cans Volume (K) Forecast, by Application 2020 & 2033
- Table 65: GCC Food And Beverage Metal Cans Revenue (million) Forecast, by Application 2020 & 2033
- Table 66: GCC Food And Beverage Metal Cans Volume (K) Forecast, by Application 2020 & 2033
- Table 67: North Africa Food And Beverage Metal Cans Revenue (million) Forecast, by Application 2020 & 2033
- Table 68: North Africa Food And Beverage Metal Cans Volume (K) Forecast, by Application 2020 & 2033
- Table 69: South Africa Food And Beverage Metal Cans Revenue (million) Forecast, by Application 2020 & 2033
- Table 70: South Africa Food And Beverage Metal Cans Volume (K) Forecast, by Application 2020 & 2033
- Table 71: Rest of Middle East & Africa Food And Beverage Metal Cans Revenue (million) Forecast, by Application 2020 & 2033
- Table 72: Rest of Middle East & Africa Food And Beverage Metal Cans Volume (K) Forecast, by Application 2020 & 2033
- Table 73: Global Food And Beverage Metal Cans Revenue million Forecast, by Application 2020 & 2033
- Table 74: Global Food And Beverage Metal Cans Volume K Forecast, by Application 2020 & 2033
- Table 75: Global Food And Beverage Metal Cans Revenue million Forecast, by Type 2020 & 2033
- Table 76: Global Food And Beverage Metal Cans Volume K Forecast, by Type 2020 & 2033
- Table 77: Global Food And Beverage Metal Cans Revenue million Forecast, by Country 2020 & 2033
- Table 78: Global Food And Beverage Metal Cans Volume K Forecast, by Country 2020 & 2033
- Table 79: China Food And Beverage Metal Cans Revenue (million) Forecast, by Application 2020 & 2033
- Table 80: China Food And Beverage Metal Cans Volume (K) Forecast, by Application 2020 & 2033
- Table 81: India Food And Beverage Metal Cans Revenue (million) Forecast, by Application 2020 & 2033
- Table 82: India Food And Beverage Metal Cans Volume (K) Forecast, by Application 2020 & 2033
- Table 83: Japan Food And Beverage Metal Cans Revenue (million) Forecast, by Application 2020 & 2033
- Table 84: Japan Food And Beverage Metal Cans Volume (K) Forecast, by Application 2020 & 2033
- Table 85: South Korea Food And Beverage Metal Cans Revenue (million) Forecast, by Application 2020 & 2033
- Table 86: South Korea Food And Beverage Metal Cans Volume (K) Forecast, by Application 2020 & 2033
- Table 87: ASEAN Food And Beverage Metal Cans Revenue (million) Forecast, by Application 2020 & 2033
- Table 88: ASEAN Food And Beverage Metal Cans Volume (K) Forecast, by Application 2020 & 2033
- Table 89: Oceania Food And Beverage Metal Cans Revenue (million) Forecast, by Application 2020 & 2033
- Table 90: Oceania Food And Beverage Metal Cans Volume (K) Forecast, by Application 2020 & 2033
- Table 91: Rest of Asia Pacific Food And Beverage Metal Cans Revenue (million) Forecast, by Application 2020 & 2033
- Table 92: Rest of Asia Pacific Food And Beverage Metal Cans Volume (K) Forecast, by Application 2020 & 2033
Frequently Asked Questions
1. What is the projected Compound Annual Growth Rate (CAGR) of the Food And Beverage Metal Cans?
The projected CAGR is approximately 3%.
2. Which companies are prominent players in the Food And Beverage Metal Cans?
Key companies in the market include Ball Corporation, Crown Holdings, Ardagh group, Toyo Seikan, Silgan Holdings Inc, Can Pack Group, Daiwa Can Company, ORG Technology, CPMC Holdings, Hokkan Holdings, Baosteel Packaging, Showa Aluminum Can Corporation, ShengXing Group.
3. What are the main segments of the Food And Beverage Metal Cans?
The market segments include Application, Type.
4. Can you provide details about the market size?
The market size is estimated to be USD 64160 million as of 2022.
5. What are some drivers contributing to market growth?
N/A
6. What are the notable trends driving market growth?
N/A
7. Are there any restraints impacting market growth?
N/A
8. Can you provide examples of recent developments in the market?
N/A
9. What pricing options are available for accessing the report?
Pricing options include single-user, multi-user, and enterprise licenses priced at USD 3950.00, USD 5925.00, and USD 7900.00 respectively.
10. Is the market size provided in terms of value or volume?
The market size is provided in terms of value, measured in million and volume, measured in K.
11. Are there any specific market keywords associated with the report?
Yes, the market keyword associated with the report is "Food And Beverage Metal Cans," which aids in identifying and referencing the specific market segment covered.
12. How do I determine which pricing option suits my needs best?
The pricing options vary based on user requirements and access needs. Individual users may opt for single-user licenses, while businesses requiring broader access may choose multi-user or enterprise licenses for cost-effective access to the report.
13. Are there any additional resources or data provided in the Food And Beverage Metal Cans report?
While the report offers comprehensive insights, it's advisable to review the specific contents or supplementary materials provided to ascertain if additional resources or data are available.
14. How can I stay updated on further developments or reports in the Food And Beverage Metal Cans?
To stay informed about further developments, trends, and reports in the Food And Beverage Metal Cans, consider subscribing to industry newsletters, following relevant companies and organizations, or regularly checking reputable industry news sources and publications.
Methodology
Step 1 - Identification of Relevant Samples Size from Population Database


Step 2 - Approaches for Defining Global Market Size (Value, Volume* & Price*)

Note*: In applicable scenarios
Step 3 - Data Sources
Primary Research
- Web Analytics
- Survey Reports
- Research Institute
- Latest Research Reports
- Opinion Leaders
Secondary Research
- Annual Reports
- White Paper
- Latest Press Release
- Industry Association
- Paid Database
- Investor Presentations

Step 4 - Data Triangulation
Involves using different sources of information in order to increase the validity of a study
These sources are likely to be stakeholders in a program - participants, other researchers, program staff, other community members, and so on.
Then we put all data in single framework & apply various statistical tools to find out the dynamic on the market.
During the analysis stage, feedback from the stakeholder groups would be compared to determine areas of agreement as well as areas of divergence