

Key Insights
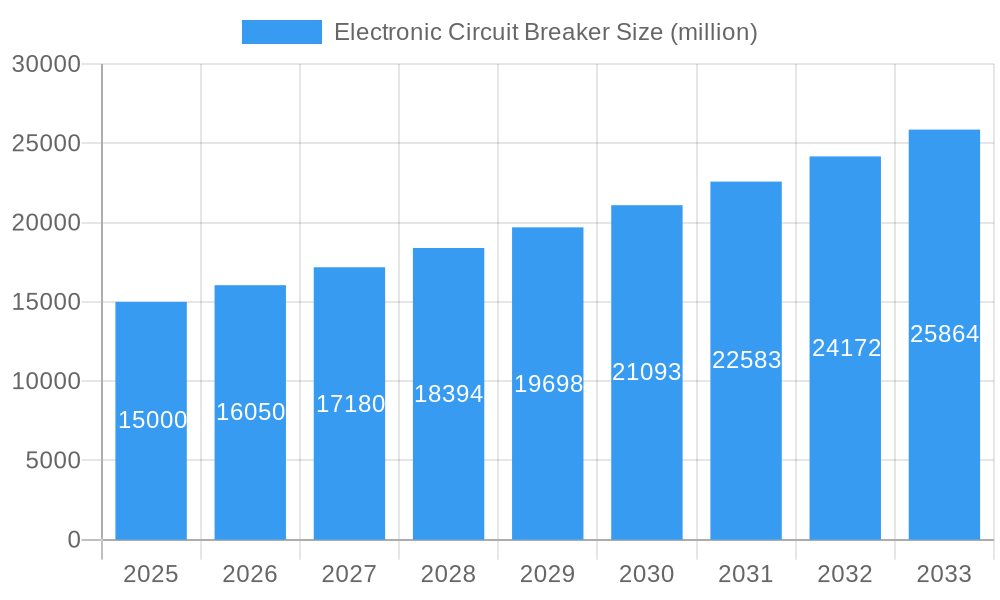
The global electronic circuit breaker market is experiencing robust growth, driven by the increasing demand for enhanced safety and reliability in electrical systems across various sectors. The market, estimated at $15 billion in 2025, is projected to maintain a healthy Compound Annual Growth Rate (CAGR) of 7% from 2025 to 2033, reaching approximately $25 billion by 2033. This expansion is fueled by several key factors, including the rising adoption of smart grids and renewable energy sources, which necessitate sophisticated circuit protection solutions. Furthermore, stringent safety regulations and the growing awareness of energy efficiency are contributing significantly to market growth. The industrial sector currently holds the largest market share, followed by the residential and transportation sectors. Technological advancements in circuit breaker design, such as the integration of advanced monitoring capabilities and improved arc-fault protection, are further stimulating market expansion. The 220V segment dominates the types segment, owing to its widespread use in residential and small commercial applications. Key players, including ABB, Schneider Electric, Eaton, and Siemens, are investing heavily in research and development, leading to innovative product launches and increased market competition. Geographical expansion is also a key driver, with significant growth potential in developing economies of Asia-Pacific, driven by infrastructure development and rising urbanization.
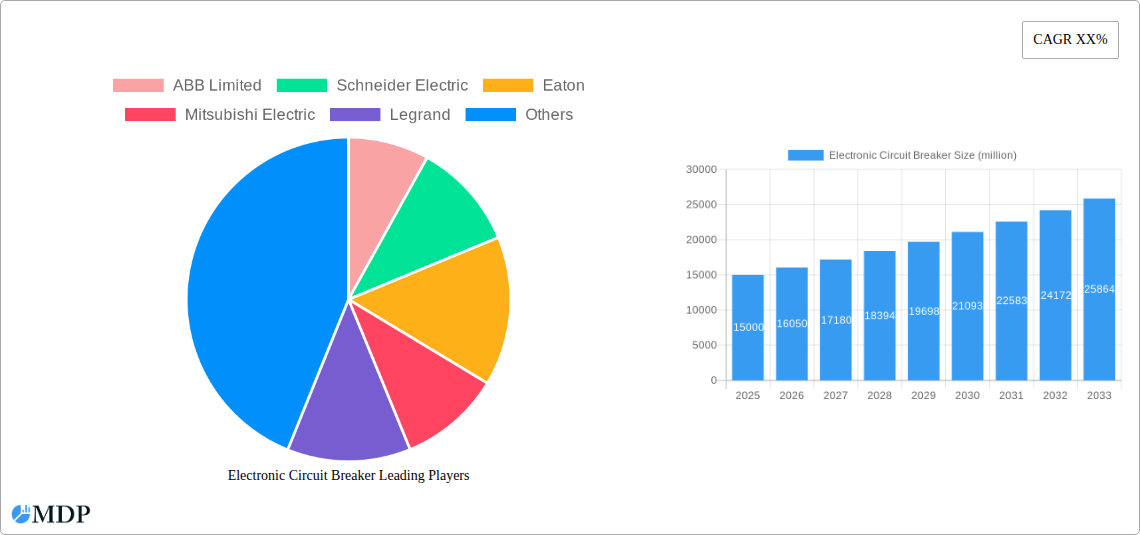
Electronic Circuit Breaker Market Size (In Billion)
However, certain challenges persist. The high initial investment cost associated with advanced electronic circuit breakers can act as a restraint, particularly in price-sensitive markets. Furthermore, the complexities involved in installation and maintenance can hinder wider adoption. Nevertheless, the long-term benefits, including enhanced safety, reliability, and energy efficiency, are expected to outweigh these challenges, ensuring continued market growth. The competitive landscape is characterized by both established multinational corporations and regional players, fostering innovation and driving down costs. Future growth will likely be driven by the increasing integration of electronic circuit breakers into smart homes and buildings, industrial automation systems, and electric vehicle charging infrastructure. The market segmentation by application and voltage type is expected to remain a key factor influencing market dynamics in the coming years.
Electronic Circuit Breaker Company Market Share
Electronic Circuit Breaker Market Report: A Comprehensive Analysis (2019-2033)
This comprehensive report provides an in-depth analysis of the global electronic circuit breaker market, projecting a market value exceeding $XX million by 2033. The study covers the period 2019-2033, with a base year of 2025 and a forecast period of 2025-2033. It offers actionable insights for industry stakeholders, including manufacturers, investors, and regulatory bodies, focusing on market dynamics, leading players, and future growth potential. The report leverages extensive data analysis to provide a clear understanding of market trends, segment performance, and key drivers influencing the $XX million market.
Electronic Circuit Breaker Market Dynamics & Concentration
The global electronic circuit breaker market exhibits a moderately concentrated landscape, with key players like ABB Limited, Schneider Electric, Eaton, and Siemens holding significant market share. The market concentration ratio (CR4) is estimated at approximately XX%, indicating a competitive but consolidated industry structure. Innovation drivers include advancements in semiconductor technology, miniaturization trends, and the increasing demand for smart grid solutions. Stringent safety regulations and energy efficiency standards across various regions contribute significantly to the market dynamics. Product substitutes, such as fuses and other protective devices, pose limited competition, but their lower cost can affect certain market segments. End-user trends indicate a preference for high-reliability, intelligent circuit breakers, particularly in industrial and transportation sectors. M&A activity has been moderate in recent years, with approximately XX major deals recorded between 2019 and 2024.
- Market Share (Estimated 2025): ABB Limited (XX%), Schneider Electric (XX%), Eaton (XX%), Siemens (XX%), Others (XX%).
- M&A Deal Count (2019-2024): XX
- Key Innovation Drivers: Semiconductor advancements, smart grid technologies, miniaturization.
- Regulatory Influences: Stringent safety and energy efficiency standards.
Electronic Circuit Breaker Industry Trends & Analysis
The electronic circuit breaker market is experiencing robust growth, driven primarily by increasing urbanization, industrial automation, and the expanding renewable energy sector. The market's compound annual growth rate (CAGR) is projected at XX% during the forecast period (2025-2033). Technological disruptions, including the integration of IoT and digital technologies, are revolutionizing circuit breaker design and functionality, leading to increased energy efficiency and remote monitoring capabilities. Consumer preferences are shifting towards smart, energy-efficient, and reliable solutions, further stimulating market demand. Competitive dynamics are characterized by product differentiation, technological innovation, and strategic partnerships, with major players focusing on expanding their product portfolio and geographical reach. Market penetration of electronic circuit breakers is projected to increase from XX% in 2025 to approximately XX% by 2033, particularly in emerging economies.
Leading Markets & Segments in Electronic Circuit Breaker
The industrial segment dominates the electronic circuit breaker market, accounting for approximately XX% of global revenue in 2025. This is followed by the residential and transportation segments, each holding significant market share. Within voltage types, 220V and 380V circuit breakers are the most prevalent.
- Dominant Segment: Industrial applications (XX% market share in 2025)
- Key Drivers for Industrial Segment: Growing industrial automation, robust infrastructure development, increased demand for energy-efficient solutions.
- Key Drivers for Residential Segment: Rising construction activities, increased demand for smart home technologies.
- Key Drivers for Transport Segment: Expanding electric vehicle adoption, development of smart transportation systems.
- Dominant Voltage Type: 220V and 380V.
The Asia-Pacific region is expected to be the fastest-growing market, propelled by robust economic growth and significant infrastructure investments in countries like China and India. Europe and North America maintain significant market shares due to established industrial bases and high adoption rates of advanced technologies.
Electronic Circuit Breaker Product Developments
Recent product innovations include the integration of advanced sensors, communication modules, and intelligent algorithms to enhance monitoring, diagnostics, and control capabilities. These advancements improve operational efficiency, reduce downtime, and enhance overall safety. The focus is on developing compact, lightweight, and energy-efficient circuit breakers to meet diverse application needs and address environmental concerns. Competitive advantages stem from superior technological features, robust performance, and reliable customer support.
Key Drivers of Electronic Circuit Breaker Growth
Key growth drivers include the increasing adoption of smart grid technologies, the rising demand for renewable energy solutions, the growing need for industrial automation, and stringent safety regulations. Government initiatives promoting energy efficiency and sustainable development further fuel market expansion. The technological advancements like IoT integration and the improvement in semiconductor technology are also driving the growth of electronic circuit breakers.
Challenges in the Electronic Circuit Breaker Market
Challenges include fluctuating raw material prices, supply chain disruptions, and intense competition from established players and new entrants. Regulatory hurdles and compliance requirements in different regions add complexity to market operations. These factors can impact production costs and market profitability, necessitating agile strategies and diversification efforts from market participants. The global economic slowdown might further impact demand in certain segments.
Emerging Opportunities in Electronic Circuit Breaker
Emerging opportunities lie in the increasing adoption of electric vehicles, the growth of smart homes, and the expansion of renewable energy infrastructure. Strategic partnerships and collaborations are crucial for accessing new markets and technologies. The development of innovative products with enhanced functionality and energy efficiency holds significant potential for capturing market share. Expansion into emerging markets offers considerable growth potential for companies in this sector.
Leading Players in the Electronic Circuit Breaker Sector
- ABB Limited
- Schneider Electric
- Eaton
- Mitsubishi Electric
- Legrand
- Siemens
- DELIXI
- Nader
- Fuji Electric
- Hitachi
- Shanghai Renmin
- Hager
- Changshu Switchgear
- Toshiba
- Hyundai
- Mersen SA
Key Milestones in Electronic Circuit Breaker Industry
- 2020: Introduction of next-generation smart circuit breakers with advanced communication protocols by ABB Limited.
- 2021: Schneider Electric acquires a smaller circuit breaker manufacturer, expanding its market presence.
- 2022: Significant investments in R&D for miniaturized and energy-efficient circuit breakers by several key players.
- 2023: Launch of new industry standards for electronic circuit breakers focusing on safety and performance.
- 2024: Increased adoption of IoT-enabled circuit breakers in smart building projects.
Strategic Outlook for Electronic Circuit Breaker Market
The future of the electronic circuit breaker market is bright, fueled by technological advancements, growing demand from various end-use sectors, and supportive government policies. Strategic partnerships, technological innovations, and expansion into emerging markets will be critical for companies to capture substantial market share. Focusing on developing sustainable and energy-efficient solutions will also be crucial for long-term success in this dynamic market. The global market is expected to experience sustained growth throughout the forecast period, presenting ample opportunities for both established players and new entrants.
Electronic Circuit Breaker Segmentation
-
1. Application
- 1.1. Industry
- 1.2. Residential
- 1.3. Transport
- 1.4. Others
-
2. Types
- 2.1. 220V
- 2.2. 250V
- 2.3. 380V
- 2.4. Other
Electronic Circuit Breaker Segmentation By Geography
-
1. North America
- 1.1. United States
- 1.2. Canada
- 1.3. Mexico
-
2. South America
- 2.1. Brazil
- 2.2. Argentina
- 2.3. Rest of South America
-
3. Europe
- 3.1. United Kingdom
- 3.2. Germany
- 3.3. France
- 3.4. Italy
- 3.5. Spain
- 3.6. Russia
- 3.7. Benelux
- 3.8. Nordics
- 3.9. Rest of Europe
-
4. Middle East & Africa
- 4.1. Turkey
- 4.2. Israel
- 4.3. GCC
- 4.4. North Africa
- 4.5. South Africa
- 4.6. Rest of Middle East & Africa
-
5. Asia Pacific
- 5.1. China
- 5.2. India
- 5.3. Japan
- 5.4. South Korea
- 5.5. ASEAN
- 5.6. Oceania
- 5.7. Rest of Asia Pacific
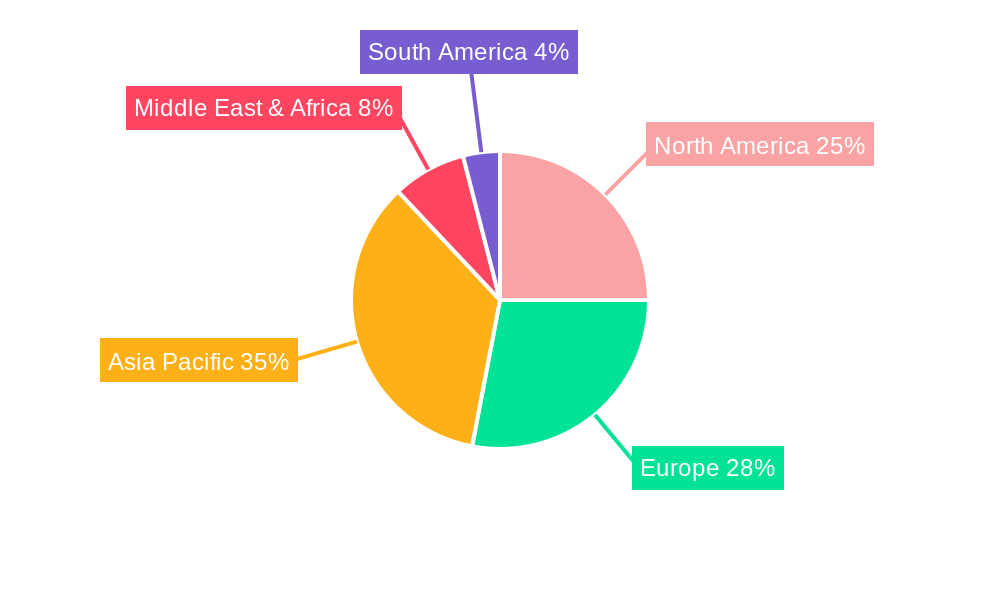
Electronic Circuit Breaker Regional Market Share
Geographic Coverage of Electronic Circuit Breaker
Electronic Circuit Breaker REPORT HIGHLIGHTS
| Aspects | Details |
|---|---|
| Study Period | 2020-2034 |
| Base Year | 2025 |
| Estimated Year | 2026 |
| Forecast Period | 2026-2034 |
| Historical Period | 2020-2025 |
| Growth Rate | CAGR of XX% from 2020-2034 |
| Segmentation |
|
Table of Contents
- 1. Introduction
- 1.1. Research Scope
- 1.2. Market Segmentation
- 1.3. Research Methodology
- 1.4. Definitions and Assumptions
- 2. Executive Summary
- 2.1. Introduction
- 3. Market Dynamics
- 3.1. Introduction
- 3.2. Market Drivers
- 3.3. Market Restrains
- 3.4. Market Trends
- 4. Market Factor Analysis
- 4.1. Porters Five Forces
- 4.2. Supply/Value Chain
- 4.3. PESTEL analysis
- 4.4. Market Entropy
- 4.5. Patent/Trademark Analysis
- 5. Global Electronic Circuit Breaker Analysis, Insights and Forecast, 2020-2032
- 5.1. Market Analysis, Insights and Forecast - by Application
- 5.1.1. Industry
- 5.1.2. Residential
- 5.1.3. Transport
- 5.1.4. Others
- 5.2. Market Analysis, Insights and Forecast - by Types
- 5.2.1. 220V
- 5.2.2. 250V
- 5.2.3. 380V
- 5.2.4. Other
- 5.3. Market Analysis, Insights and Forecast - by Region
- 5.3.1. North America
- 5.3.2. South America
- 5.3.3. Europe
- 5.3.4. Middle East & Africa
- 5.3.5. Asia Pacific
- 5.1. Market Analysis, Insights and Forecast - by Application
- 6. North America Electronic Circuit Breaker Analysis, Insights and Forecast, 2020-2032
- 6.1. Market Analysis, Insights and Forecast - by Application
- 6.1.1. Industry
- 6.1.2. Residential
- 6.1.3. Transport
- 6.1.4. Others
- 6.2. Market Analysis, Insights and Forecast - by Types
- 6.2.1. 220V
- 6.2.2. 250V
- 6.2.3. 380V
- 6.2.4. Other
- 6.1. Market Analysis, Insights and Forecast - by Application
- 7. South America Electronic Circuit Breaker Analysis, Insights and Forecast, 2020-2032
- 7.1. Market Analysis, Insights and Forecast - by Application
- 7.1.1. Industry
- 7.1.2. Residential
- 7.1.3. Transport
- 7.1.4. Others
- 7.2. Market Analysis, Insights and Forecast - by Types
- 7.2.1. 220V
- 7.2.2. 250V
- 7.2.3. 380V
- 7.2.4. Other
- 7.1. Market Analysis, Insights and Forecast - by Application
- 8. Europe Electronic Circuit Breaker Analysis, Insights and Forecast, 2020-2032
- 8.1. Market Analysis, Insights and Forecast - by Application
- 8.1.1. Industry
- 8.1.2. Residential
- 8.1.3. Transport
- 8.1.4. Others
- 8.2. Market Analysis, Insights and Forecast - by Types
- 8.2.1. 220V
- 8.2.2. 250V
- 8.2.3. 380V
- 8.2.4. Other
- 8.1. Market Analysis, Insights and Forecast - by Application
- 9. Middle East & Africa Electronic Circuit Breaker Analysis, Insights and Forecast, 2020-2032
- 9.1. Market Analysis, Insights and Forecast - by Application
- 9.1.1. Industry
- 9.1.2. Residential
- 9.1.3. Transport
- 9.1.4. Others
- 9.2. Market Analysis, Insights and Forecast - by Types
- 9.2.1. 220V
- 9.2.2. 250V
- 9.2.3. 380V
- 9.2.4. Other
- 9.1. Market Analysis, Insights and Forecast - by Application
- 10. Asia Pacific Electronic Circuit Breaker Analysis, Insights and Forecast, 2020-2032
- 10.1. Market Analysis, Insights and Forecast - by Application
- 10.1.1. Industry
- 10.1.2. Residential
- 10.1.3. Transport
- 10.1.4. Others
- 10.2. Market Analysis, Insights and Forecast - by Types
- 10.2.1. 220V
- 10.2.2. 250V
- 10.2.3. 380V
- 10.2.4. Other
- 10.1. Market Analysis, Insights and Forecast - by Application
- 11. Competitive Analysis
- 11.1. Global Market Share Analysis 2025
- 11.2. Company Profiles
- 11.2.1 ABB Limited
- 11.2.1.1. Overview
- 11.2.1.2. Products
- 11.2.1.3. SWOT Analysis
- 11.2.1.4. Recent Developments
- 11.2.1.5. Financials (Based on Availability)
- 11.2.2 Schneider Electric
- 11.2.2.1. Overview
- 11.2.2.2. Products
- 11.2.2.3. SWOT Analysis
- 11.2.2.4. Recent Developments
- 11.2.2.5. Financials (Based on Availability)
- 11.2.3 Eaton
- 11.2.3.1. Overview
- 11.2.3.2. Products
- 11.2.3.3. SWOT Analysis
- 11.2.3.4. Recent Developments
- 11.2.3.5. Financials (Based on Availability)
- 11.2.4 Mitsubishi Electric
- 11.2.4.1. Overview
- 11.2.4.2. Products
- 11.2.4.3. SWOT Analysis
- 11.2.4.4. Recent Developments
- 11.2.4.5. Financials (Based on Availability)
- 11.2.5 Legrand
- 11.2.5.1. Overview
- 11.2.5.2. Products
- 11.2.5.3. SWOT Analysis
- 11.2.5.4. Recent Developments
- 11.2.5.5. Financials (Based on Availability)
- 11.2.6 Siemens
- 11.2.6.1. Overview
- 11.2.6.2. Products
- 11.2.6.3. SWOT Analysis
- 11.2.6.4. Recent Developments
- 11.2.6.5. Financials (Based on Availability)
- 11.2.7 DELIXI
- 11.2.7.1. Overview
- 11.2.7.2. Products
- 11.2.7.3. SWOT Analysis
- 11.2.7.4. Recent Developments
- 11.2.7.5. Financials (Based on Availability)
- 11.2.8 Nader
- 11.2.8.1. Overview
- 11.2.8.2. Products
- 11.2.8.3. SWOT Analysis
- 11.2.8.4. Recent Developments
- 11.2.8.5. Financials (Based on Availability)
- 11.2.9 Fuji Electric
- 11.2.9.1. Overview
- 11.2.9.2. Products
- 11.2.9.3. SWOT Analysis
- 11.2.9.4. Recent Developments
- 11.2.9.5. Financials (Based on Availability)
- 11.2.10 Hitachi
- 11.2.10.1. Overview
- 11.2.10.2. Products
- 11.2.10.3. SWOT Analysis
- 11.2.10.4. Recent Developments
- 11.2.10.5. Financials (Based on Availability)
- 11.2.11 Shanghai Renmin
- 11.2.11.1. Overview
- 11.2.11.2. Products
- 11.2.11.3. SWOT Analysis
- 11.2.11.4. Recent Developments
- 11.2.11.5. Financials (Based on Availability)
- 11.2.12 Hager
- 11.2.12.1. Overview
- 11.2.12.2. Products
- 11.2.12.3. SWOT Analysis
- 11.2.12.4. Recent Developments
- 11.2.12.5. Financials (Based on Availability)
- 11.2.13 Changshu Switchgear
- 11.2.13.1. Overview
- 11.2.13.2. Products
- 11.2.13.3. SWOT Analysis
- 11.2.13.4. Recent Developments
- 11.2.13.5. Financials (Based on Availability)
- 11.2.14 Toshiba
- 11.2.14.1. Overview
- 11.2.14.2. Products
- 11.2.14.3. SWOT Analysis
- 11.2.14.4. Recent Developments
- 11.2.14.5. Financials (Based on Availability)
- 11.2.15 Hyundai
- 11.2.15.1. Overview
- 11.2.15.2. Products
- 11.2.15.3. SWOT Analysis
- 11.2.15.4. Recent Developments
- 11.2.15.5. Financials (Based on Availability)
- 11.2.16 Mersen SA
- 11.2.16.1. Overview
- 11.2.16.2. Products
- 11.2.16.3. SWOT Analysis
- 11.2.16.4. Recent Developments
- 11.2.16.5. Financials (Based on Availability)
- 11.2.1 ABB Limited
List of Figures
- Figure 1: Global Electronic Circuit Breaker Revenue Breakdown (million, %) by Region 2025 & 2033
- Figure 2: North America Electronic Circuit Breaker Revenue (million), by Application 2025 & 2033
- Figure 3: North America Electronic Circuit Breaker Revenue Share (%), by Application 2025 & 2033
- Figure 4: North America Electronic Circuit Breaker Revenue (million), by Types 2025 & 2033
- Figure 5: North America Electronic Circuit Breaker Revenue Share (%), by Types 2025 & 2033
- Figure 6: North America Electronic Circuit Breaker Revenue (million), by Country 2025 & 2033
- Figure 7: North America Electronic Circuit Breaker Revenue Share (%), by Country 2025 & 2033
- Figure 8: South America Electronic Circuit Breaker Revenue (million), by Application 2025 & 2033
- Figure 9: South America Electronic Circuit Breaker Revenue Share (%), by Application 2025 & 2033
- Figure 10: South America Electronic Circuit Breaker Revenue (million), by Types 2025 & 2033
- Figure 11: South America Electronic Circuit Breaker Revenue Share (%), by Types 2025 & 2033
- Figure 12: South America Electronic Circuit Breaker Revenue (million), by Country 2025 & 2033
- Figure 13: South America Electronic Circuit Breaker Revenue Share (%), by Country 2025 & 2033
- Figure 14: Europe Electronic Circuit Breaker Revenue (million), by Application 2025 & 2033
- Figure 15: Europe Electronic Circuit Breaker Revenue Share (%), by Application 2025 & 2033
- Figure 16: Europe Electronic Circuit Breaker Revenue (million), by Types 2025 & 2033
- Figure 17: Europe Electronic Circuit Breaker Revenue Share (%), by Types 2025 & 2033
- Figure 18: Europe Electronic Circuit Breaker Revenue (million), by Country 2025 & 2033
- Figure 19: Europe Electronic Circuit Breaker Revenue Share (%), by Country 2025 & 2033
- Figure 20: Middle East & Africa Electronic Circuit Breaker Revenue (million), by Application 2025 & 2033
- Figure 21: Middle East & Africa Electronic Circuit Breaker Revenue Share (%), by Application 2025 & 2033
- Figure 22: Middle East & Africa Electronic Circuit Breaker Revenue (million), by Types 2025 & 2033
- Figure 23: Middle East & Africa Electronic Circuit Breaker Revenue Share (%), by Types 2025 & 2033
- Figure 24: Middle East & Africa Electronic Circuit Breaker Revenue (million), by Country 2025 & 2033
- Figure 25: Middle East & Africa Electronic Circuit Breaker Revenue Share (%), by Country 2025 & 2033
- Figure 26: Asia Pacific Electronic Circuit Breaker Revenue (million), by Application 2025 & 2033
- Figure 27: Asia Pacific Electronic Circuit Breaker Revenue Share (%), by Application 2025 & 2033
- Figure 28: Asia Pacific Electronic Circuit Breaker Revenue (million), by Types 2025 & 2033
- Figure 29: Asia Pacific Electronic Circuit Breaker Revenue Share (%), by Types 2025 & 2033
- Figure 30: Asia Pacific Electronic Circuit Breaker Revenue (million), by Country 2025 & 2033
- Figure 31: Asia Pacific Electronic Circuit Breaker Revenue Share (%), by Country 2025 & 2033
List of Tables
- Table 1: Global Electronic Circuit Breaker Revenue million Forecast, by Application 2020 & 2033
- Table 2: Global Electronic Circuit Breaker Revenue million Forecast, by Types 2020 & 2033
- Table 3: Global Electronic Circuit Breaker Revenue million Forecast, by Region 2020 & 2033
- Table 4: Global Electronic Circuit Breaker Revenue million Forecast, by Application 2020 & 2033
- Table 5: Global Electronic Circuit Breaker Revenue million Forecast, by Types 2020 & 2033
- Table 6: Global Electronic Circuit Breaker Revenue million Forecast, by Country 2020 & 2033
- Table 7: United States Electronic Circuit Breaker Revenue (million) Forecast, by Application 2020 & 2033
- Table 8: Canada Electronic Circuit Breaker Revenue (million) Forecast, by Application 2020 & 2033
- Table 9: Mexico Electronic Circuit Breaker Revenue (million) Forecast, by Application 2020 & 2033
- Table 10: Global Electronic Circuit Breaker Revenue million Forecast, by Application 2020 & 2033
- Table 11: Global Electronic Circuit Breaker Revenue million Forecast, by Types 2020 & 2033
- Table 12: Global Electronic Circuit Breaker Revenue million Forecast, by Country 2020 & 2033
- Table 13: Brazil Electronic Circuit Breaker Revenue (million) Forecast, by Application 2020 & 2033
- Table 14: Argentina Electronic Circuit Breaker Revenue (million) Forecast, by Application 2020 & 2033
- Table 15: Rest of South America Electronic Circuit Breaker Revenue (million) Forecast, by Application 2020 & 2033
- Table 16: Global Electronic Circuit Breaker Revenue million Forecast, by Application 2020 & 2033
- Table 17: Global Electronic Circuit Breaker Revenue million Forecast, by Types 2020 & 2033
- Table 18: Global Electronic Circuit Breaker Revenue million Forecast, by Country 2020 & 2033
- Table 19: United Kingdom Electronic Circuit Breaker Revenue (million) Forecast, by Application 2020 & 2033
- Table 20: Germany Electronic Circuit Breaker Revenue (million) Forecast, by Application 2020 & 2033
- Table 21: France Electronic Circuit Breaker Revenue (million) Forecast, by Application 2020 & 2033
- Table 22: Italy Electronic Circuit Breaker Revenue (million) Forecast, by Application 2020 & 2033
- Table 23: Spain Electronic Circuit Breaker Revenue (million) Forecast, by Application 2020 & 2033
- Table 24: Russia Electronic Circuit Breaker Revenue (million) Forecast, by Application 2020 & 2033
- Table 25: Benelux Electronic Circuit Breaker Revenue (million) Forecast, by Application 2020 & 2033
- Table 26: Nordics Electronic Circuit Breaker Revenue (million) Forecast, by Application 2020 & 2033
- Table 27: Rest of Europe Electronic Circuit Breaker Revenue (million) Forecast, by Application 2020 & 2033
- Table 28: Global Electronic Circuit Breaker Revenue million Forecast, by Application 2020 & 2033
- Table 29: Global Electronic Circuit Breaker Revenue million Forecast, by Types 2020 & 2033
- Table 30: Global Electronic Circuit Breaker Revenue million Forecast, by Country 2020 & 2033
- Table 31: Turkey Electronic Circuit Breaker Revenue (million) Forecast, by Application 2020 & 2033
- Table 32: Israel Electronic Circuit Breaker Revenue (million) Forecast, by Application 2020 & 2033
- Table 33: GCC Electronic Circuit Breaker Revenue (million) Forecast, by Application 2020 & 2033
- Table 34: North Africa Electronic Circuit Breaker Revenue (million) Forecast, by Application 2020 & 2033
- Table 35: South Africa Electronic Circuit Breaker Revenue (million) Forecast, by Application 2020 & 2033
- Table 36: Rest of Middle East & Africa Electronic Circuit Breaker Revenue (million) Forecast, by Application 2020 & 2033
- Table 37: Global Electronic Circuit Breaker Revenue million Forecast, by Application 2020 & 2033
- Table 38: Global Electronic Circuit Breaker Revenue million Forecast, by Types 2020 & 2033
- Table 39: Global Electronic Circuit Breaker Revenue million Forecast, by Country 2020 & 2033
- Table 40: China Electronic Circuit Breaker Revenue (million) Forecast, by Application 2020 & 2033
- Table 41: India Electronic Circuit Breaker Revenue (million) Forecast, by Application 2020 & 2033
- Table 42: Japan Electronic Circuit Breaker Revenue (million) Forecast, by Application 2020 & 2033
- Table 43: South Korea Electronic Circuit Breaker Revenue (million) Forecast, by Application 2020 & 2033
- Table 44: ASEAN Electronic Circuit Breaker Revenue (million) Forecast, by Application 2020 & 2033
- Table 45: Oceania Electronic Circuit Breaker Revenue (million) Forecast, by Application 2020 & 2033
- Table 46: Rest of Asia Pacific Electronic Circuit Breaker Revenue (million) Forecast, by Application 2020 & 2033
Frequently Asked Questions
1. What is the projected Compound Annual Growth Rate (CAGR) of the Electronic Circuit Breaker?
The projected CAGR is approximately XX%.
2. Which companies are prominent players in the Electronic Circuit Breaker?
Key companies in the market include ABB Limited, Schneider Electric, Eaton, Mitsubishi Electric, Legrand, Siemens, DELIXI, Nader, Fuji Electric, Hitachi, Shanghai Renmin, Hager, Changshu Switchgear, Toshiba, Hyundai, Mersen SA.
3. What are the main segments of the Electronic Circuit Breaker?
The market segments include Application, Types.
4. Can you provide details about the market size?
The market size is estimated to be USD XXX million as of 2022.
5. What are some drivers contributing to market growth?
N/A
6. What are the notable trends driving market growth?
N/A
7. Are there any restraints impacting market growth?
N/A
8. Can you provide examples of recent developments in the market?
N/A
9. What pricing options are available for accessing the report?
Pricing options include single-user, multi-user, and enterprise licenses priced at USD 2900.00, USD 4350.00, and USD 5800.00 respectively.
10. Is the market size provided in terms of value or volume?
The market size is provided in terms of value, measured in million.
11. Are there any specific market keywords associated with the report?
Yes, the market keyword associated with the report is "Electronic Circuit Breaker," which aids in identifying and referencing the specific market segment covered.
12. How do I determine which pricing option suits my needs best?
The pricing options vary based on user requirements and access needs. Individual users may opt for single-user licenses, while businesses requiring broader access may choose multi-user or enterprise licenses for cost-effective access to the report.
13. Are there any additional resources or data provided in the Electronic Circuit Breaker report?
While the report offers comprehensive insights, it's advisable to review the specific contents or supplementary materials provided to ascertain if additional resources or data are available.
14. How can I stay updated on further developments or reports in the Electronic Circuit Breaker?
To stay informed about further developments, trends, and reports in the Electronic Circuit Breaker, consider subscribing to industry newsletters, following relevant companies and organizations, or regularly checking reputable industry news sources and publications.
Methodology
Step 1 - Identification of Relevant Samples Size from Population Database


Step 2 - Approaches for Defining Global Market Size (Value, Volume* & Price*)

Note*: In applicable scenarios
Step 3 - Data Sources
Primary Research
- Web Analytics
- Survey Reports
- Research Institute
- Latest Research Reports
- Opinion Leaders
Secondary Research
- Annual Reports
- White Paper
- Latest Press Release
- Industry Association
- Paid Database
- Investor Presentations

Step 4 - Data Triangulation
Involves using different sources of information in order to increase the validity of a study
These sources are likely to be stakeholders in a program - participants, other researchers, program staff, other community members, and so on.
Then we put all data in single framework & apply various statistical tools to find out the dynamic on the market.
During the analysis stage, feedback from the stakeholder groups would be compared to determine areas of agreement as well as areas of divergence