

Key Insights
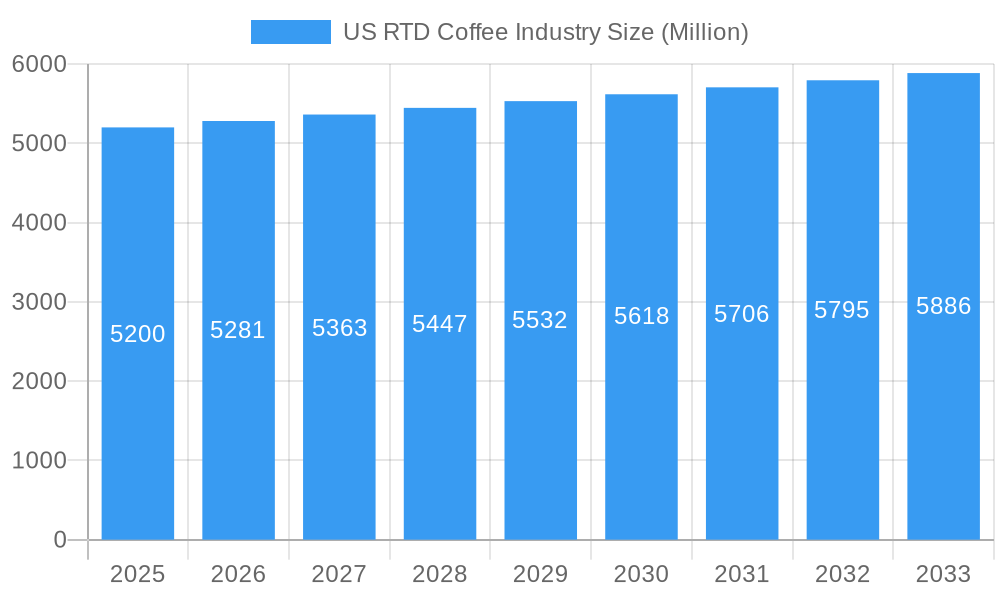
The US Ready-to-Drink (RTD) Coffee market, valued at $5.4 billion in 2025, is poised for sustained expansion. Key growth drivers include the rising demand for convenient, on-the-go beverage solutions, particularly among younger demographics like millennials and Gen Z. An expanding portfolio of RTD coffee varieties, encompassing cold brew, iced coffee, and innovative flavor profiles, effectively addresses evolving consumer preferences. Strategic alliances between major beverage corporations and emerging craft coffee brands are fostering product innovation and broader market reach. Market segmentation reveals opportunities in off-trade distribution channels, PET bottles as a leading packaging solution due to cost-effectiveness and recyclability, and the continued dominance of cold brew and iced coffee segments. The projected compound annual growth rate (CAGR) is 4.4%.
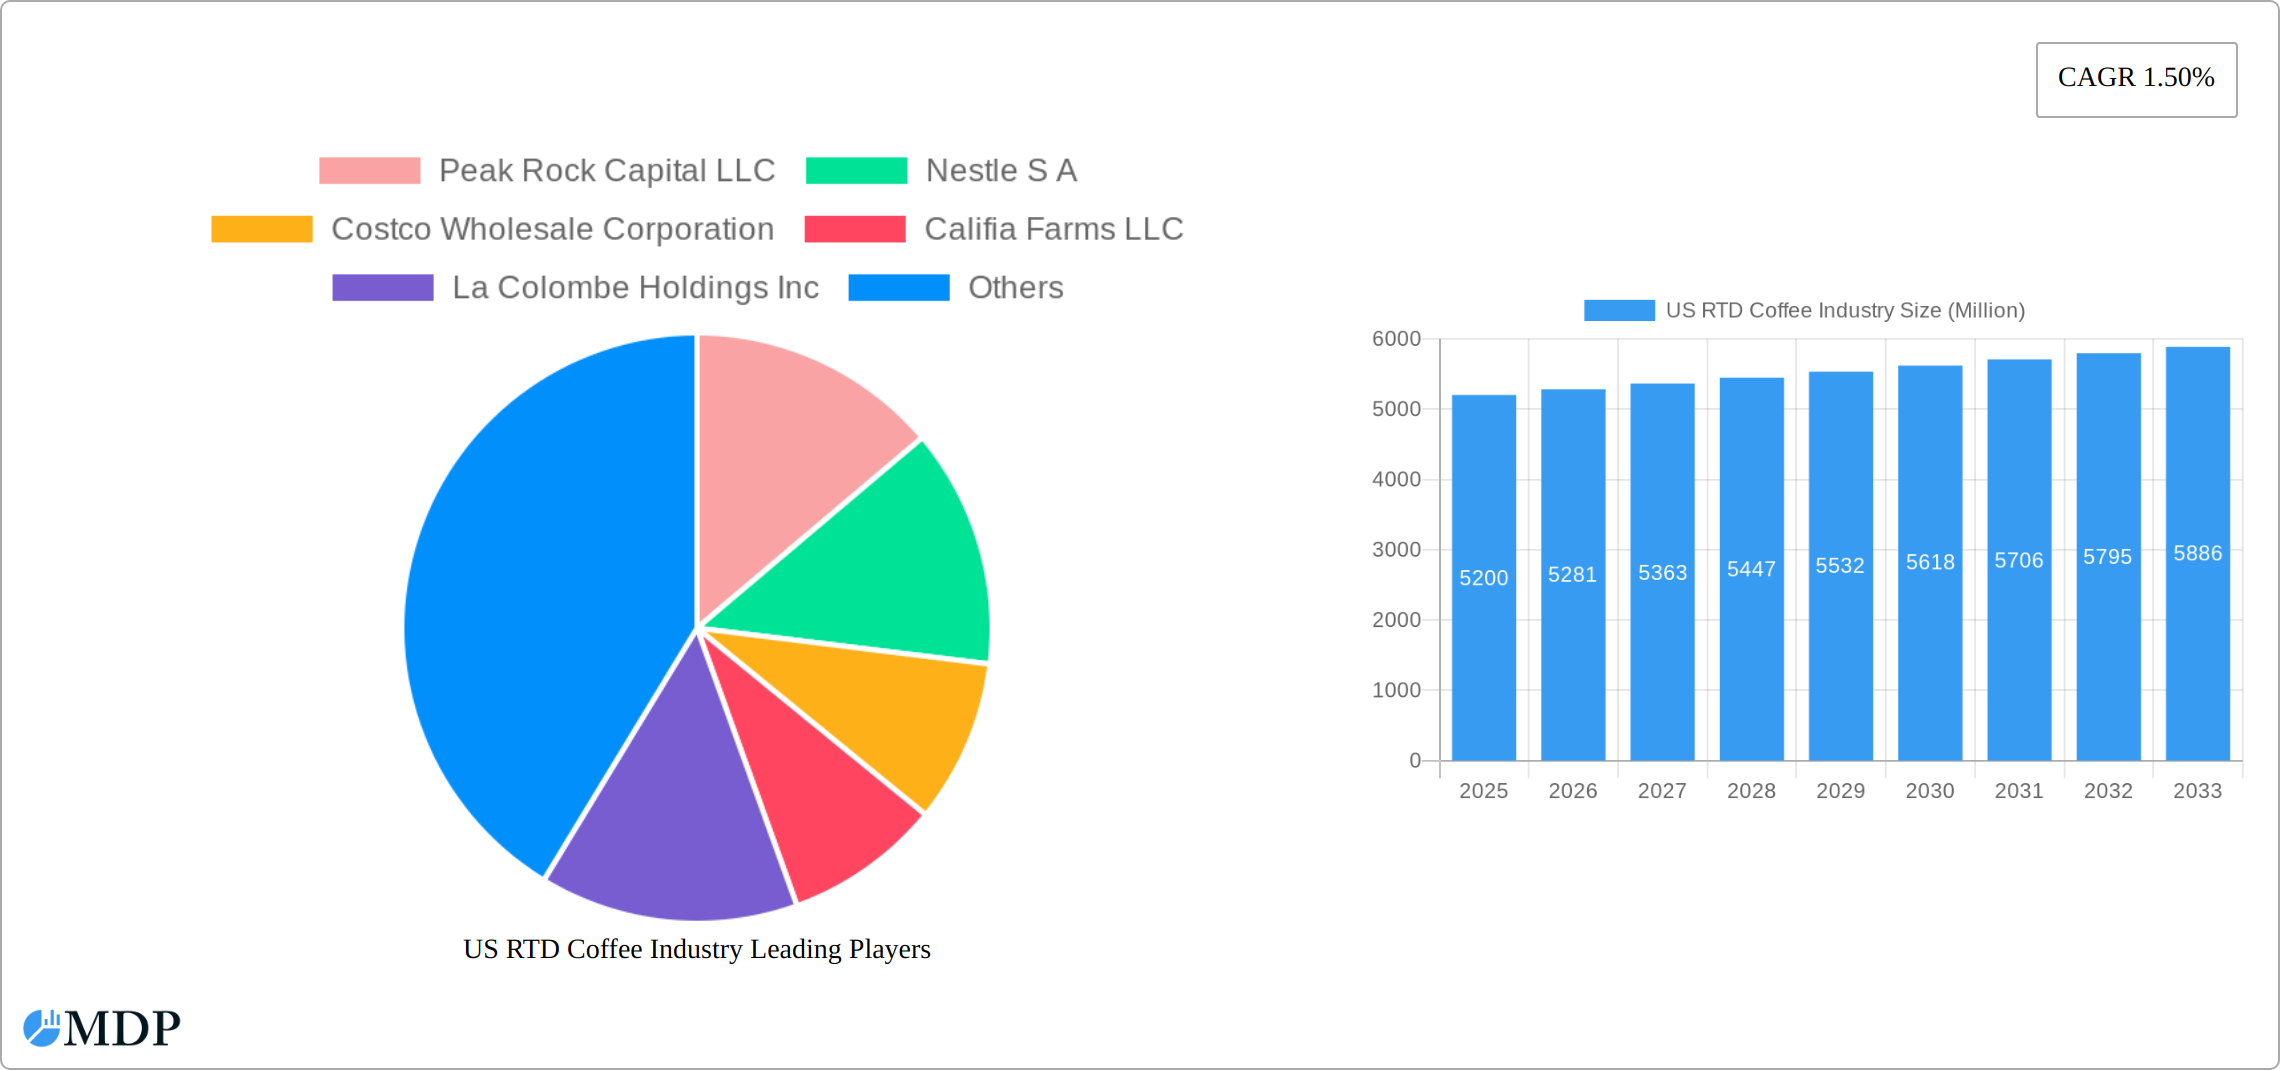
US RTD Coffee Industry Market Size (In Billion)
Despite robust growth potential, the market navigates challenges such as intense competition from established players and agile niche brands, leading to price pressures and the imperative for ongoing innovation. Fluctuations in raw material costs and rising input expenses impact profitability. Additionally, health-conscious consumers may limit growth unless healthier RTD coffee alternatives are prioritized. Nevertheless, the inherent convenience of RTD coffee and increasing consumer purchasing power are expected to propel market growth, with a particular emphasis on cold brew and iced coffee segments. The Southwest and West regions are anticipated to exhibit superior growth rates, driven by demographic shifts and climate patterns.
US RTD Coffee Industry Company Market Share
US RTD Coffee Industry: Market Analysis & Forecast
This comprehensive report delivers an in-depth analysis of the US Ready-to-Drink (RTD) Coffee market, providing actionable insights for stakeholders, investors, and industry professionals. The analysis spans from 2019 to 2033, with a detailed forecast for 2025-2033, using 2025 as the base year. Identify key market trends, competitive landscapes, and strategic growth opportunities within this dynamic sector. The market is valued at $5.4 billion in 2025 and is projected to reach over $8 billion by 2033.
US RTD Coffee Industry Market Dynamics & Concentration
This section analyzes the competitive landscape of the US RTD Coffee market, encompassing market concentration, innovation drivers, regulatory influences, product substitutes, consumer trends, and mergers & acquisitions (M&A) activity. The market is characterized by a mix of large multinational corporations and emerging players.
Market Concentration: The market exhibits a moderately concentrated structure, with a few major players holding significant market share. However, smaller, niche players also contribute significantly, particularly within specific segments like organic or plant-based RTD coffee. Market share data for key players (e.g., Nestlé, PepsiCo, Keurig Dr Pepper) will be detailed within the full report. The number of M&A deals in the sector averaged xx per year during the historical period (2019-2024), indicating a dynamic and consolidating market.
Key Factors:
- Innovation Drivers: The constant pursuit of novel flavors, functional ingredients, and sustainable packaging drives innovation.
- Regulatory Frameworks: FDA regulations on food safety and labeling influence product development and marketing strategies.
- Product Substitutes: Other beverages like bottled water, energy drinks, and teas compete for consumer spending.
- End-User Trends: Growing health consciousness and demand for convenient, on-the-go beverages shape consumer preferences.
- M&A Activity: Strategic acquisitions and partnerships play a crucial role in market consolidation and expansion.
US RTD Coffee Industry Industry Trends & Analysis
The US Ready-to-Drink (RTD) coffee market is experiencing robust growth, driven by evolving consumer preferences and technological advancements. This section analyzes key market trends, including growth drivers, technological disruptions, shifting consumer demands, and the competitive landscape influencing the industry's trajectory. The market's expansion is fueled by a desire for convenient, high-quality, and flavorful coffee options, readily available on-the-go.
Analysts project a Compound Annual Growth Rate (CAGR) of [Insert Updated CAGR]% for the forecast period (2025-2033). This growth is significantly impacted by several factors. Increased market penetration, especially among younger demographics, is a key driver. Technological innovations, such as advanced packaging and processing techniques, have led to improved product quality, extended shelf life, and enhanced flavor profiles. The surge in popularity of cold brew coffee and plant-based alternatives has further stimulated market expansion. The competitive intensity among established brands and emerging players fuels ongoing innovation and product diversification, leading to a dynamic and evolving market.
Leading Markets & Segments in US RTD Coffee Industry
This section identifies the leading markets and segments within the US RTD coffee industry, focusing on distribution channels, soft drink types, and packaging types.
Distribution Channel:
- Off-trade: This segment dominates the market, driven by high availability in supermarkets, convenience stores, and online retailers. Key drivers include widespread distribution networks and convenient access for consumers.
- On-trade: While smaller, the on-trade segment (cafes, restaurants) is growing due to the increasing preference for premium RTD coffee options in out-of-home settings.
Soft Drink Type:
- Cold Brew Coffee: This segment exhibits strong growth due to its smooth, less acidic flavor profile, gaining popularity among consumers.
- Iced Coffee: Remains a significant segment, although its growth is slightly lower than that of cold brew, due to its established presence and wide availability.
- Other RTD Coffee: This segment encompasses a variety of innovative products, including flavored coffee, functional coffee drinks, and specialty blends.
Packaging Type:
- PET Bottles: The most prevalent packaging type, offering a balance of cost-effectiveness, convenience, and recyclability.
- Metal Cans: Provides superior product protection and a premium image, suitable for specific product segments.
- Aseptic Packages: Extends shelf life, useful for longer-lasting, ambient-temperature products.
- Glass Bottles: While less common due to higher cost and fragility, glass bottles are used for premium offerings aiming for a sophisticated appeal.
US RTD Coffee Industry Product Developments
Innovation is a defining characteristic of the US RTD coffee market. New product launches consistently prioritize convenience, distinctive flavor profiles (e.g., nitrogen-infused cold brew, unique flavor blends), functional benefits (e.g., added vitamins, adaptogens, probiotics), and sustainable packaging options (e.g., recyclable materials, reduced plastic, compostable options). These developments directly respond to evolving consumer preferences for healthier, more ethical, and environmentally responsible products. Companies that prioritize innovation and align their product offerings with current trends gain a significant competitive advantage. Continuous advancements in brewing, processing, and packaging technologies contribute to higher-quality products with extended shelf life and improved taste.
Key Drivers of US RTD Coffee Industry Growth
Several factors are propelling the growth of the US RTD coffee market. Firstly, the increasing demand for convenient and on-the-go beverages aligns perfectly with the portability of RTD coffee. Secondly, advancements in brewing and processing technologies have improved the quality and consistency of RTD coffee, leading to higher consumer satisfaction. Finally, the growing health consciousness among consumers is driving demand for healthier alternatives, such as organic and plant-based RTD coffee options. These combined factors create a robust foundation for continued market expansion.
Challenges in the US RTD Coffee Industry Market
Despite its growth, the US RTD coffee market faces significant challenges. Intense competition necessitates strategic pricing and margin management. Supply chain vulnerabilities, including disruptions to raw materials (coffee beans, dairy, plant-based alternatives) and packaging, can lead to production delays and increased costs. Fluctuations in global coffee bean prices present an ongoing challenge for cost management and profitability. Furthermore, evolving regulatory landscapes concerning labeling, ingredient regulations (e.g., sugar content, additives), and sustainability practices (e.g., carbon footprint reduction) necessitate continuous adaptation and compliance from industry players.
Emerging Opportunities in US RTD Coffee Industry
Emerging opportunities in the US RTD coffee market abound. The increasing demand for functional and premium beverages presents opportunities for manufacturers to develop innovative products with added health benefits or unique flavor profiles. Strategic partnerships and collaborations can facilitate market expansion and enhance brand recognition. Further, exploring emerging markets within the US, particularly regions with strong growth potential, offers significant scope for growth.
Leading Players in the US RTD Coffee Industry Sector
- Peak Rock Capital LLC
- Nestle S A
- Costco Wholesale Corporation
- Califia Farms LLC
- La Colombe Holdings Inc
- BRC Inc
- PepsiCo Inc
- The Coca-Cola Company
- The Central America Bottling Corporation
- Luigi Lavazza S p A
- Keurig Dr Pepper Inc
- Danone S A
- Chamberlain Coffee Inc
Key Milestones in US RTD Coffee Industry Industry
- July 2023: Keurig Dr Pepper Inc. announces a strategic partnership with La Colombe, signifying a major shift in market consolidation and distribution strategies. This collaboration highlights the increasing importance of strategic partnerships and distribution networks for market leadership.
- April 2023: Chamberlain Coffee launches a plant-based cold brew latte line in collaboration with Walmart, expanding distribution and tapping into the growing plant-based market. This exemplifies the market's focus on offering sustainable and ethically sourced products.
- February 2023: Danone North America plans a USD 65 million investment to boost RTD coffee and plant-based milk production, indicating a commitment to this growing segment. This substantial investment reflects the significant growth potential and market confidence in the RTD coffee sector.
Strategic Outlook for US RTD Coffee Industry Market
The US RTD coffee market is poised for continued growth, driven by consumer demand, product innovation, and strategic partnerships. Emerging trends such as functional beverages, sustainable packaging, and premiumization will shape the market's future. Companies that embrace innovation, prioritize sustainability, and effectively target key consumer segments are well-positioned to capitalize on the market's significant growth potential. The expansion of the plant-based sector and ongoing M&A activity further enhance this optimistic outlook.
US RTD Coffee Industry Segmentation
-
1. Soft Drink Type
- 1.1. Cold Brew Coffee
- 1.2. Iced coffee
- 1.3. Other RTD Coffee
-
2. Packaging Type
- 2.1. Aseptic packages
- 2.2. Glass Bottles
- 2.3. Metal Can
- 2.4. PET Bottles
-
3. Distribution Channel
-
3.1. Off-trade
- 3.1.1. Convenience Stores
- 3.1.2. Online Retail
- 3.1.3. Specialty Stores
- 3.1.4. Supermarket/Hypermarket
- 3.1.5. Others
- 3.2. On-trade
-
3.1. Off-trade
US RTD Coffee Industry Segmentation By Geography
-
1. North America
- 1.1. United States
- 1.2. Canada
- 1.3. Mexico
-
2. South America
- 2.1. Brazil
- 2.2. Argentina
- 2.3. Rest of South America
-
3. Europe
- 3.1. United Kingdom
- 3.2. Germany
- 3.3. France
- 3.4. Italy
- 3.5. Spain
- 3.6. Russia
- 3.7. Benelux
- 3.8. Nordics
- 3.9. Rest of Europe
-
4. Middle East & Africa
- 4.1. Turkey
- 4.2. Israel
- 4.3. GCC
- 4.4. North Africa
- 4.5. South Africa
- 4.6. Rest of Middle East & Africa
-
5. Asia Pacific
- 5.1. China
- 5.2. India
- 5.3. Japan
- 5.4. South Korea
- 5.5. ASEAN
- 5.6. Oceania
- 5.7. Rest of Asia Pacific
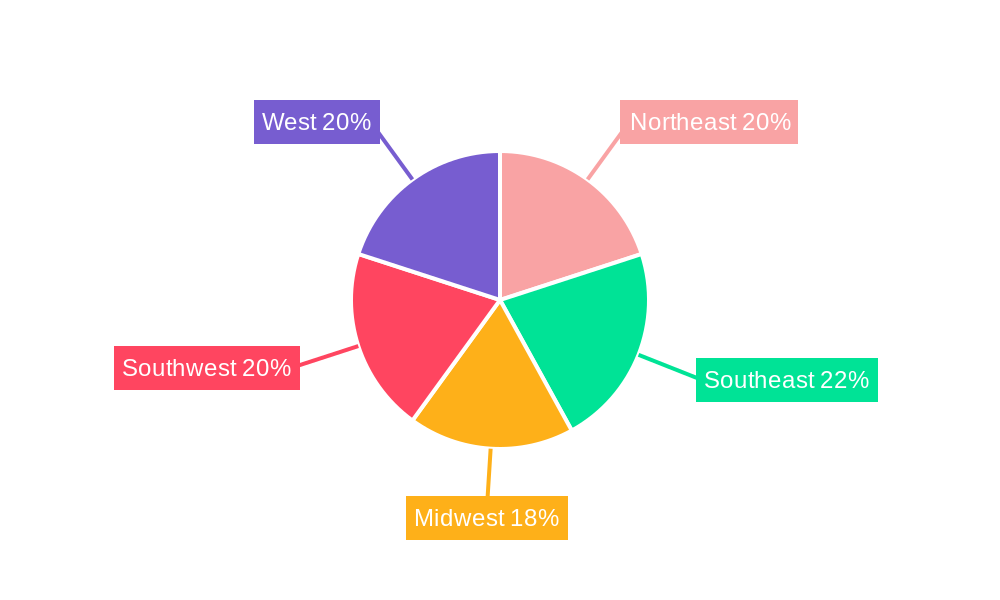
US RTD Coffee Industry Regional Market Share
Geographic Coverage of US RTD Coffee Industry
US RTD Coffee Industry REPORT HIGHLIGHTS
| Aspects | Details |
|---|---|
| Study Period | 2020-2034 |
| Base Year | 2025 |
| Estimated Year | 2026 |
| Forecast Period | 2026-2034 |
| Historical Period | 2020-2025 |
| Growth Rate | CAGR of 4.4% from 2020-2034 |
| Segmentation |
|
Table of Contents
- 1. Introduction
- 1.1. Research Scope
- 1.2. Market Segmentation
- 1.3. Research Methodology
- 1.4. Definitions and Assumptions
- 2. Executive Summary
- 2.1. Introduction
- 3. Market Dynamics
- 3.1. Introduction
- 3.2. Market Drivers
- 3.2.1. Increasing demand for meat alternatives
- 3.3. Market Restrains
- 3.3.1. Presence of numerous alternatives in the plant proteins
- 3.4. Market Trends
- 3.4.1. OTHER KEY INDUSTRY TRENDS COVERED IN THE REPORT
- 4. Market Factor Analysis
- 4.1. Porters Five Forces
- 4.2. Supply/Value Chain
- 4.3. PESTEL analysis
- 4.4. Market Entropy
- 4.5. Patent/Trademark Analysis
- 5. Global US RTD Coffee Industry Analysis, Insights and Forecast, 2020-2032
- 5.1. Market Analysis, Insights and Forecast - by Soft Drink Type
- 5.1.1. Cold Brew Coffee
- 5.1.2. Iced coffee
- 5.1.3. Other RTD Coffee
- 5.2. Market Analysis, Insights and Forecast - by Packaging Type
- 5.2.1. Aseptic packages
- 5.2.2. Glass Bottles
- 5.2.3. Metal Can
- 5.2.4. PET Bottles
- 5.3. Market Analysis, Insights and Forecast - by Distribution Channel
- 5.3.1. Off-trade
- 5.3.1.1. Convenience Stores
- 5.3.1.2. Online Retail
- 5.3.1.3. Specialty Stores
- 5.3.1.4. Supermarket/Hypermarket
- 5.3.1.5. Others
- 5.3.2. On-trade
- 5.3.1. Off-trade
- 5.4. Market Analysis, Insights and Forecast - by Region
- 5.4.1. North America
- 5.4.2. South America
- 5.4.3. Europe
- 5.4.4. Middle East & Africa
- 5.4.5. Asia Pacific
- 5.1. Market Analysis, Insights and Forecast - by Soft Drink Type
- 6. North America US RTD Coffee Industry Analysis, Insights and Forecast, 2020-2032
- 6.1. Market Analysis, Insights and Forecast - by Soft Drink Type
- 6.1.1. Cold Brew Coffee
- 6.1.2. Iced coffee
- 6.1.3. Other RTD Coffee
- 6.2. Market Analysis, Insights and Forecast - by Packaging Type
- 6.2.1. Aseptic packages
- 6.2.2. Glass Bottles
- 6.2.3. Metal Can
- 6.2.4. PET Bottles
- 6.3. Market Analysis, Insights and Forecast - by Distribution Channel
- 6.3.1. Off-trade
- 6.3.1.1. Convenience Stores
- 6.3.1.2. Online Retail
- 6.3.1.3. Specialty Stores
- 6.3.1.4. Supermarket/Hypermarket
- 6.3.1.5. Others
- 6.3.2. On-trade
- 6.3.1. Off-trade
- 6.1. Market Analysis, Insights and Forecast - by Soft Drink Type
- 7. South America US RTD Coffee Industry Analysis, Insights and Forecast, 2020-2032
- 7.1. Market Analysis, Insights and Forecast - by Soft Drink Type
- 7.1.1. Cold Brew Coffee
- 7.1.2. Iced coffee
- 7.1.3. Other RTD Coffee
- 7.2. Market Analysis, Insights and Forecast - by Packaging Type
- 7.2.1. Aseptic packages
- 7.2.2. Glass Bottles
- 7.2.3. Metal Can
- 7.2.4. PET Bottles
- 7.3. Market Analysis, Insights and Forecast - by Distribution Channel
- 7.3.1. Off-trade
- 7.3.1.1. Convenience Stores
- 7.3.1.2. Online Retail
- 7.3.1.3. Specialty Stores
- 7.3.1.4. Supermarket/Hypermarket
- 7.3.1.5. Others
- 7.3.2. On-trade
- 7.3.1. Off-trade
- 7.1. Market Analysis, Insights and Forecast - by Soft Drink Type
- 8. Europe US RTD Coffee Industry Analysis, Insights and Forecast, 2020-2032
- 8.1. Market Analysis, Insights and Forecast - by Soft Drink Type
- 8.1.1. Cold Brew Coffee
- 8.1.2. Iced coffee
- 8.1.3. Other RTD Coffee
- 8.2. Market Analysis, Insights and Forecast - by Packaging Type
- 8.2.1. Aseptic packages
- 8.2.2. Glass Bottles
- 8.2.3. Metal Can
- 8.2.4. PET Bottles
- 8.3. Market Analysis, Insights and Forecast - by Distribution Channel
- 8.3.1. Off-trade
- 8.3.1.1. Convenience Stores
- 8.3.1.2. Online Retail
- 8.3.1.3. Specialty Stores
- 8.3.1.4. Supermarket/Hypermarket
- 8.3.1.5. Others
- 8.3.2. On-trade
- 8.3.1. Off-trade
- 8.1. Market Analysis, Insights and Forecast - by Soft Drink Type
- 9. Middle East & Africa US RTD Coffee Industry Analysis, Insights and Forecast, 2020-2032
- 9.1. Market Analysis, Insights and Forecast - by Soft Drink Type
- 9.1.1. Cold Brew Coffee
- 9.1.2. Iced coffee
- 9.1.3. Other RTD Coffee
- 9.2. Market Analysis, Insights and Forecast - by Packaging Type
- 9.2.1. Aseptic packages
- 9.2.2. Glass Bottles
- 9.2.3. Metal Can
- 9.2.4. PET Bottles
- 9.3. Market Analysis, Insights and Forecast - by Distribution Channel
- 9.3.1. Off-trade
- 9.3.1.1. Convenience Stores
- 9.3.1.2. Online Retail
- 9.3.1.3. Specialty Stores
- 9.3.1.4. Supermarket/Hypermarket
- 9.3.1.5. Others
- 9.3.2. On-trade
- 9.3.1. Off-trade
- 9.1. Market Analysis, Insights and Forecast - by Soft Drink Type
- 10. Asia Pacific US RTD Coffee Industry Analysis, Insights and Forecast, 2020-2032
- 10.1. Market Analysis, Insights and Forecast - by Soft Drink Type
- 10.1.1. Cold Brew Coffee
- 10.1.2. Iced coffee
- 10.1.3. Other RTD Coffee
- 10.2. Market Analysis, Insights and Forecast - by Packaging Type
- 10.2.1. Aseptic packages
- 10.2.2. Glass Bottles
- 10.2.3. Metal Can
- 10.2.4. PET Bottles
- 10.3. Market Analysis, Insights and Forecast - by Distribution Channel
- 10.3.1. Off-trade
- 10.3.1.1. Convenience Stores
- 10.3.1.2. Online Retail
- 10.3.1.3. Specialty Stores
- 10.3.1.4. Supermarket/Hypermarket
- 10.3.1.5. Others
- 10.3.2. On-trade
- 10.3.1. Off-trade
- 10.1. Market Analysis, Insights and Forecast - by Soft Drink Type
- 11. Competitive Analysis
- 11.1. Global Market Share Analysis 2025
- 11.2. Company Profiles
- 11.2.1 Peak Rock Capital LLC
- 11.2.1.1. Overview
- 11.2.1.2. Products
- 11.2.1.3. SWOT Analysis
- 11.2.1.4. Recent Developments
- 11.2.1.5. Financials (Based on Availability)
- 11.2.2 Nestle S A
- 11.2.2.1. Overview
- 11.2.2.2. Products
- 11.2.2.3. SWOT Analysis
- 11.2.2.4. Recent Developments
- 11.2.2.5. Financials (Based on Availability)
- 11.2.3 Costco Wholesale Corporation
- 11.2.3.1. Overview
- 11.2.3.2. Products
- 11.2.3.3. SWOT Analysis
- 11.2.3.4. Recent Developments
- 11.2.3.5. Financials (Based on Availability)
- 11.2.4 Califia Farms LLC
- 11.2.4.1. Overview
- 11.2.4.2. Products
- 11.2.4.3. SWOT Analysis
- 11.2.4.4. Recent Developments
- 11.2.4.5. Financials (Based on Availability)
- 11.2.5 La Colombe Holdings Inc
- 11.2.5.1. Overview
- 11.2.5.2. Products
- 11.2.5.3. SWOT Analysis
- 11.2.5.4. Recent Developments
- 11.2.5.5. Financials (Based on Availability)
- 11.2.6 BRC Inc
- 11.2.6.1. Overview
- 11.2.6.2. Products
- 11.2.6.3. SWOT Analysis
- 11.2.6.4. Recent Developments
- 11.2.6.5. Financials (Based on Availability)
- 11.2.7 PepsiCo Inc
- 11.2.7.1. Overview
- 11.2.7.2. Products
- 11.2.7.3. SWOT Analysis
- 11.2.7.4. Recent Developments
- 11.2.7.5. Financials (Based on Availability)
- 11.2.8 The Coca-Cola Compan
- 11.2.8.1. Overview
- 11.2.8.2. Products
- 11.2.8.3. SWOT Analysis
- 11.2.8.4. Recent Developments
- 11.2.8.5. Financials (Based on Availability)
- 11.2.9 The Central America Bottling Corporation
- 11.2.9.1. Overview
- 11.2.9.2. Products
- 11.2.9.3. SWOT Analysis
- 11.2.9.4. Recent Developments
- 11.2.9.5. Financials (Based on Availability)
- 11.2.10 Luigi Lavazza S p A
- 11.2.10.1. Overview
- 11.2.10.2. Products
- 11.2.10.3. SWOT Analysis
- 11.2.10.4. Recent Developments
- 11.2.10.5. Financials (Based on Availability)
- 11.2.11 Keurig Dr Pepper Inc
- 11.2.11.1. Overview
- 11.2.11.2. Products
- 11.2.11.3. SWOT Analysis
- 11.2.11.4. Recent Developments
- 11.2.11.5. Financials (Based on Availability)
- 11.2.12 Danone S A
- 11.2.12.1. Overview
- 11.2.12.2. Products
- 11.2.12.3. SWOT Analysis
- 11.2.12.4. Recent Developments
- 11.2.12.5. Financials (Based on Availability)
- 11.2.13 Chamberlain Coffee Inc
- 11.2.13.1. Overview
- 11.2.13.2. Products
- 11.2.13.3. SWOT Analysis
- 11.2.13.4. Recent Developments
- 11.2.13.5. Financials (Based on Availability)
- 11.2.1 Peak Rock Capital LLC
List of Figures
- Figure 1: Global US RTD Coffee Industry Revenue Breakdown (billion, %) by Region 2025 & 2033
- Figure 2: Global US RTD Coffee Industry Volume Breakdown (K Tons, %) by Region 2025 & 2033
- Figure 3: North America US RTD Coffee Industry Revenue (billion), by Soft Drink Type 2025 & 2033
- Figure 4: North America US RTD Coffee Industry Volume (K Tons), by Soft Drink Type 2025 & 2033
- Figure 5: North America US RTD Coffee Industry Revenue Share (%), by Soft Drink Type 2025 & 2033
- Figure 6: North America US RTD Coffee Industry Volume Share (%), by Soft Drink Type 2025 & 2033
- Figure 7: North America US RTD Coffee Industry Revenue (billion), by Packaging Type 2025 & 2033
- Figure 8: North America US RTD Coffee Industry Volume (K Tons), by Packaging Type 2025 & 2033
- Figure 9: North America US RTD Coffee Industry Revenue Share (%), by Packaging Type 2025 & 2033
- Figure 10: North America US RTD Coffee Industry Volume Share (%), by Packaging Type 2025 & 2033
- Figure 11: North America US RTD Coffee Industry Revenue (billion), by Distribution Channel 2025 & 2033
- Figure 12: North America US RTD Coffee Industry Volume (K Tons), by Distribution Channel 2025 & 2033
- Figure 13: North America US RTD Coffee Industry Revenue Share (%), by Distribution Channel 2025 & 2033
- Figure 14: North America US RTD Coffee Industry Volume Share (%), by Distribution Channel 2025 & 2033
- Figure 15: North America US RTD Coffee Industry Revenue (billion), by Country 2025 & 2033
- Figure 16: North America US RTD Coffee Industry Volume (K Tons), by Country 2025 & 2033
- Figure 17: North America US RTD Coffee Industry Revenue Share (%), by Country 2025 & 2033
- Figure 18: North America US RTD Coffee Industry Volume Share (%), by Country 2025 & 2033
- Figure 19: South America US RTD Coffee Industry Revenue (billion), by Soft Drink Type 2025 & 2033
- Figure 20: South America US RTD Coffee Industry Volume (K Tons), by Soft Drink Type 2025 & 2033
- Figure 21: South America US RTD Coffee Industry Revenue Share (%), by Soft Drink Type 2025 & 2033
- Figure 22: South America US RTD Coffee Industry Volume Share (%), by Soft Drink Type 2025 & 2033
- Figure 23: South America US RTD Coffee Industry Revenue (billion), by Packaging Type 2025 & 2033
- Figure 24: South America US RTD Coffee Industry Volume (K Tons), by Packaging Type 2025 & 2033
- Figure 25: South America US RTD Coffee Industry Revenue Share (%), by Packaging Type 2025 & 2033
- Figure 26: South America US RTD Coffee Industry Volume Share (%), by Packaging Type 2025 & 2033
- Figure 27: South America US RTD Coffee Industry Revenue (billion), by Distribution Channel 2025 & 2033
- Figure 28: South America US RTD Coffee Industry Volume (K Tons), by Distribution Channel 2025 & 2033
- Figure 29: South America US RTD Coffee Industry Revenue Share (%), by Distribution Channel 2025 & 2033
- Figure 30: South America US RTD Coffee Industry Volume Share (%), by Distribution Channel 2025 & 2033
- Figure 31: South America US RTD Coffee Industry Revenue (billion), by Country 2025 & 2033
- Figure 32: South America US RTD Coffee Industry Volume (K Tons), by Country 2025 & 2033
- Figure 33: South America US RTD Coffee Industry Revenue Share (%), by Country 2025 & 2033
- Figure 34: South America US RTD Coffee Industry Volume Share (%), by Country 2025 & 2033
- Figure 35: Europe US RTD Coffee Industry Revenue (billion), by Soft Drink Type 2025 & 2033
- Figure 36: Europe US RTD Coffee Industry Volume (K Tons), by Soft Drink Type 2025 & 2033
- Figure 37: Europe US RTD Coffee Industry Revenue Share (%), by Soft Drink Type 2025 & 2033
- Figure 38: Europe US RTD Coffee Industry Volume Share (%), by Soft Drink Type 2025 & 2033
- Figure 39: Europe US RTD Coffee Industry Revenue (billion), by Packaging Type 2025 & 2033
- Figure 40: Europe US RTD Coffee Industry Volume (K Tons), by Packaging Type 2025 & 2033
- Figure 41: Europe US RTD Coffee Industry Revenue Share (%), by Packaging Type 2025 & 2033
- Figure 42: Europe US RTD Coffee Industry Volume Share (%), by Packaging Type 2025 & 2033
- Figure 43: Europe US RTD Coffee Industry Revenue (billion), by Distribution Channel 2025 & 2033
- Figure 44: Europe US RTD Coffee Industry Volume (K Tons), by Distribution Channel 2025 & 2033
- Figure 45: Europe US RTD Coffee Industry Revenue Share (%), by Distribution Channel 2025 & 2033
- Figure 46: Europe US RTD Coffee Industry Volume Share (%), by Distribution Channel 2025 & 2033
- Figure 47: Europe US RTD Coffee Industry Revenue (billion), by Country 2025 & 2033
- Figure 48: Europe US RTD Coffee Industry Volume (K Tons), by Country 2025 & 2033
- Figure 49: Europe US RTD Coffee Industry Revenue Share (%), by Country 2025 & 2033
- Figure 50: Europe US RTD Coffee Industry Volume Share (%), by Country 2025 & 2033
- Figure 51: Middle East & Africa US RTD Coffee Industry Revenue (billion), by Soft Drink Type 2025 & 2033
- Figure 52: Middle East & Africa US RTD Coffee Industry Volume (K Tons), by Soft Drink Type 2025 & 2033
- Figure 53: Middle East & Africa US RTD Coffee Industry Revenue Share (%), by Soft Drink Type 2025 & 2033
- Figure 54: Middle East & Africa US RTD Coffee Industry Volume Share (%), by Soft Drink Type 2025 & 2033
- Figure 55: Middle East & Africa US RTD Coffee Industry Revenue (billion), by Packaging Type 2025 & 2033
- Figure 56: Middle East & Africa US RTD Coffee Industry Volume (K Tons), by Packaging Type 2025 & 2033
- Figure 57: Middle East & Africa US RTD Coffee Industry Revenue Share (%), by Packaging Type 2025 & 2033
- Figure 58: Middle East & Africa US RTD Coffee Industry Volume Share (%), by Packaging Type 2025 & 2033
- Figure 59: Middle East & Africa US RTD Coffee Industry Revenue (billion), by Distribution Channel 2025 & 2033
- Figure 60: Middle East & Africa US RTD Coffee Industry Volume (K Tons), by Distribution Channel 2025 & 2033
- Figure 61: Middle East & Africa US RTD Coffee Industry Revenue Share (%), by Distribution Channel 2025 & 2033
- Figure 62: Middle East & Africa US RTD Coffee Industry Volume Share (%), by Distribution Channel 2025 & 2033
- Figure 63: Middle East & Africa US RTD Coffee Industry Revenue (billion), by Country 2025 & 2033
- Figure 64: Middle East & Africa US RTD Coffee Industry Volume (K Tons), by Country 2025 & 2033
- Figure 65: Middle East & Africa US RTD Coffee Industry Revenue Share (%), by Country 2025 & 2033
- Figure 66: Middle East & Africa US RTD Coffee Industry Volume Share (%), by Country 2025 & 2033
- Figure 67: Asia Pacific US RTD Coffee Industry Revenue (billion), by Soft Drink Type 2025 & 2033
- Figure 68: Asia Pacific US RTD Coffee Industry Volume (K Tons), by Soft Drink Type 2025 & 2033
- Figure 69: Asia Pacific US RTD Coffee Industry Revenue Share (%), by Soft Drink Type 2025 & 2033
- Figure 70: Asia Pacific US RTD Coffee Industry Volume Share (%), by Soft Drink Type 2025 & 2033
- Figure 71: Asia Pacific US RTD Coffee Industry Revenue (billion), by Packaging Type 2025 & 2033
- Figure 72: Asia Pacific US RTD Coffee Industry Volume (K Tons), by Packaging Type 2025 & 2033
- Figure 73: Asia Pacific US RTD Coffee Industry Revenue Share (%), by Packaging Type 2025 & 2033
- Figure 74: Asia Pacific US RTD Coffee Industry Volume Share (%), by Packaging Type 2025 & 2033
- Figure 75: Asia Pacific US RTD Coffee Industry Revenue (billion), by Distribution Channel 2025 & 2033
- Figure 76: Asia Pacific US RTD Coffee Industry Volume (K Tons), by Distribution Channel 2025 & 2033
- Figure 77: Asia Pacific US RTD Coffee Industry Revenue Share (%), by Distribution Channel 2025 & 2033
- Figure 78: Asia Pacific US RTD Coffee Industry Volume Share (%), by Distribution Channel 2025 & 2033
- Figure 79: Asia Pacific US RTD Coffee Industry Revenue (billion), by Country 2025 & 2033
- Figure 80: Asia Pacific US RTD Coffee Industry Volume (K Tons), by Country 2025 & 2033
- Figure 81: Asia Pacific US RTD Coffee Industry Revenue Share (%), by Country 2025 & 2033
- Figure 82: Asia Pacific US RTD Coffee Industry Volume Share (%), by Country 2025 & 2033
List of Tables
- Table 1: Global US RTD Coffee Industry Revenue billion Forecast, by Soft Drink Type 2020 & 2033
- Table 2: Global US RTD Coffee Industry Volume K Tons Forecast, by Soft Drink Type 2020 & 2033
- Table 3: Global US RTD Coffee Industry Revenue billion Forecast, by Packaging Type 2020 & 2033
- Table 4: Global US RTD Coffee Industry Volume K Tons Forecast, by Packaging Type 2020 & 2033
- Table 5: Global US RTD Coffee Industry Revenue billion Forecast, by Distribution Channel 2020 & 2033
- Table 6: Global US RTD Coffee Industry Volume K Tons Forecast, by Distribution Channel 2020 & 2033
- Table 7: Global US RTD Coffee Industry Revenue billion Forecast, by Region 2020 & 2033
- Table 8: Global US RTD Coffee Industry Volume K Tons Forecast, by Region 2020 & 2033
- Table 9: Global US RTD Coffee Industry Revenue billion Forecast, by Soft Drink Type 2020 & 2033
- Table 10: Global US RTD Coffee Industry Volume K Tons Forecast, by Soft Drink Type 2020 & 2033
- Table 11: Global US RTD Coffee Industry Revenue billion Forecast, by Packaging Type 2020 & 2033
- Table 12: Global US RTD Coffee Industry Volume K Tons Forecast, by Packaging Type 2020 & 2033
- Table 13: Global US RTD Coffee Industry Revenue billion Forecast, by Distribution Channel 2020 & 2033
- Table 14: Global US RTD Coffee Industry Volume K Tons Forecast, by Distribution Channel 2020 & 2033
- Table 15: Global US RTD Coffee Industry Revenue billion Forecast, by Country 2020 & 2033
- Table 16: Global US RTD Coffee Industry Volume K Tons Forecast, by Country 2020 & 2033
- Table 17: United States US RTD Coffee Industry Revenue (billion) Forecast, by Application 2020 & 2033
- Table 18: United States US RTD Coffee Industry Volume (K Tons) Forecast, by Application 2020 & 2033
- Table 19: Canada US RTD Coffee Industry Revenue (billion) Forecast, by Application 2020 & 2033
- Table 20: Canada US RTD Coffee Industry Volume (K Tons) Forecast, by Application 2020 & 2033
- Table 21: Mexico US RTD Coffee Industry Revenue (billion) Forecast, by Application 2020 & 2033
- Table 22: Mexico US RTD Coffee Industry Volume (K Tons) Forecast, by Application 2020 & 2033
- Table 23: Global US RTD Coffee Industry Revenue billion Forecast, by Soft Drink Type 2020 & 2033
- Table 24: Global US RTD Coffee Industry Volume K Tons Forecast, by Soft Drink Type 2020 & 2033
- Table 25: Global US RTD Coffee Industry Revenue billion Forecast, by Packaging Type 2020 & 2033
- Table 26: Global US RTD Coffee Industry Volume K Tons Forecast, by Packaging Type 2020 & 2033
- Table 27: Global US RTD Coffee Industry Revenue billion Forecast, by Distribution Channel 2020 & 2033
- Table 28: Global US RTD Coffee Industry Volume K Tons Forecast, by Distribution Channel 2020 & 2033
- Table 29: Global US RTD Coffee Industry Revenue billion Forecast, by Country 2020 & 2033
- Table 30: Global US RTD Coffee Industry Volume K Tons Forecast, by Country 2020 & 2033
- Table 31: Brazil US RTD Coffee Industry Revenue (billion) Forecast, by Application 2020 & 2033
- Table 32: Brazil US RTD Coffee Industry Volume (K Tons) Forecast, by Application 2020 & 2033
- Table 33: Argentina US RTD Coffee Industry Revenue (billion) Forecast, by Application 2020 & 2033
- Table 34: Argentina US RTD Coffee Industry Volume (K Tons) Forecast, by Application 2020 & 2033
- Table 35: Rest of South America US RTD Coffee Industry Revenue (billion) Forecast, by Application 2020 & 2033
- Table 36: Rest of South America US RTD Coffee Industry Volume (K Tons) Forecast, by Application 2020 & 2033
- Table 37: Global US RTD Coffee Industry Revenue billion Forecast, by Soft Drink Type 2020 & 2033
- Table 38: Global US RTD Coffee Industry Volume K Tons Forecast, by Soft Drink Type 2020 & 2033
- Table 39: Global US RTD Coffee Industry Revenue billion Forecast, by Packaging Type 2020 & 2033
- Table 40: Global US RTD Coffee Industry Volume K Tons Forecast, by Packaging Type 2020 & 2033
- Table 41: Global US RTD Coffee Industry Revenue billion Forecast, by Distribution Channel 2020 & 2033
- Table 42: Global US RTD Coffee Industry Volume K Tons Forecast, by Distribution Channel 2020 & 2033
- Table 43: Global US RTD Coffee Industry Revenue billion Forecast, by Country 2020 & 2033
- Table 44: Global US RTD Coffee Industry Volume K Tons Forecast, by Country 2020 & 2033
- Table 45: United Kingdom US RTD Coffee Industry Revenue (billion) Forecast, by Application 2020 & 2033
- Table 46: United Kingdom US RTD Coffee Industry Volume (K Tons) Forecast, by Application 2020 & 2033
- Table 47: Germany US RTD Coffee Industry Revenue (billion) Forecast, by Application 2020 & 2033
- Table 48: Germany US RTD Coffee Industry Volume (K Tons) Forecast, by Application 2020 & 2033
- Table 49: France US RTD Coffee Industry Revenue (billion) Forecast, by Application 2020 & 2033
- Table 50: France US RTD Coffee Industry Volume (K Tons) Forecast, by Application 2020 & 2033
- Table 51: Italy US RTD Coffee Industry Revenue (billion) Forecast, by Application 2020 & 2033
- Table 52: Italy US RTD Coffee Industry Volume (K Tons) Forecast, by Application 2020 & 2033
- Table 53: Spain US RTD Coffee Industry Revenue (billion) Forecast, by Application 2020 & 2033
- Table 54: Spain US RTD Coffee Industry Volume (K Tons) Forecast, by Application 2020 & 2033
- Table 55: Russia US RTD Coffee Industry Revenue (billion) Forecast, by Application 2020 & 2033
- Table 56: Russia US RTD Coffee Industry Volume (K Tons) Forecast, by Application 2020 & 2033
- Table 57: Benelux US RTD Coffee Industry Revenue (billion) Forecast, by Application 2020 & 2033
- Table 58: Benelux US RTD Coffee Industry Volume (K Tons) Forecast, by Application 2020 & 2033
- Table 59: Nordics US RTD Coffee Industry Revenue (billion) Forecast, by Application 2020 & 2033
- Table 60: Nordics US RTD Coffee Industry Volume (K Tons) Forecast, by Application 2020 & 2033
- Table 61: Rest of Europe US RTD Coffee Industry Revenue (billion) Forecast, by Application 2020 & 2033
- Table 62: Rest of Europe US RTD Coffee Industry Volume (K Tons) Forecast, by Application 2020 & 2033
- Table 63: Global US RTD Coffee Industry Revenue billion Forecast, by Soft Drink Type 2020 & 2033
- Table 64: Global US RTD Coffee Industry Volume K Tons Forecast, by Soft Drink Type 2020 & 2033
- Table 65: Global US RTD Coffee Industry Revenue billion Forecast, by Packaging Type 2020 & 2033
- Table 66: Global US RTD Coffee Industry Volume K Tons Forecast, by Packaging Type 2020 & 2033
- Table 67: Global US RTD Coffee Industry Revenue billion Forecast, by Distribution Channel 2020 & 2033
- Table 68: Global US RTD Coffee Industry Volume K Tons Forecast, by Distribution Channel 2020 & 2033
- Table 69: Global US RTD Coffee Industry Revenue billion Forecast, by Country 2020 & 2033
- Table 70: Global US RTD Coffee Industry Volume K Tons Forecast, by Country 2020 & 2033
- Table 71: Turkey US RTD Coffee Industry Revenue (billion) Forecast, by Application 2020 & 2033
- Table 72: Turkey US RTD Coffee Industry Volume (K Tons) Forecast, by Application 2020 & 2033
- Table 73: Israel US RTD Coffee Industry Revenue (billion) Forecast, by Application 2020 & 2033
- Table 74: Israel US RTD Coffee Industry Volume (K Tons) Forecast, by Application 2020 & 2033
- Table 75: GCC US RTD Coffee Industry Revenue (billion) Forecast, by Application 2020 & 2033
- Table 76: GCC US RTD Coffee Industry Volume (K Tons) Forecast, by Application 2020 & 2033
- Table 77: North Africa US RTD Coffee Industry Revenue (billion) Forecast, by Application 2020 & 2033
- Table 78: North Africa US RTD Coffee Industry Volume (K Tons) Forecast, by Application 2020 & 2033
- Table 79: South Africa US RTD Coffee Industry Revenue (billion) Forecast, by Application 2020 & 2033
- Table 80: South Africa US RTD Coffee Industry Volume (K Tons) Forecast, by Application 2020 & 2033
- Table 81: Rest of Middle East & Africa US RTD Coffee Industry Revenue (billion) Forecast, by Application 2020 & 2033
- Table 82: Rest of Middle East & Africa US RTD Coffee Industry Volume (K Tons) Forecast, by Application 2020 & 2033
- Table 83: Global US RTD Coffee Industry Revenue billion Forecast, by Soft Drink Type 2020 & 2033
- Table 84: Global US RTD Coffee Industry Volume K Tons Forecast, by Soft Drink Type 2020 & 2033
- Table 85: Global US RTD Coffee Industry Revenue billion Forecast, by Packaging Type 2020 & 2033
- Table 86: Global US RTD Coffee Industry Volume K Tons Forecast, by Packaging Type 2020 & 2033
- Table 87: Global US RTD Coffee Industry Revenue billion Forecast, by Distribution Channel 2020 & 2033
- Table 88: Global US RTD Coffee Industry Volume K Tons Forecast, by Distribution Channel 2020 & 2033
- Table 89: Global US RTD Coffee Industry Revenue billion Forecast, by Country 2020 & 2033
- Table 90: Global US RTD Coffee Industry Volume K Tons Forecast, by Country 2020 & 2033
- Table 91: China US RTD Coffee Industry Revenue (billion) Forecast, by Application 2020 & 2033
- Table 92: China US RTD Coffee Industry Volume (K Tons) Forecast, by Application 2020 & 2033
- Table 93: India US RTD Coffee Industry Revenue (billion) Forecast, by Application 2020 & 2033
- Table 94: India US RTD Coffee Industry Volume (K Tons) Forecast, by Application 2020 & 2033
- Table 95: Japan US RTD Coffee Industry Revenue (billion) Forecast, by Application 2020 & 2033
- Table 96: Japan US RTD Coffee Industry Volume (K Tons) Forecast, by Application 2020 & 2033
- Table 97: South Korea US RTD Coffee Industry Revenue (billion) Forecast, by Application 2020 & 2033
- Table 98: South Korea US RTD Coffee Industry Volume (K Tons) Forecast, by Application 2020 & 2033
- Table 99: ASEAN US RTD Coffee Industry Revenue (billion) Forecast, by Application 2020 & 2033
- Table 100: ASEAN US RTD Coffee Industry Volume (K Tons) Forecast, by Application 2020 & 2033
- Table 101: Oceania US RTD Coffee Industry Revenue (billion) Forecast, by Application 2020 & 2033
- Table 102: Oceania US RTD Coffee Industry Volume (K Tons) Forecast, by Application 2020 & 2033
- Table 103: Rest of Asia Pacific US RTD Coffee Industry Revenue (billion) Forecast, by Application 2020 & 2033
- Table 104: Rest of Asia Pacific US RTD Coffee Industry Volume (K Tons) Forecast, by Application 2020 & 2033
Frequently Asked Questions
1. What is the projected Compound Annual Growth Rate (CAGR) of the US RTD Coffee Industry?
The projected CAGR is approximately 4.4%.
2. Which companies are prominent players in the US RTD Coffee Industry?
Key companies in the market include Peak Rock Capital LLC, Nestle S A, Costco Wholesale Corporation, Califia Farms LLC, La Colombe Holdings Inc, BRC Inc, PepsiCo Inc, The Coca-Cola Compan, The Central America Bottling Corporation, Luigi Lavazza S p A, Keurig Dr Pepper Inc, Danone S A, Chamberlain Coffee Inc.
3. What are the main segments of the US RTD Coffee Industry?
The market segments include Soft Drink Type, Packaging Type, Distribution Channel.
4. Can you provide details about the market size?
The market size is estimated to be USD 5.4 billion as of 2022.
5. What are some drivers contributing to market growth?
Increasing demand for meat alternatives.
6. What are the notable trends driving market growth?
OTHER KEY INDUSTRY TRENDS COVERED IN THE REPORT.
7. Are there any restraints impacting market growth?
Presence of numerous alternatives in the plant proteins.
8. Can you provide examples of recent developments in the market?
July 2023: Keurig Dr. Pepper Inc. announced a strategic partnership with La Colombe, including a long-term sales and distribution agreement for La Colombe's ready-to-drink coffee. Keurig Dr Pepper will also make an equity investment in La Colombe, enabling KDP to participate in the value creation upside expected from the partnership.April 2023: Chamberlain Coffee, in collaboration with Walmart, rolled out a new line of plant-based cold brew lattes, ready to drink (RTD) and conveniently available at Walmart stores.February 2023: Danone North America planned to invest up to USD 65 million over the next two years to increase ready-to-drink (RTD) coffee and creamer and oat milk production in the US. The investment will cover several of Danone's coffee brands, including coffee creamer International Delight, oat milk brand Silk, and cold brew range SToK.
9. What pricing options are available for accessing the report?
Pricing options include single-user, multi-user, and enterprise licenses priced at USD 3800, USD 4500, and USD 5800 respectively.
10. Is the market size provided in terms of value or volume?
The market size is provided in terms of value, measured in billion and volume, measured in K Tons.
11. Are there any specific market keywords associated with the report?
Yes, the market keyword associated with the report is "US RTD Coffee Industry," which aids in identifying and referencing the specific market segment covered.
12. How do I determine which pricing option suits my needs best?
The pricing options vary based on user requirements and access needs. Individual users may opt for single-user licenses, while businesses requiring broader access may choose multi-user or enterprise licenses for cost-effective access to the report.
13. Are there any additional resources or data provided in the US RTD Coffee Industry report?
While the report offers comprehensive insights, it's advisable to review the specific contents or supplementary materials provided to ascertain if additional resources or data are available.
14. How can I stay updated on further developments or reports in the US RTD Coffee Industry?
To stay informed about further developments, trends, and reports in the US RTD Coffee Industry, consider subscribing to industry newsletters, following relevant companies and organizations, or regularly checking reputable industry news sources and publications.
Methodology
Step 1 - Identification of Relevant Samples Size from Population Database


Step 2 - Approaches for Defining Global Market Size (Value, Volume* & Price*)

Note*: In applicable scenarios
Step 3 - Data Sources
Primary Research
- Web Analytics
- Survey Reports
- Research Institute
- Latest Research Reports
- Opinion Leaders
Secondary Research
- Annual Reports
- White Paper
- Latest Press Release
- Industry Association
- Paid Database
- Investor Presentations

Step 4 - Data Triangulation
Involves using different sources of information in order to increase the validity of a study
These sources are likely to be stakeholders in a program - participants, other researchers, program staff, other community members, and so on.
Then we put all data in single framework & apply various statistical tools to find out the dynamic on the market.
During the analysis stage, feedback from the stakeholder groups would be compared to determine areas of agreement as well as areas of divergence