

Key Insights
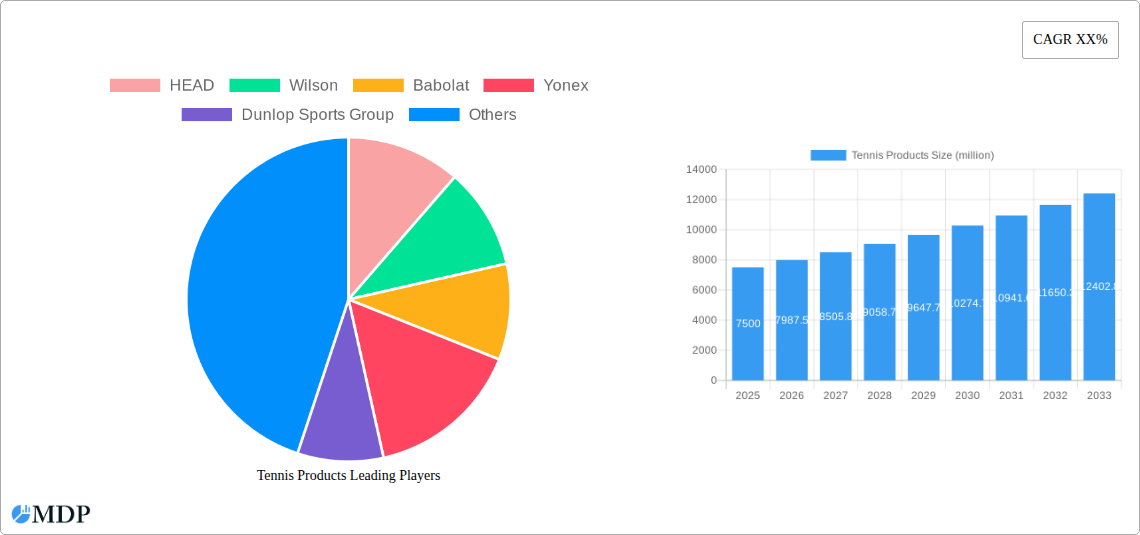
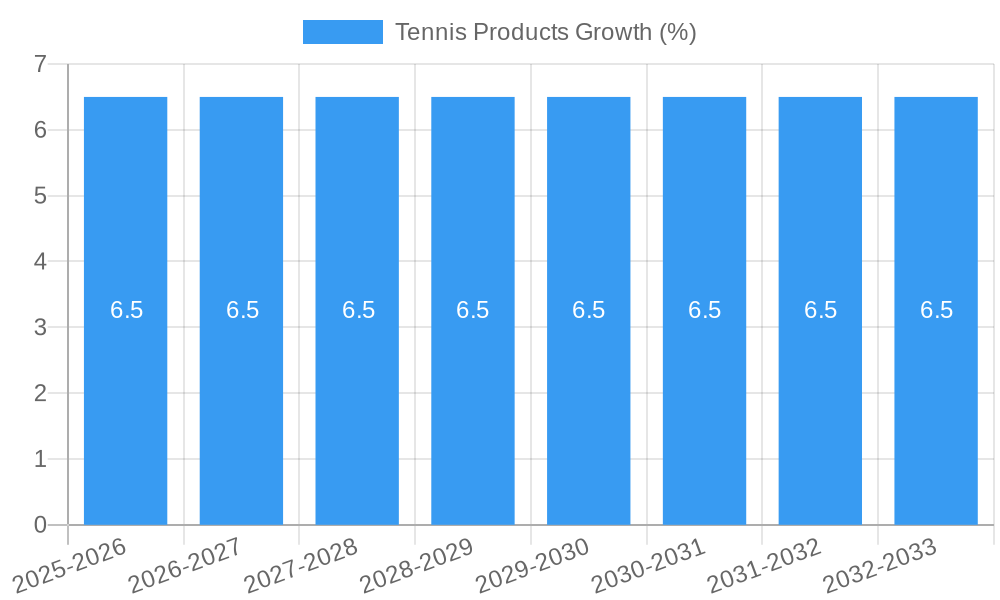
The global tennis products market is experiencing robust growth, projected to reach approximately USD 7,500 million by 2025, with a Compound Annual Growth Rate (CAGR) of roughly 6.5% from 2019-2033. This expansion is primarily fueled by increasing participation in recreational and professional tennis globally, driven by greater awareness of the sport's health benefits and the growing popularity of major tournaments. The "Entertainment" segment, encompassing consumer-level participation and leisure play, is a significant contributor, alongside the "Athletic Contest" segment driven by professional circuits and amateur leagues. Key market players like Nike, Adidas, Wilson, and Babolat are heavily investing in product innovation, introducing advanced materials and technologies in racquets, apparel, and footwear to enhance performance and player comfort. This trend is further amplified by the rise of online retail channels, making a wider array of specialized tennis gear accessible to a broader consumer base.
Looking ahead, the market is poised for sustained expansion, with the forecast period (2025-2033) expected to witness continued momentum. While the market is generally strong, certain restraints such as the high cost of some premium tennis equipment and the availability of alternative sports activities could pose minor challenges. However, emerging economies, particularly in the Asia Pacific region with countries like China and India showing increasing interest in organized sports, represent significant growth opportunities. The continuous evolution of tennis apparel and footwear to incorporate sustainable materials and smart technology also presents a significant trend. The market's segmentation by type, including racquets, apparel, tennis shoes, bags, grips, and accessories, indicates a diverse product landscape catering to various player needs and preferences, all contributing to the overall market value.
Tennis Products Market Analysis Report: Trends, Opportunities, and Growth Strategies (2019-2033)
Unlock strategic insights into the dynamic global tennis products market. This comprehensive report, covering the study period from 2019 to 2033 with a base year of 2025, delivers actionable intelligence for industry stakeholders. With millions in market value and projected growth, understand the competitive landscape, key trends, leading segments, and future opportunities in tennis equipment, apparel, and accessories. This report is designed for immediate use without further modification.
Tennis Products Market Dynamics & Concentration
The global tennis products market exhibits a moderate to high concentration, with a few dominant players like HEAD, Wilson, Babolat, and Yonex commanding significant market share, estimated to be over 60% collectively. Innovation remains a primary driver, fueled by ongoing research and development in materials science for racquets and advanced technologies in tennis shoes and apparel. Regulatory frameworks, while generally supportive of sporting goods, can impact import/export duties and product safety standards globally. Product substitutes, though limited in core tennis equipment, exist in adjacent sports and recreational activities. End-user trends are strongly influenced by professional tennis tournaments, celebrity endorsements, and the increasing popularity of tennis as a fitness and social activity. The market has witnessed substantial M&A activity, with approximately 15-20 major deals in the historical period (2019-2024) valued in the hundreds of millions, aimed at expanding product portfolios and market reach. Companies like Amer Sports and ASICS have been active in consolidating their positions.
Tennis Products Industry Trends & Analysis
The tennis products industry is poised for significant expansion, driven by a confluence of factors that are reshaping the market. The projected Compound Annual Growth Rate (CAGR) for the forecast period (2025-2033) is an impressive 5.5%, translating into a market value expected to reach over $25,000 million by 2033. Market penetration is steadily increasing across all segments, particularly in emerging economies where tennis participation is on the rise. Technological disruptions are playing a pivotal role, with advancements in racquet string tension technology, aerodynamic frame designs, and the integration of smart sensors for performance tracking offering new avenues for growth. Consumer preferences are evolving towards performance-enhancing equipment, sustainable and eco-friendly apparel options, and personalized footwear solutions. The athletic contest segment continues to be the largest application, supported by a robust professional circuit and a growing amateur player base. The entertainment aspect of tennis, including recreational play and spectating, also contributes substantially to market demand. Competitive dynamics are characterized by intense innovation, aggressive marketing strategies, and strategic partnerships with athletes and federations. The rise of e-commerce platforms has also democratized market access, enabling smaller brands to reach a global audience. The increasing investment in tennis infrastructure globally, from public courts to private academies, further fuels the demand for high-quality tennis products. This sustained growth is a testament to the sport's enduring appeal and the industry's ability to adapt to evolving consumer needs and technological advancements.
Leading Markets & Segments in Tennis Products
The Athletic Contest application segment is the dominant force in the global tennis products market, consistently accounting for over 65% of the total market value. This dominance is propelled by the professional tennis circuit, including Grand Slam tournaments and ATP/WTA tours, which generate immense demand for high-performance equipment and apparel. The increasing number of amateur players participating in local and national competitions further amplifies this segment's significance.
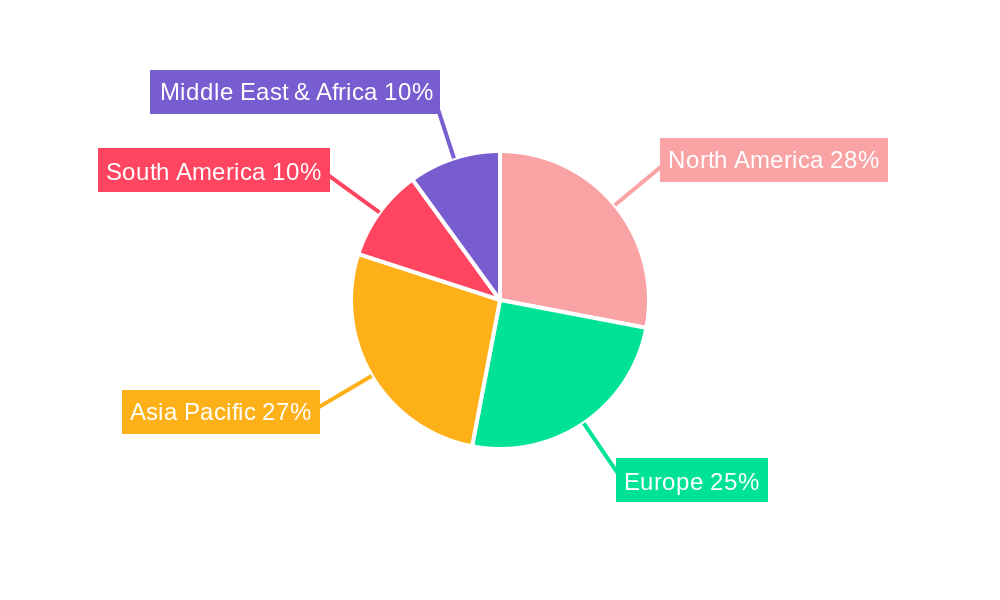
- Dominant Region: North America, particularly the United States, remains the leading market due to its well-established tennis infrastructure, high disposable incomes, and a large base of active tennis players. Europe, with its strong tennis heritage and numerous professional tournaments, follows closely.
- Dominant Country: The United States leads in terms of market size and consumption, driven by strong retail networks and a significant participation rate.
- Dominant Type: The Racquet segment is the largest within the tennis products market, contributing over 30% of the total revenue. This is followed by Tennis Shoes (approximately 25%) and Apparel (around 20%).
Key drivers contributing to the dominance of these segments and regions include:
- Economic Policies: Favorable economic conditions and government support for sports development in key regions foster increased spending on sporting goods.
- Infrastructure Development: The widespread availability of tennis courts, training academies, and sporting facilities in North America and Europe significantly boosts participation and, consequently, product demand.
- Consumer Preferences: A growing emphasis on health and fitness, coupled with the aspirational influence of professional athletes, drives demand for premium and performance-oriented tennis products.
- Technological Advancements: Continuous innovation in racquet technology, shoe cushioning, and apparel fabrics creates a demand for newer, more advanced products.
- Marketing and Sponsorships: High-profile sponsorships of tournaments and athletes by leading brands like Nike, Adidas, HEAD, and Wilson create significant market visibility and consumer desire.
Tennis Products Product Developments
Product innovation in tennis is relentless, focusing on enhancing player performance and comfort. Racquets are evolving with advanced materials like carbon composites and aerodynamic designs, offering improved power and spin. Tennis shoes feature enhanced cushioning, stability, and durability, with brands like ASICS and Nike leading the charge. Apparel incorporates moisture-wicking fabrics, UV protection, and lightweight designs for optimal play in various conditions. Grips and accessories are seeing innovations in vibration dampening and ergonomic designs. These developments provide competitive advantages by catering to specific player needs and performance goals, driving market growth.
Key Drivers of Tennis Products Growth
The tennis products market is propelled by several key drivers. Technological advancements in material science and design for racquets, apparel, and footwear continue to enhance performance and player experience. The growing popularity of tennis as a fitness and recreational activity, particularly among millennials and Gen Z, significantly expands the consumer base. Increased disposable income in developing economies allows more individuals to invest in sporting goods. Furthermore, strategic marketing campaigns and celebrity endorsements by major brands like Wilson and Babolat amplify brand visibility and consumer demand.
Challenges in the Tennis Products Market
Despite robust growth, the tennis products market faces several challenges. Intense competition among established brands and emerging players can lead to price wars and reduced profit margins. Supply chain disruptions, as seen in recent years, can impact production timelines and raw material availability, leading to increased costs. Stringent product quality and safety regulations in certain regions can add to compliance expenses. Additionally, seasonal demand fluctuations and the high cost of specialized equipment can be barriers for new entrants and amateur players.
Emerging Opportunities in Tennis Products
Catalysts for long-term growth in the tennis products market are numerous. Technological breakthroughs in smart racquets and wearable fitness trackers present exciting avenues for data-driven performance enhancement. Strategic partnerships between equipment manufacturers and sports science institutions can lead to revolutionary product designs. Market expansion into emerging economies with growing middle classes and increasing interest in sports offers significant untapped potential. The rising trend of sustainable and eco-friendly sporting goods also presents a considerable opportunity for brands that can align their production and product offerings with environmental consciousness.
Leading Players in the Tennis Products Sector
- HEAD
- Wilson
- Babolat
- Yonex
- Dunlop Sports Group
- Prince Sports
- Tecnifibre
- ASICS
- Gamma
- PACIFIC
- Amer Sports
- ProKennex
- Solinco
- Nike
- Adidas
Key Milestones in Tennis Products Industry
- 2019: Launch of advanced graphite composite racquets by HEAD, enhancing durability and power.
- 2020: Wilson introduces smart tennis racquets with integrated sensors for performance tracking.
- 2021: Babolat expands its range of eco-friendly tennis strings, responding to sustainability trends.
- 2022: ASICS launches innovative tennis shoe models with enhanced sole technology for improved court grip and agility.
- 2023: Yonex sees significant market traction for its lightweight, high-performance apparel lines.
- 2024: Amer Sports completes a strategic acquisition, broadening its portfolio in the tennis accessories segment.
Strategic Outlook for Tennis Products Market
The strategic outlook for the tennis products market remains exceptionally positive, driven by sustained innovation and expanding global participation. Future growth accelerators will include the further integration of smart technologies for personalized training insights, a continued focus on sustainable product development, and aggressive market penetration strategies in regions like Asia-Pacific. Brands that can effectively leverage digital marketing channels, forge strong endorsements with emerging tennis stars, and adapt to evolving consumer preferences for customizable and eco-conscious products will secure a dominant position in this thriving market. The estimated market value is projected to continue its upward trajectory, presenting lucrative opportunities for stakeholders.
Tennis Products Segmentation
-
1. Application
- 1.1. Entertainment
- 1.2. Athletic Contest
- 1.3. Others
-
2. Types
- 2.1. Racquet
- 2.2. Apparel
- 2.3. Tennis Shoes
- 2.4. Tennis Bags
- 2.5. Grips & Accessories
- 2.6. Others
Tennis Products Segmentation By Geography
-
1. North America
- 1.1. United States
- 1.2. Canada
- 1.3. Mexico
-
2. South America
- 2.1. Brazil
- 2.2. Argentina
- 2.3. Rest of South America
-
3. Europe
- 3.1. United Kingdom
- 3.2. Germany
- 3.3. France
- 3.4. Italy
- 3.5. Spain
- 3.6. Russia
- 3.7. Benelux
- 3.8. Nordics
- 3.9. Rest of Europe
-
4. Middle East & Africa
- 4.1. Turkey
- 4.2. Israel
- 4.3. GCC
- 4.4. North Africa
- 4.5. South Africa
- 4.6. Rest of Middle East & Africa
-
5. Asia Pacific
- 5.1. China
- 5.2. India
- 5.3. Japan
- 5.4. South Korea
- 5.5. ASEAN
- 5.6. Oceania
- 5.7. Rest of Asia Pacific
Tennis Products REPORT HIGHLIGHTS
| Aspects | Details |
|---|---|
| Study Period | 2019-2033 |
| Base Year | 2024 |
| Estimated Year | 2025 |
| Forecast Period | 2025-2033 |
| Historical Period | 2019-2024 |
| Growth Rate | CAGR of XX% from 2019-2033 |
| Segmentation |
|
Table of Contents
- 1. Introduction
- 1.1. Research Scope
- 1.2. Market Segmentation
- 1.3. Research Methodology
- 1.4. Definitions and Assumptions
- 2. Executive Summary
- 2.1. Introduction
- 3. Market Dynamics
- 3.1. Introduction
- 3.2. Market Drivers
- 3.3. Market Restrains
- 3.4. Market Trends
- 4. Market Factor Analysis
- 4.1. Porters Five Forces
- 4.2. Supply/Value Chain
- 4.3. PESTEL analysis
- 4.4. Market Entropy
- 4.5. Patent/Trademark Analysis
- 5. Global Tennis Products Analysis, Insights and Forecast, 2019-2031
- 5.1. Market Analysis, Insights and Forecast - by Application
- 5.1.1. Entertainment
- 5.1.2. Athletic Contest
- 5.1.3. Others
- 5.2. Market Analysis, Insights and Forecast - by Types
- 5.2.1. Racquet
- 5.2.2. Apparel
- 5.2.3. Tennis Shoes
- 5.2.4. Tennis Bags
- 5.2.5. Grips & Accessories
- 5.2.6. Others
- 5.3. Market Analysis, Insights and Forecast - by Region
- 5.3.1. North America
- 5.3.2. South America
- 5.3.3. Europe
- 5.3.4. Middle East & Africa
- 5.3.5. Asia Pacific
- 5.1. Market Analysis, Insights and Forecast - by Application
- 6. North America Tennis Products Analysis, Insights and Forecast, 2019-2031
- 6.1. Market Analysis, Insights and Forecast - by Application
- 6.1.1. Entertainment
- 6.1.2. Athletic Contest
- 6.1.3. Others
- 6.2. Market Analysis, Insights and Forecast - by Types
- 6.2.1. Racquet
- 6.2.2. Apparel
- 6.2.3. Tennis Shoes
- 6.2.4. Tennis Bags
- 6.2.5. Grips & Accessories
- 6.2.6. Others
- 6.1. Market Analysis, Insights and Forecast - by Application
- 7. South America Tennis Products Analysis, Insights and Forecast, 2019-2031
- 7.1. Market Analysis, Insights and Forecast - by Application
- 7.1.1. Entertainment
- 7.1.2. Athletic Contest
- 7.1.3. Others
- 7.2. Market Analysis, Insights and Forecast - by Types
- 7.2.1. Racquet
- 7.2.2. Apparel
- 7.2.3. Tennis Shoes
- 7.2.4. Tennis Bags
- 7.2.5. Grips & Accessories
- 7.2.6. Others
- 7.1. Market Analysis, Insights and Forecast - by Application
- 8. Europe Tennis Products Analysis, Insights and Forecast, 2019-2031
- 8.1. Market Analysis, Insights and Forecast - by Application
- 8.1.1. Entertainment
- 8.1.2. Athletic Contest
- 8.1.3. Others
- 8.2. Market Analysis, Insights and Forecast - by Types
- 8.2.1. Racquet
- 8.2.2. Apparel
- 8.2.3. Tennis Shoes
- 8.2.4. Tennis Bags
- 8.2.5. Grips & Accessories
- 8.2.6. Others
- 8.1. Market Analysis, Insights and Forecast - by Application
- 9. Middle East & Africa Tennis Products Analysis, Insights and Forecast, 2019-2031
- 9.1. Market Analysis, Insights and Forecast - by Application
- 9.1.1. Entertainment
- 9.1.2. Athletic Contest
- 9.1.3. Others
- 9.2. Market Analysis, Insights and Forecast - by Types
- 9.2.1. Racquet
- 9.2.2. Apparel
- 9.2.3. Tennis Shoes
- 9.2.4. Tennis Bags
- 9.2.5. Grips & Accessories
- 9.2.6. Others
- 9.1. Market Analysis, Insights and Forecast - by Application
- 10. Asia Pacific Tennis Products Analysis, Insights and Forecast, 2019-2031
- 10.1. Market Analysis, Insights and Forecast - by Application
- 10.1.1. Entertainment
- 10.1.2. Athletic Contest
- 10.1.3. Others
- 10.2. Market Analysis, Insights and Forecast - by Types
- 10.2.1. Racquet
- 10.2.2. Apparel
- 10.2.3. Tennis Shoes
- 10.2.4. Tennis Bags
- 10.2.5. Grips & Accessories
- 10.2.6. Others
- 10.1. Market Analysis, Insights and Forecast - by Application
- 11. Competitive Analysis
- 11.1. Global Market Share Analysis 2024
- 11.2. Company Profiles
- 11.2.1 HEAD
- 11.2.1.1. Overview
- 11.2.1.2. Products
- 11.2.1.3. SWOT Analysis
- 11.2.1.4. Recent Developments
- 11.2.1.5. Financials (Based on Availability)
- 11.2.2 Wilson
- 11.2.2.1. Overview
- 11.2.2.2. Products
- 11.2.2.3. SWOT Analysis
- 11.2.2.4. Recent Developments
- 11.2.2.5. Financials (Based on Availability)
- 11.2.3 Babolat
- 11.2.3.1. Overview
- 11.2.3.2. Products
- 11.2.3.3. SWOT Analysis
- 11.2.3.4. Recent Developments
- 11.2.3.5. Financials (Based on Availability)
- 11.2.4 Yonex
- 11.2.4.1. Overview
- 11.2.4.2. Products
- 11.2.4.3. SWOT Analysis
- 11.2.4.4. Recent Developments
- 11.2.4.5. Financials (Based on Availability)
- 11.2.5 Dunlop Sports Group
- 11.2.5.1. Overview
- 11.2.5.2. Products
- 11.2.5.3. SWOT Analysis
- 11.2.5.4. Recent Developments
- 11.2.5.5. Financials (Based on Availability)
- 11.2.6 Prince Sports
- 11.2.6.1. Overview
- 11.2.6.2. Products
- 11.2.6.3. SWOT Analysis
- 11.2.6.4. Recent Developments
- 11.2.6.5. Financials (Based on Availability)
- 11.2.7 Tecnifibre
- 11.2.7.1. Overview
- 11.2.7.2. Products
- 11.2.7.3. SWOT Analysis
- 11.2.7.4. Recent Developments
- 11.2.7.5. Financials (Based on Availability)
- 11.2.8 ASICS
- 11.2.8.1. Overview
- 11.2.8.2. Products
- 11.2.8.3. SWOT Analysis
- 11.2.8.4. Recent Developments
- 11.2.8.5. Financials (Based on Availability)
- 11.2.9 Gamma
- 11.2.9.1. Overview
- 11.2.9.2. Products
- 11.2.9.3. SWOT Analysis
- 11.2.9.4. Recent Developments
- 11.2.9.5. Financials (Based on Availability)
- 11.2.10 Tecnifibre
- 11.2.10.1. Overview
- 11.2.10.2. Products
- 11.2.10.3. SWOT Analysis
- 11.2.10.4. Recent Developments
- 11.2.10.5. Financials (Based on Availability)
- 11.2.11 PACIFIC
- 11.2.11.1. Overview
- 11.2.11.2. Products
- 11.2.11.3. SWOT Analysis
- 11.2.11.4. Recent Developments
- 11.2.11.5. Financials (Based on Availability)
- 11.2.12 Amer Sports
- 11.2.12.1. Overview
- 11.2.12.2. Products
- 11.2.12.3. SWOT Analysis
- 11.2.12.4. Recent Developments
- 11.2.12.5. Financials (Based on Availability)
- 11.2.13 ProKennex
- 11.2.13.1. Overview
- 11.2.13.2. Products
- 11.2.13.3. SWOT Analysis
- 11.2.13.4. Recent Developments
- 11.2.13.5. Financials (Based on Availability)
- 11.2.14 Solinco
- 11.2.14.1. Overview
- 11.2.14.2. Products
- 11.2.14.3. SWOT Analysis
- 11.2.14.4. Recent Developments
- 11.2.14.5. Financials (Based on Availability)
- 11.2.15 Nike
- 11.2.15.1. Overview
- 11.2.15.2. Products
- 11.2.15.3. SWOT Analysis
- 11.2.15.4. Recent Developments
- 11.2.15.5. Financials (Based on Availability)
- 11.2.16 Adidas
- 11.2.16.1. Overview
- 11.2.16.2. Products
- 11.2.16.3. SWOT Analysis
- 11.2.16.4. Recent Developments
- 11.2.16.5. Financials (Based on Availability)
- 11.2.1 HEAD
List of Figures
- Figure 1: Global Tennis Products Revenue Breakdown (million, %) by Region 2024 & 2032
- Figure 2: North America Tennis Products Revenue (million), by Application 2024 & 2032
- Figure 3: North America Tennis Products Revenue Share (%), by Application 2024 & 2032
- Figure 4: North America Tennis Products Revenue (million), by Types 2024 & 2032
- Figure 5: North America Tennis Products Revenue Share (%), by Types 2024 & 2032
- Figure 6: North America Tennis Products Revenue (million), by Country 2024 & 2032
- Figure 7: North America Tennis Products Revenue Share (%), by Country 2024 & 2032
- Figure 8: South America Tennis Products Revenue (million), by Application 2024 & 2032
- Figure 9: South America Tennis Products Revenue Share (%), by Application 2024 & 2032
- Figure 10: South America Tennis Products Revenue (million), by Types 2024 & 2032
- Figure 11: South America Tennis Products Revenue Share (%), by Types 2024 & 2032
- Figure 12: South America Tennis Products Revenue (million), by Country 2024 & 2032
- Figure 13: South America Tennis Products Revenue Share (%), by Country 2024 & 2032
- Figure 14: Europe Tennis Products Revenue (million), by Application 2024 & 2032
- Figure 15: Europe Tennis Products Revenue Share (%), by Application 2024 & 2032
- Figure 16: Europe Tennis Products Revenue (million), by Types 2024 & 2032
- Figure 17: Europe Tennis Products Revenue Share (%), by Types 2024 & 2032
- Figure 18: Europe Tennis Products Revenue (million), by Country 2024 & 2032
- Figure 19: Europe Tennis Products Revenue Share (%), by Country 2024 & 2032
- Figure 20: Middle East & Africa Tennis Products Revenue (million), by Application 2024 & 2032
- Figure 21: Middle East & Africa Tennis Products Revenue Share (%), by Application 2024 & 2032
- Figure 22: Middle East & Africa Tennis Products Revenue (million), by Types 2024 & 2032
- Figure 23: Middle East & Africa Tennis Products Revenue Share (%), by Types 2024 & 2032
- Figure 24: Middle East & Africa Tennis Products Revenue (million), by Country 2024 & 2032
- Figure 25: Middle East & Africa Tennis Products Revenue Share (%), by Country 2024 & 2032
- Figure 26: Asia Pacific Tennis Products Revenue (million), by Application 2024 & 2032
- Figure 27: Asia Pacific Tennis Products Revenue Share (%), by Application 2024 & 2032
- Figure 28: Asia Pacific Tennis Products Revenue (million), by Types 2024 & 2032
- Figure 29: Asia Pacific Tennis Products Revenue Share (%), by Types 2024 & 2032
- Figure 30: Asia Pacific Tennis Products Revenue (million), by Country 2024 & 2032
- Figure 31: Asia Pacific Tennis Products Revenue Share (%), by Country 2024 & 2032
List of Tables
- Table 1: Global Tennis Products Revenue million Forecast, by Region 2019 & 2032
- Table 2: Global Tennis Products Revenue million Forecast, by Application 2019 & 2032
- Table 3: Global Tennis Products Revenue million Forecast, by Types 2019 & 2032
- Table 4: Global Tennis Products Revenue million Forecast, by Region 2019 & 2032
- Table 5: Global Tennis Products Revenue million Forecast, by Application 2019 & 2032
- Table 6: Global Tennis Products Revenue million Forecast, by Types 2019 & 2032
- Table 7: Global Tennis Products Revenue million Forecast, by Country 2019 & 2032
- Table 8: United States Tennis Products Revenue (million) Forecast, by Application 2019 & 2032
- Table 9: Canada Tennis Products Revenue (million) Forecast, by Application 2019 & 2032
- Table 10: Mexico Tennis Products Revenue (million) Forecast, by Application 2019 & 2032
- Table 11: Global Tennis Products Revenue million Forecast, by Application 2019 & 2032
- Table 12: Global Tennis Products Revenue million Forecast, by Types 2019 & 2032
- Table 13: Global Tennis Products Revenue million Forecast, by Country 2019 & 2032
- Table 14: Brazil Tennis Products Revenue (million) Forecast, by Application 2019 & 2032
- Table 15: Argentina Tennis Products Revenue (million) Forecast, by Application 2019 & 2032
- Table 16: Rest of South America Tennis Products Revenue (million) Forecast, by Application 2019 & 2032
- Table 17: Global Tennis Products Revenue million Forecast, by Application 2019 & 2032
- Table 18: Global Tennis Products Revenue million Forecast, by Types 2019 & 2032
- Table 19: Global Tennis Products Revenue million Forecast, by Country 2019 & 2032
- Table 20: United Kingdom Tennis Products Revenue (million) Forecast, by Application 2019 & 2032
- Table 21: Germany Tennis Products Revenue (million) Forecast, by Application 2019 & 2032
- Table 22: France Tennis Products Revenue (million) Forecast, by Application 2019 & 2032
- Table 23: Italy Tennis Products Revenue (million) Forecast, by Application 2019 & 2032
- Table 24: Spain Tennis Products Revenue (million) Forecast, by Application 2019 & 2032
- Table 25: Russia Tennis Products Revenue (million) Forecast, by Application 2019 & 2032
- Table 26: Benelux Tennis Products Revenue (million) Forecast, by Application 2019 & 2032
- Table 27: Nordics Tennis Products Revenue (million) Forecast, by Application 2019 & 2032
- Table 28: Rest of Europe Tennis Products Revenue (million) Forecast, by Application 2019 & 2032
- Table 29: Global Tennis Products Revenue million Forecast, by Application 2019 & 2032
- Table 30: Global Tennis Products Revenue million Forecast, by Types 2019 & 2032
- Table 31: Global Tennis Products Revenue million Forecast, by Country 2019 & 2032
- Table 32: Turkey Tennis Products Revenue (million) Forecast, by Application 2019 & 2032
- Table 33: Israel Tennis Products Revenue (million) Forecast, by Application 2019 & 2032
- Table 34: GCC Tennis Products Revenue (million) Forecast, by Application 2019 & 2032
- Table 35: North Africa Tennis Products Revenue (million) Forecast, by Application 2019 & 2032
- Table 36: South Africa Tennis Products Revenue (million) Forecast, by Application 2019 & 2032
- Table 37: Rest of Middle East & Africa Tennis Products Revenue (million) Forecast, by Application 2019 & 2032
- Table 38: Global Tennis Products Revenue million Forecast, by Application 2019 & 2032
- Table 39: Global Tennis Products Revenue million Forecast, by Types 2019 & 2032
- Table 40: Global Tennis Products Revenue million Forecast, by Country 2019 & 2032
- Table 41: China Tennis Products Revenue (million) Forecast, by Application 2019 & 2032
- Table 42: India Tennis Products Revenue (million) Forecast, by Application 2019 & 2032
- Table 43: Japan Tennis Products Revenue (million) Forecast, by Application 2019 & 2032
- Table 44: South Korea Tennis Products Revenue (million) Forecast, by Application 2019 & 2032
- Table 45: ASEAN Tennis Products Revenue (million) Forecast, by Application 2019 & 2032
- Table 46: Oceania Tennis Products Revenue (million) Forecast, by Application 2019 & 2032
- Table 47: Rest of Asia Pacific Tennis Products Revenue (million) Forecast, by Application 2019 & 2032
Frequently Asked Questions
1. What is the projected Compound Annual Growth Rate (CAGR) of the Tennis Products?
The projected CAGR is approximately XX%.
2. Which companies are prominent players in the Tennis Products?
Key companies in the market include HEAD, Wilson, Babolat, Yonex, Dunlop Sports Group, Prince Sports, Tecnifibre, ASICS, Gamma, Tecnifibre, PACIFIC, Amer Sports, ProKennex, Solinco, Nike, Adidas.
3. What are the main segments of the Tennis Products?
The market segments include Application, Types.
4. Can you provide details about the market size?
The market size is estimated to be USD XXX million as of 2022.
5. What are some drivers contributing to market growth?
N/A
6. What are the notable trends driving market growth?
N/A
7. Are there any restraints impacting market growth?
N/A
8. Can you provide examples of recent developments in the market?
N/A
9. What pricing options are available for accessing the report?
Pricing options include single-user, multi-user, and enterprise licenses priced at USD 4900.00, USD 7350.00, and USD 9800.00 respectively.
10. Is the market size provided in terms of value or volume?
The market size is provided in terms of value, measured in million.
11. Are there any specific market keywords associated with the report?
Yes, the market keyword associated with the report is "Tennis Products," which aids in identifying and referencing the specific market segment covered.
12. How do I determine which pricing option suits my needs best?
The pricing options vary based on user requirements and access needs. Individual users may opt for single-user licenses, while businesses requiring broader access may choose multi-user or enterprise licenses for cost-effective access to the report.
13. Are there any additional resources or data provided in the Tennis Products report?
While the report offers comprehensive insights, it's advisable to review the specific contents or supplementary materials provided to ascertain if additional resources or data are available.
14. How can I stay updated on further developments or reports in the Tennis Products?
To stay informed about further developments, trends, and reports in the Tennis Products, consider subscribing to industry newsletters, following relevant companies and organizations, or regularly checking reputable industry news sources and publications.
Methodology
Step 1 - Identification of Relevant Samples Size from Population Database


Step 2 - Approaches for Defining Global Market Size (Value, Volume* & Price*)

Note*: In applicable scenarios
Step 3 - Data Sources
Primary Research
- Web Analytics
- Survey Reports
- Research Institute
- Latest Research Reports
- Opinion Leaders
Secondary Research
- Annual Reports
- White Paper
- Latest Press Release
- Industry Association
- Paid Database
- Investor Presentations

Step 4 - Data Triangulation
Involves using different sources of information in order to increase the validity of a study
These sources are likely to be stakeholders in a program - participants, other researchers, program staff, other community members, and so on.
Then we put all data in single framework & apply various statistical tools to find out the dynamic on the market.
During the analysis stage, feedback from the stakeholder groups would be compared to determine areas of agreement as well as areas of divergence
