

Key Insights
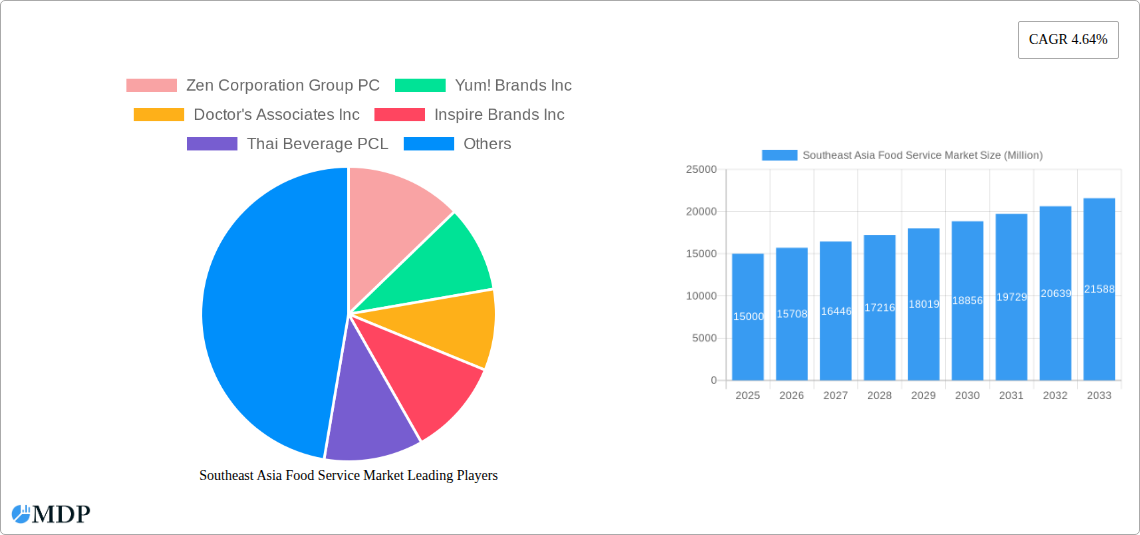
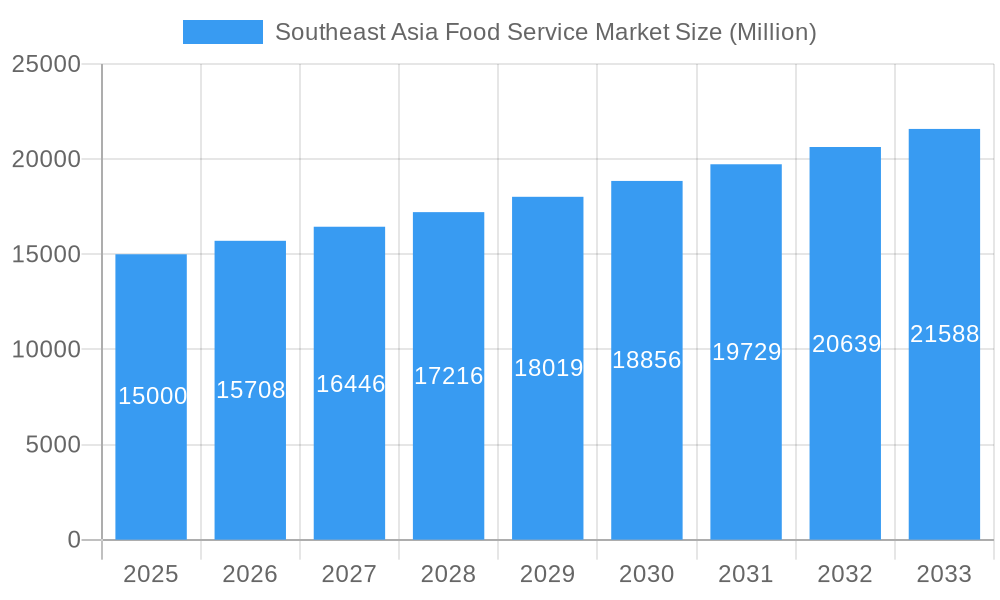
The Southeast Asia food service market, including cafes, bars, and quick-service restaurants (QSRs), is experiencing substantial growth. This expansion is propelled by a growing middle class with rising disposable incomes, driving demand for varied dining options in rapidly urbanizing nations such as Indonesia, Malaysia, the Philippines, Singapore, Thailand, and Vietnam. A young, tech-savvy demographic's embrace of food delivery apps and online ordering further stimulates market development. Tourism also significantly contributes to increased foot traffic and revenue in key travel destinations. The market is characterized by a competitive yet dynamic environment featuring both established international brands and successful local enterprises. Despite challenges like volatile food prices and intense competition, the overall market outlook is positive.
Southeast Asia Food Service Market Market Size (In Billion)
In terms of segmentation, chained outlets are anticipated to retain a dominant market share due to strong brand recognition and robust supply chains. Conversely, independent outlets present significant growth potential, offering distinct culinary experiences and catering to niche market demands. Location-wise, retail and leisure venues demonstrate high demand, with stand-alone establishments and those near lodging facilities also contributing substantially. While specific country-level data is not detailed, Indonesia, Malaysia, the Philippines, Thailand, and Vietnam are projected to constitute the largest markets within Southeast Asia, attributed to their substantial populations and economic development. The sustained 4.64% CAGR signals a stable and enduring growth trajectory, making this an attractive market for both established and emerging businesses. Strategic alliances and brand collaborations are also poised to significantly influence the future of the foodservice sector in the region.
Southeast Asia Food Service Market Company Market Share
Southeast Asia Food Service Market: A Comprehensive Report (2019-2033)
This in-depth report provides a comprehensive analysis of the Southeast Asia food service market, offering invaluable insights for industry stakeholders, investors, and businesses seeking to capitalize on this dynamic sector. With a study period spanning 2019-2033, a base year of 2025, and a forecast period of 2025-2033, this report meticulously examines market trends, competitive landscapes, and growth opportunities across six key countries: Indonesia, Malaysia, Philippines, Singapore, Thailand, and Vietnam, along with the Rest of Southeast Asia. The market size is projected to reach xx Million by 2033.
Southeast Asia Food Service Market Market Dynamics & Concentration
The Southeast Asia food service market exhibits a complex interplay of factors driving its growth and evolution. Market concentration is relatively high, with a few large players like Jollibee Foods Corporation and McDonald's Corporation holding significant market share. However, the presence of numerous smaller, independent outlets contributes to a diverse market landscape. Innovation, particularly in QSR (Quick Service Restaurant) offerings and technological integration (e.g., online ordering and delivery platforms), is a crucial driver. Regulatory frameworks, varying across countries, significantly influence operations and expansion plans. Product substitutes, such as home-cooked meals and meal delivery services, exert competitive pressure. End-user trends, including the rising preference for healthier options and diverse cuisines, continuously reshape market demand. M&A activity remains significant, with an estimated xx M&A deals recorded between 2019 and 2024, indicating consolidation and expansion strategies by major players. Market share data reveals that the top 5 players account for approximately xx% of the market, indicating a moderately concentrated market structure.
- Key Dynamics: Innovation, Regulation, Competition, Consumer Preferences, M&A
- Metrics: Market Share (Top 5 players: xx%), M&A Deal Count (2019-2024: xx)
Southeast Asia Food Service Market Industry Trends & Analysis
The Southeast Asia food service market is experiencing robust growth, driven by several key factors. Rising disposable incomes, particularly among the burgeoning middle class, fuel increased spending on food away from home. Rapid urbanization and population growth contribute to expanding consumer base. Technological disruptions, such as the proliferation of online food delivery platforms and mobile payment systems, transform consumer behavior and market access. Changing consumer preferences, including a greater demand for convenience, diverse culinary experiences, and healthier options, shape product offerings. Intense competition among established players and emerging brands drives innovation and pricing strategies. The market's CAGR from 2019 to 2024 was approximately xx%, and is projected to reach xx% by 2033. Market penetration of online food delivery services has reached xx% in major urban areas. This indicates significant potential for further expansion in this segment.
Leading Markets & Segments in Southeast Asia Food Service Market
Indonesia and the Philippines emerge as dominant markets, driven by high population density, increasing disposable incomes, and favorable regulatory environments. Within the market segmentation, chained outlets dominate in terms of revenue share compared to independent outlets. Standalone locations are more prevalent compared to others. The Retail location segment significantly contributes to the overall revenue.
Key Drivers (Indonesia & Philippines): Rapid economic growth, high population density, expanding middle class, positive government policies supporting the food service sector.
Dominant Segments: Chained Outlets, Standalone Locations, Retail Locations
Country Dominance: Indonesia, Philippines
Outlet Dominance: Chained Outlets
Location Dominance: Retail Locations, Standalone
Southeast Asia Food Service Market Product Developments
Product innovation is a key aspect of competitive differentiation in this market. Companies are focusing on customized offerings, healthier choices, and unique culinary experiences to appeal to diverse consumer preferences. Technological integration is improving operational efficiency and enhancing the customer experience through features like mobile ordering, personalized recommendations, and loyalty programs. These trends collectively contribute to a more dynamic and responsive market.
Key Drivers of Southeast Asia Food Service Market Growth
Several factors fuel the growth of the Southeast Asia food service market. Firstly, rising disposable incomes and a growing middle class increase spending on food services. Secondly, rapid urbanization leads to higher demand for convenient dining options. Thirdly, technological advancements in online ordering and delivery platforms significantly enhance market access and convenience. Finally, government support and favorable regulatory environments in some countries facilitate market expansion.
Challenges in the Southeast Asia Food Service Market Market
The Southeast Asia food service market faces several hurdles. Varying regulatory frameworks across countries create complexities for businesses operating regionally. Supply chain disruptions can impact operations and costs. Intense competition among established and emerging players leads to pricing pressures and the need for continuous innovation.
Emerging Opportunities in Southeast Asia Food Service Market
The Southeast Asia food service market presents significant opportunities for long-term growth. Expanding into untapped markets within the region, strategic partnerships with local businesses, and embracing technological innovation are promising strategies. Leveraging data analytics for personalized offerings, enhancing sustainability efforts, and focusing on healthier options will be pivotal for future success.
Leading Players in the Southeast Asia Food Service Market Sector
- Jollibee Foods Corporation
- McDonald's Corporation
- Starbucks Corporation
- Yum! Brands Inc
- Inspire Brands Inc
- Zen Corporation Group PC
- Doctor's Associates Inc
- Thai Beverage PCL
- Nando's Group Holdings Limited
- The Wendy's Company
- Secret Recipe Cakes & Café Sdn Bhd
- Tung Lok Restaurants (2000) Ltd
- Domino's Pizza Enterprises Ltd
- Marrybrown Sdn Bhd
- Minor International PCL
- Restaurant Brands International Inc
Key Milestones in Southeast Asia Food Service Market Industry
- May 2023: Starbucks inaugurated a new rustic-style store in Bird Paradise, Philippines.
- May 2023: Inspire Brands, Inc. launched new butter variants for its Butternut product line.
- October 2023: Starbucks launched two new ice cream-based drinks in the Philippines.
Strategic Outlook for Southeast Asia Food Service Market Market
The Southeast Asia food service market holds immense potential for future growth. Strategic investments in technology, expansion into less-penetrated areas, and a focus on adapting to evolving consumer preferences are key to success. The increasing adoption of digital technologies and the rise of innovative business models will shape the market's trajectory.
Southeast Asia Food Service Market Segmentation
-
1. Foodservice Type
-
1.1. Cafes & Bars
-
1.1.1. By Cuisine
- 1.1.1.1. Bars & Pubs
- 1.1.1.2. Juice/Smoothie/Desserts Bars
- 1.1.1.3. Specialist Coffee & Tea Shops
-
1.1.1. By Cuisine
- 1.2. Cloud Kitchen
-
1.3. Full Service Restaurants
- 1.3.1. Asian
- 1.3.2. European
- 1.3.3. Latin American
- 1.3.4. Middle Eastern
- 1.3.5. North American
- 1.3.6. Other FSR Cuisines
-
1.4. Quick Service Restaurants
- 1.4.1. Bakeries
- 1.4.2. Burger
- 1.4.3. Ice Cream
- 1.4.4. Meat-based Cuisines
- 1.4.5. Pizza
- 1.4.6. Other QSR Cuisines
-
1.1. Cafes & Bars
-
2. Outlet
- 2.1. Chained Outlets
- 2.2. Independent Outlets
-
3. Location
- 3.1. Leisure
- 3.2. Lodging
- 3.3. Retail
- 3.4. Standalone
- 3.5. Travel
Southeast Asia Food Service Market Segmentation By Geography
-
1. North America
- 1.1. United States
- 1.2. Canada
- 1.3. Mexico
-
2. South America
- 2.1. Brazil
- 2.2. Argentina
- 2.3. Rest of South America
-
3. Europe
- 3.1. United Kingdom
- 3.2. Germany
- 3.3. France
- 3.4. Italy
- 3.5. Spain
- 3.6. Russia
- 3.7. Benelux
- 3.8. Nordics
- 3.9. Rest of Europe
-
4. Middle East & Africa
- 4.1. Turkey
- 4.2. Israel
- 4.3. GCC
- 4.4. North Africa
- 4.5. South Africa
- 4.6. Rest of Middle East & Africa
-
5. Asia Pacific
- 5.1. China
- 5.2. India
- 5.3. Japan
- 5.4. South Korea
- 5.5. ASEAN
- 5.6. Oceania
- 5.7. Rest of Asia Pacific
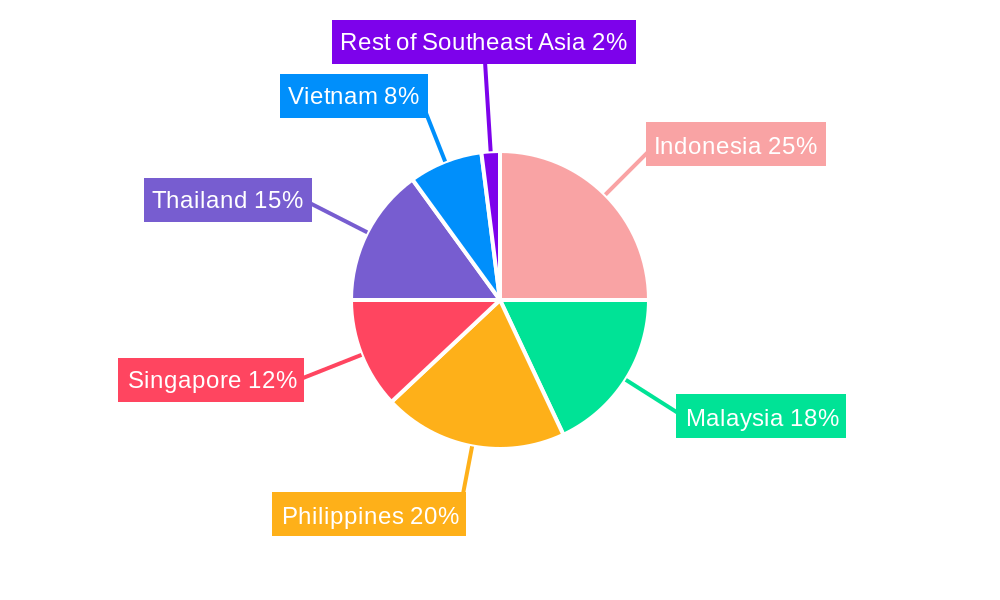
Southeast Asia Food Service Market Regional Market Share
Geographic Coverage of Southeast Asia Food Service Market
Southeast Asia Food Service Market REPORT HIGHLIGHTS
| Aspects | Details |
|---|---|
| Study Period | 2020-2034 |
| Base Year | 2025 |
| Estimated Year | 2026 |
| Forecast Period | 2026-2034 |
| Historical Period | 2020-2025 |
| Growth Rate | CAGR of 13.2% from 2020-2034 |
| Segmentation |
|
Table of Contents
- 1. Introduction
- 1.1. Research Scope
- 1.2. Market Segmentation
- 1.3. Research Methodology
- 1.4. Definitions and Assumptions
- 2. Executive Summary
- 2.1. Introduction
- 3. Market Dynamics
- 3.1. Introduction
- 3.2. Market Drivers
- 3.2.1. Growing Awareness of Functional Benefits of Carotenoids; Consumption of Health and Wellness Products
- 3.3. Market Restrains
- 3.3.1. High Processing Cost and Low Yield of Natural Food Colors
- 3.4. Market Trends
- 3.4.1. OTHER KEY INDUSTRY TRENDS COVERED IN THE REPORT
- 4. Market Factor Analysis
- 4.1. Porters Five Forces
- 4.2. Supply/Value Chain
- 4.3. PESTEL analysis
- 4.4. Market Entropy
- 4.5. Patent/Trademark Analysis
- 5. Global Southeast Asia Food Service Market Analysis, Insights and Forecast, 2020-2032
- 5.1. Market Analysis, Insights and Forecast - by Foodservice Type
- 5.1.1. Cafes & Bars
- 5.1.1.1. By Cuisine
- 5.1.1.1.1. Bars & Pubs
- 5.1.1.1.2. Juice/Smoothie/Desserts Bars
- 5.1.1.1.3. Specialist Coffee & Tea Shops
- 5.1.1.1. By Cuisine
- 5.1.2. Cloud Kitchen
- 5.1.3. Full Service Restaurants
- 5.1.3.1. Asian
- 5.1.3.2. European
- 5.1.3.3. Latin American
- 5.1.3.4. Middle Eastern
- 5.1.3.5. North American
- 5.1.3.6. Other FSR Cuisines
- 5.1.4. Quick Service Restaurants
- 5.1.4.1. Bakeries
- 5.1.4.2. Burger
- 5.1.4.3. Ice Cream
- 5.1.4.4. Meat-based Cuisines
- 5.1.4.5. Pizza
- 5.1.4.6. Other QSR Cuisines
- 5.1.1. Cafes & Bars
- 5.2. Market Analysis, Insights and Forecast - by Outlet
- 5.2.1. Chained Outlets
- 5.2.2. Independent Outlets
- 5.3. Market Analysis, Insights and Forecast - by Location
- 5.3.1. Leisure
- 5.3.2. Lodging
- 5.3.3. Retail
- 5.3.4. Standalone
- 5.3.5. Travel
- 5.4. Market Analysis, Insights and Forecast - by Region
- 5.4.1. North America
- 5.4.2. South America
- 5.4.3. Europe
- 5.4.4. Middle East & Africa
- 5.4.5. Asia Pacific
- 5.1. Market Analysis, Insights and Forecast - by Foodservice Type
- 6. North America Southeast Asia Food Service Market Analysis, Insights and Forecast, 2020-2032
- 6.1. Market Analysis, Insights and Forecast - by Foodservice Type
- 6.1.1. Cafes & Bars
- 6.1.1.1. By Cuisine
- 6.1.1.1.1. Bars & Pubs
- 6.1.1.1.2. Juice/Smoothie/Desserts Bars
- 6.1.1.1.3. Specialist Coffee & Tea Shops
- 6.1.1.1. By Cuisine
- 6.1.2. Cloud Kitchen
- 6.1.3. Full Service Restaurants
- 6.1.3.1. Asian
- 6.1.3.2. European
- 6.1.3.3. Latin American
- 6.1.3.4. Middle Eastern
- 6.1.3.5. North American
- 6.1.3.6. Other FSR Cuisines
- 6.1.4. Quick Service Restaurants
- 6.1.4.1. Bakeries
- 6.1.4.2. Burger
- 6.1.4.3. Ice Cream
- 6.1.4.4. Meat-based Cuisines
- 6.1.4.5. Pizza
- 6.1.4.6. Other QSR Cuisines
- 6.1.1. Cafes & Bars
- 6.2. Market Analysis, Insights and Forecast - by Outlet
- 6.2.1. Chained Outlets
- 6.2.2. Independent Outlets
- 6.3. Market Analysis, Insights and Forecast - by Location
- 6.3.1. Leisure
- 6.3.2. Lodging
- 6.3.3. Retail
- 6.3.4. Standalone
- 6.3.5. Travel
- 6.1. Market Analysis, Insights and Forecast - by Foodservice Type
- 7. South America Southeast Asia Food Service Market Analysis, Insights and Forecast, 2020-2032
- 7.1. Market Analysis, Insights and Forecast - by Foodservice Type
- 7.1.1. Cafes & Bars
- 7.1.1.1. By Cuisine
- 7.1.1.1.1. Bars & Pubs
- 7.1.1.1.2. Juice/Smoothie/Desserts Bars
- 7.1.1.1.3. Specialist Coffee & Tea Shops
- 7.1.1.1. By Cuisine
- 7.1.2. Cloud Kitchen
- 7.1.3. Full Service Restaurants
- 7.1.3.1. Asian
- 7.1.3.2. European
- 7.1.3.3. Latin American
- 7.1.3.4. Middle Eastern
- 7.1.3.5. North American
- 7.1.3.6. Other FSR Cuisines
- 7.1.4. Quick Service Restaurants
- 7.1.4.1. Bakeries
- 7.1.4.2. Burger
- 7.1.4.3. Ice Cream
- 7.1.4.4. Meat-based Cuisines
- 7.1.4.5. Pizza
- 7.1.4.6. Other QSR Cuisines
- 7.1.1. Cafes & Bars
- 7.2. Market Analysis, Insights and Forecast - by Outlet
- 7.2.1. Chained Outlets
- 7.2.2. Independent Outlets
- 7.3. Market Analysis, Insights and Forecast - by Location
- 7.3.1. Leisure
- 7.3.2. Lodging
- 7.3.3. Retail
- 7.3.4. Standalone
- 7.3.5. Travel
- 7.1. Market Analysis, Insights and Forecast - by Foodservice Type
- 8. Europe Southeast Asia Food Service Market Analysis, Insights and Forecast, 2020-2032
- 8.1. Market Analysis, Insights and Forecast - by Foodservice Type
- 8.1.1. Cafes & Bars
- 8.1.1.1. By Cuisine
- 8.1.1.1.1. Bars & Pubs
- 8.1.1.1.2. Juice/Smoothie/Desserts Bars
- 8.1.1.1.3. Specialist Coffee & Tea Shops
- 8.1.1.1. By Cuisine
- 8.1.2. Cloud Kitchen
- 8.1.3. Full Service Restaurants
- 8.1.3.1. Asian
- 8.1.3.2. European
- 8.1.3.3. Latin American
- 8.1.3.4. Middle Eastern
- 8.1.3.5. North American
- 8.1.3.6. Other FSR Cuisines
- 8.1.4. Quick Service Restaurants
- 8.1.4.1. Bakeries
- 8.1.4.2. Burger
- 8.1.4.3. Ice Cream
- 8.1.4.4. Meat-based Cuisines
- 8.1.4.5. Pizza
- 8.1.4.6. Other QSR Cuisines
- 8.1.1. Cafes & Bars
- 8.2. Market Analysis, Insights and Forecast - by Outlet
- 8.2.1. Chained Outlets
- 8.2.2. Independent Outlets
- 8.3. Market Analysis, Insights and Forecast - by Location
- 8.3.1. Leisure
- 8.3.2. Lodging
- 8.3.3. Retail
- 8.3.4. Standalone
- 8.3.5. Travel
- 8.1. Market Analysis, Insights and Forecast - by Foodservice Type
- 9. Middle East & Africa Southeast Asia Food Service Market Analysis, Insights and Forecast, 2020-2032
- 9.1. Market Analysis, Insights and Forecast - by Foodservice Type
- 9.1.1. Cafes & Bars
- 9.1.1.1. By Cuisine
- 9.1.1.1.1. Bars & Pubs
- 9.1.1.1.2. Juice/Smoothie/Desserts Bars
- 9.1.1.1.3. Specialist Coffee & Tea Shops
- 9.1.1.1. By Cuisine
- 9.1.2. Cloud Kitchen
- 9.1.3. Full Service Restaurants
- 9.1.3.1. Asian
- 9.1.3.2. European
- 9.1.3.3. Latin American
- 9.1.3.4. Middle Eastern
- 9.1.3.5. North American
- 9.1.3.6. Other FSR Cuisines
- 9.1.4. Quick Service Restaurants
- 9.1.4.1. Bakeries
- 9.1.4.2. Burger
- 9.1.4.3. Ice Cream
- 9.1.4.4. Meat-based Cuisines
- 9.1.4.5. Pizza
- 9.1.4.6. Other QSR Cuisines
- 9.1.1. Cafes & Bars
- 9.2. Market Analysis, Insights and Forecast - by Outlet
- 9.2.1. Chained Outlets
- 9.2.2. Independent Outlets
- 9.3. Market Analysis, Insights and Forecast - by Location
- 9.3.1. Leisure
- 9.3.2. Lodging
- 9.3.3. Retail
- 9.3.4. Standalone
- 9.3.5. Travel
- 9.1. Market Analysis, Insights and Forecast - by Foodservice Type
- 10. Asia Pacific Southeast Asia Food Service Market Analysis, Insights and Forecast, 2020-2032
- 10.1. Market Analysis, Insights and Forecast - by Foodservice Type
- 10.1.1. Cafes & Bars
- 10.1.1.1. By Cuisine
- 10.1.1.1.1. Bars & Pubs
- 10.1.1.1.2. Juice/Smoothie/Desserts Bars
- 10.1.1.1.3. Specialist Coffee & Tea Shops
- 10.1.1.1. By Cuisine
- 10.1.2. Cloud Kitchen
- 10.1.3. Full Service Restaurants
- 10.1.3.1. Asian
- 10.1.3.2. European
- 10.1.3.3. Latin American
- 10.1.3.4. Middle Eastern
- 10.1.3.5. North American
- 10.1.3.6. Other FSR Cuisines
- 10.1.4. Quick Service Restaurants
- 10.1.4.1. Bakeries
- 10.1.4.2. Burger
- 10.1.4.3. Ice Cream
- 10.1.4.4. Meat-based Cuisines
- 10.1.4.5. Pizza
- 10.1.4.6. Other QSR Cuisines
- 10.1.1. Cafes & Bars
- 10.2. Market Analysis, Insights and Forecast - by Outlet
- 10.2.1. Chained Outlets
- 10.2.2. Independent Outlets
- 10.3. Market Analysis, Insights and Forecast - by Location
- 10.3.1. Leisure
- 10.3.2. Lodging
- 10.3.3. Retail
- 10.3.4. Standalone
- 10.3.5. Travel
- 10.1. Market Analysis, Insights and Forecast - by Foodservice Type
- 11. Competitive Analysis
- 11.1. Global Market Share Analysis 2025
- 11.2. Company Profiles
- 11.2.1 Zen Corporation Group PC
- 11.2.1.1. Overview
- 11.2.1.2. Products
- 11.2.1.3. SWOT Analysis
- 11.2.1.4. Recent Developments
- 11.2.1.5. Financials (Based on Availability)
- 11.2.2 Yum! Brands Inc
- 11.2.2.1. Overview
- 11.2.2.2. Products
- 11.2.2.3. SWOT Analysis
- 11.2.2.4. Recent Developments
- 11.2.2.5. Financials (Based on Availability)
- 11.2.3 Doctor's Associates Inc
- 11.2.3.1. Overview
- 11.2.3.2. Products
- 11.2.3.3. SWOT Analysis
- 11.2.3.4. Recent Developments
- 11.2.3.5. Financials (Based on Availability)
- 11.2.4 Inspire Brands Inc
- 11.2.4.1. Overview
- 11.2.4.2. Products
- 11.2.4.3. SWOT Analysis
- 11.2.4.4. Recent Developments
- 11.2.4.5. Financials (Based on Availability)
- 11.2.5 Thai Beverage PCL
- 11.2.5.1. Overview
- 11.2.5.2. Products
- 11.2.5.3. SWOT Analysis
- 11.2.5.4. Recent Developments
- 11.2.5.5. Financials (Based on Availability)
- 11.2.6 Nando's Group Holdings Limited
- 11.2.6.1. Overview
- 11.2.6.2. Products
- 11.2.6.3. SWOT Analysis
- 11.2.6.4. Recent Developments
- 11.2.6.5. Financials (Based on Availability)
- 11.2.7 Jollibee Foods Corporation
- 11.2.7.1. Overview
- 11.2.7.2. Products
- 11.2.7.3. SWOT Analysis
- 11.2.7.4. Recent Developments
- 11.2.7.5. Financials (Based on Availability)
- 11.2.8 The Wendy's Company
- 11.2.8.1. Overview
- 11.2.8.2. Products
- 11.2.8.3. SWOT Analysis
- 11.2.8.4. Recent Developments
- 11.2.8.5. Financials (Based on Availability)
- 11.2.9 Secret Recipe Cakes & Café Sdn Bhd
- 11.2.9.1. Overview
- 11.2.9.2. Products
- 11.2.9.3. SWOT Analysis
- 11.2.9.4. Recent Developments
- 11.2.9.5. Financials (Based on Availability)
- 11.2.10 Tung Lok Restaurants (2000) Ltd
- 11.2.10.1. Overview
- 11.2.10.2. Products
- 11.2.10.3. SWOT Analysis
- 11.2.10.4. Recent Developments
- 11.2.10.5. Financials (Based on Availability)
- 11.2.11 Domino's Pizza Enterprises Ltd
- 11.2.11.1. Overview
- 11.2.11.2. Products
- 11.2.11.3. SWOT Analysis
- 11.2.11.4. Recent Developments
- 11.2.11.5. Financials (Based on Availability)
- 11.2.12 Starbucks Corporation
- 11.2.12.1. Overview
- 11.2.12.2. Products
- 11.2.12.3. SWOT Analysis
- 11.2.12.4. Recent Developments
- 11.2.12.5. Financials (Based on Availability)
- 11.2.13 Marrybrown Sdn Bhd
- 11.2.13.1. Overview
- 11.2.13.2. Products
- 11.2.13.3. SWOT Analysis
- 11.2.13.4. Recent Developments
- 11.2.13.5. Financials (Based on Availability)
- 11.2.14 Minor International PCL
- 11.2.14.1. Overview
- 11.2.14.2. Products
- 11.2.14.3. SWOT Analysis
- 11.2.14.4. Recent Developments
- 11.2.14.5. Financials (Based on Availability)
- 11.2.15 Restaurant Brands International Inc
- 11.2.15.1. Overview
- 11.2.15.2. Products
- 11.2.15.3. SWOT Analysis
- 11.2.15.4. Recent Developments
- 11.2.15.5. Financials (Based on Availability)
- 11.2.16 McDonald's Corporation
- 11.2.16.1. Overview
- 11.2.16.2. Products
- 11.2.16.3. SWOT Analysis
- 11.2.16.4. Recent Developments
- 11.2.16.5. Financials (Based on Availability)
- 11.2.1 Zen Corporation Group PC
List of Figures
- Figure 1: Global Southeast Asia Food Service Market Revenue Breakdown (billion, %) by Region 2025 & 2033
- Figure 2: North America Southeast Asia Food Service Market Revenue (billion), by Foodservice Type 2025 & 2033
- Figure 3: North America Southeast Asia Food Service Market Revenue Share (%), by Foodservice Type 2025 & 2033
- Figure 4: North America Southeast Asia Food Service Market Revenue (billion), by Outlet 2025 & 2033
- Figure 5: North America Southeast Asia Food Service Market Revenue Share (%), by Outlet 2025 & 2033
- Figure 6: North America Southeast Asia Food Service Market Revenue (billion), by Location 2025 & 2033
- Figure 7: North America Southeast Asia Food Service Market Revenue Share (%), by Location 2025 & 2033
- Figure 8: North America Southeast Asia Food Service Market Revenue (billion), by Country 2025 & 2033
- Figure 9: North America Southeast Asia Food Service Market Revenue Share (%), by Country 2025 & 2033
- Figure 10: South America Southeast Asia Food Service Market Revenue (billion), by Foodservice Type 2025 & 2033
- Figure 11: South America Southeast Asia Food Service Market Revenue Share (%), by Foodservice Type 2025 & 2033
- Figure 12: South America Southeast Asia Food Service Market Revenue (billion), by Outlet 2025 & 2033
- Figure 13: South America Southeast Asia Food Service Market Revenue Share (%), by Outlet 2025 & 2033
- Figure 14: South America Southeast Asia Food Service Market Revenue (billion), by Location 2025 & 2033
- Figure 15: South America Southeast Asia Food Service Market Revenue Share (%), by Location 2025 & 2033
- Figure 16: South America Southeast Asia Food Service Market Revenue (billion), by Country 2025 & 2033
- Figure 17: South America Southeast Asia Food Service Market Revenue Share (%), by Country 2025 & 2033
- Figure 18: Europe Southeast Asia Food Service Market Revenue (billion), by Foodservice Type 2025 & 2033
- Figure 19: Europe Southeast Asia Food Service Market Revenue Share (%), by Foodservice Type 2025 & 2033
- Figure 20: Europe Southeast Asia Food Service Market Revenue (billion), by Outlet 2025 & 2033
- Figure 21: Europe Southeast Asia Food Service Market Revenue Share (%), by Outlet 2025 & 2033
- Figure 22: Europe Southeast Asia Food Service Market Revenue (billion), by Location 2025 & 2033
- Figure 23: Europe Southeast Asia Food Service Market Revenue Share (%), by Location 2025 & 2033
- Figure 24: Europe Southeast Asia Food Service Market Revenue (billion), by Country 2025 & 2033
- Figure 25: Europe Southeast Asia Food Service Market Revenue Share (%), by Country 2025 & 2033
- Figure 26: Middle East & Africa Southeast Asia Food Service Market Revenue (billion), by Foodservice Type 2025 & 2033
- Figure 27: Middle East & Africa Southeast Asia Food Service Market Revenue Share (%), by Foodservice Type 2025 & 2033
- Figure 28: Middle East & Africa Southeast Asia Food Service Market Revenue (billion), by Outlet 2025 & 2033
- Figure 29: Middle East & Africa Southeast Asia Food Service Market Revenue Share (%), by Outlet 2025 & 2033
- Figure 30: Middle East & Africa Southeast Asia Food Service Market Revenue (billion), by Location 2025 & 2033
- Figure 31: Middle East & Africa Southeast Asia Food Service Market Revenue Share (%), by Location 2025 & 2033
- Figure 32: Middle East & Africa Southeast Asia Food Service Market Revenue (billion), by Country 2025 & 2033
- Figure 33: Middle East & Africa Southeast Asia Food Service Market Revenue Share (%), by Country 2025 & 2033
- Figure 34: Asia Pacific Southeast Asia Food Service Market Revenue (billion), by Foodservice Type 2025 & 2033
- Figure 35: Asia Pacific Southeast Asia Food Service Market Revenue Share (%), by Foodservice Type 2025 & 2033
- Figure 36: Asia Pacific Southeast Asia Food Service Market Revenue (billion), by Outlet 2025 & 2033
- Figure 37: Asia Pacific Southeast Asia Food Service Market Revenue Share (%), by Outlet 2025 & 2033
- Figure 38: Asia Pacific Southeast Asia Food Service Market Revenue (billion), by Location 2025 & 2033
- Figure 39: Asia Pacific Southeast Asia Food Service Market Revenue Share (%), by Location 2025 & 2033
- Figure 40: Asia Pacific Southeast Asia Food Service Market Revenue (billion), by Country 2025 & 2033
- Figure 41: Asia Pacific Southeast Asia Food Service Market Revenue Share (%), by Country 2025 & 2033
List of Tables
- Table 1: Global Southeast Asia Food Service Market Revenue billion Forecast, by Foodservice Type 2020 & 2033
- Table 2: Global Southeast Asia Food Service Market Revenue billion Forecast, by Outlet 2020 & 2033
- Table 3: Global Southeast Asia Food Service Market Revenue billion Forecast, by Location 2020 & 2033
- Table 4: Global Southeast Asia Food Service Market Revenue billion Forecast, by Region 2020 & 2033
- Table 5: Global Southeast Asia Food Service Market Revenue billion Forecast, by Foodservice Type 2020 & 2033
- Table 6: Global Southeast Asia Food Service Market Revenue billion Forecast, by Outlet 2020 & 2033
- Table 7: Global Southeast Asia Food Service Market Revenue billion Forecast, by Location 2020 & 2033
- Table 8: Global Southeast Asia Food Service Market Revenue billion Forecast, by Country 2020 & 2033
- Table 9: United States Southeast Asia Food Service Market Revenue (billion) Forecast, by Application 2020 & 2033
- Table 10: Canada Southeast Asia Food Service Market Revenue (billion) Forecast, by Application 2020 & 2033
- Table 11: Mexico Southeast Asia Food Service Market Revenue (billion) Forecast, by Application 2020 & 2033
- Table 12: Global Southeast Asia Food Service Market Revenue billion Forecast, by Foodservice Type 2020 & 2033
- Table 13: Global Southeast Asia Food Service Market Revenue billion Forecast, by Outlet 2020 & 2033
- Table 14: Global Southeast Asia Food Service Market Revenue billion Forecast, by Location 2020 & 2033
- Table 15: Global Southeast Asia Food Service Market Revenue billion Forecast, by Country 2020 & 2033
- Table 16: Brazil Southeast Asia Food Service Market Revenue (billion) Forecast, by Application 2020 & 2033
- Table 17: Argentina Southeast Asia Food Service Market Revenue (billion) Forecast, by Application 2020 & 2033
- Table 18: Rest of South America Southeast Asia Food Service Market Revenue (billion) Forecast, by Application 2020 & 2033
- Table 19: Global Southeast Asia Food Service Market Revenue billion Forecast, by Foodservice Type 2020 & 2033
- Table 20: Global Southeast Asia Food Service Market Revenue billion Forecast, by Outlet 2020 & 2033
- Table 21: Global Southeast Asia Food Service Market Revenue billion Forecast, by Location 2020 & 2033
- Table 22: Global Southeast Asia Food Service Market Revenue billion Forecast, by Country 2020 & 2033
- Table 23: United Kingdom Southeast Asia Food Service Market Revenue (billion) Forecast, by Application 2020 & 2033
- Table 24: Germany Southeast Asia Food Service Market Revenue (billion) Forecast, by Application 2020 & 2033
- Table 25: France Southeast Asia Food Service Market Revenue (billion) Forecast, by Application 2020 & 2033
- Table 26: Italy Southeast Asia Food Service Market Revenue (billion) Forecast, by Application 2020 & 2033
- Table 27: Spain Southeast Asia Food Service Market Revenue (billion) Forecast, by Application 2020 & 2033
- Table 28: Russia Southeast Asia Food Service Market Revenue (billion) Forecast, by Application 2020 & 2033
- Table 29: Benelux Southeast Asia Food Service Market Revenue (billion) Forecast, by Application 2020 & 2033
- Table 30: Nordics Southeast Asia Food Service Market Revenue (billion) Forecast, by Application 2020 & 2033
- Table 31: Rest of Europe Southeast Asia Food Service Market Revenue (billion) Forecast, by Application 2020 & 2033
- Table 32: Global Southeast Asia Food Service Market Revenue billion Forecast, by Foodservice Type 2020 & 2033
- Table 33: Global Southeast Asia Food Service Market Revenue billion Forecast, by Outlet 2020 & 2033
- Table 34: Global Southeast Asia Food Service Market Revenue billion Forecast, by Location 2020 & 2033
- Table 35: Global Southeast Asia Food Service Market Revenue billion Forecast, by Country 2020 & 2033
- Table 36: Turkey Southeast Asia Food Service Market Revenue (billion) Forecast, by Application 2020 & 2033
- Table 37: Israel Southeast Asia Food Service Market Revenue (billion) Forecast, by Application 2020 & 2033
- Table 38: GCC Southeast Asia Food Service Market Revenue (billion) Forecast, by Application 2020 & 2033
- Table 39: North Africa Southeast Asia Food Service Market Revenue (billion) Forecast, by Application 2020 & 2033
- Table 40: South Africa Southeast Asia Food Service Market Revenue (billion) Forecast, by Application 2020 & 2033
- Table 41: Rest of Middle East & Africa Southeast Asia Food Service Market Revenue (billion) Forecast, by Application 2020 & 2033
- Table 42: Global Southeast Asia Food Service Market Revenue billion Forecast, by Foodservice Type 2020 & 2033
- Table 43: Global Southeast Asia Food Service Market Revenue billion Forecast, by Outlet 2020 & 2033
- Table 44: Global Southeast Asia Food Service Market Revenue billion Forecast, by Location 2020 & 2033
- Table 45: Global Southeast Asia Food Service Market Revenue billion Forecast, by Country 2020 & 2033
- Table 46: China Southeast Asia Food Service Market Revenue (billion) Forecast, by Application 2020 & 2033
- Table 47: India Southeast Asia Food Service Market Revenue (billion) Forecast, by Application 2020 & 2033
- Table 48: Japan Southeast Asia Food Service Market Revenue (billion) Forecast, by Application 2020 & 2033
- Table 49: South Korea Southeast Asia Food Service Market Revenue (billion) Forecast, by Application 2020 & 2033
- Table 50: ASEAN Southeast Asia Food Service Market Revenue (billion) Forecast, by Application 2020 & 2033
- Table 51: Oceania Southeast Asia Food Service Market Revenue (billion) Forecast, by Application 2020 & 2033
- Table 52: Rest of Asia Pacific Southeast Asia Food Service Market Revenue (billion) Forecast, by Application 2020 & 2033
Frequently Asked Questions
1. What is the projected Compound Annual Growth Rate (CAGR) of the Southeast Asia Food Service Market?
The projected CAGR is approximately 13.2%.
2. Which companies are prominent players in the Southeast Asia Food Service Market?
Key companies in the market include Zen Corporation Group PC, Yum! Brands Inc, Doctor's Associates Inc, Inspire Brands Inc, Thai Beverage PCL, Nando's Group Holdings Limited, Jollibee Foods Corporation, The Wendy's Company, Secret Recipe Cakes & Café Sdn Bhd, Tung Lok Restaurants (2000) Ltd, Domino's Pizza Enterprises Ltd, Starbucks Corporation, Marrybrown Sdn Bhd, Minor International PCL, Restaurant Brands International Inc, McDonald's Corporation.
3. What are the main segments of the Southeast Asia Food Service Market?
The market segments include Foodservice Type, Outlet, Location.
4. Can you provide details about the market size?
The market size is estimated to be USD 223.8 billion as of 2022.
5. What are some drivers contributing to market growth?
Growing Awareness of Functional Benefits of Carotenoids; Consumption of Health and Wellness Products.
6. What are the notable trends driving market growth?
OTHER KEY INDUSTRY TRENDS COVERED IN THE REPORT.
7. Are there any restraints impacting market growth?
High Processing Cost and Low Yield of Natural Food Colors.
8. Can you provide examples of recent developments in the market?
October 2023: Starbucks launched two new drinks with the addition of ice cream in the Philippines.May 2023: Starbucks inaugurated the latest rustic finish store in Bird Paradise, and the structure of the store is designed like a wooden hut.May 2023: Inspire Brands, Inc. launched new butter variants to its Butternut portfolio. These variants include the Plain Butternut, Choco Almond Butternut, Ube Cheese Butternut, Strawberry Butternut, Cheesy Butternut, and Choco Butternut.
9. What pricing options are available for accessing the report?
Pricing options include single-user, multi-user, and enterprise licenses priced at USD 3800, USD 4500, and USD 5800 respectively.
10. Is the market size provided in terms of value or volume?
The market size is provided in terms of value, measured in billion.
11. Are there any specific market keywords associated with the report?
Yes, the market keyword associated with the report is "Southeast Asia Food Service Market," which aids in identifying and referencing the specific market segment covered.
12. How do I determine which pricing option suits my needs best?
The pricing options vary based on user requirements and access needs. Individual users may opt for single-user licenses, while businesses requiring broader access may choose multi-user or enterprise licenses for cost-effective access to the report.
13. Are there any additional resources or data provided in the Southeast Asia Food Service Market report?
While the report offers comprehensive insights, it's advisable to review the specific contents or supplementary materials provided to ascertain if additional resources or data are available.
14. How can I stay updated on further developments or reports in the Southeast Asia Food Service Market?
To stay informed about further developments, trends, and reports in the Southeast Asia Food Service Market, consider subscribing to industry newsletters, following relevant companies and organizations, or regularly checking reputable industry news sources and publications.
Methodology
Step 1 - Identification of Relevant Samples Size from Population Database


Step 2 - Approaches for Defining Global Market Size (Value, Volume* & Price*)

Note*: In applicable scenarios
Step 3 - Data Sources
Primary Research
- Web Analytics
- Survey Reports
- Research Institute
- Latest Research Reports
- Opinion Leaders
Secondary Research
- Annual Reports
- White Paper
- Latest Press Release
- Industry Association
- Paid Database
- Investor Presentations

Step 4 - Data Triangulation
Involves using different sources of information in order to increase the validity of a study
These sources are likely to be stakeholders in a program - participants, other researchers, program staff, other community members, and so on.
Then we put all data in single framework & apply various statistical tools to find out the dynamic on the market.
During the analysis stage, feedback from the stakeholder groups would be compared to determine areas of agreement as well as areas of divergence