

Key Insights
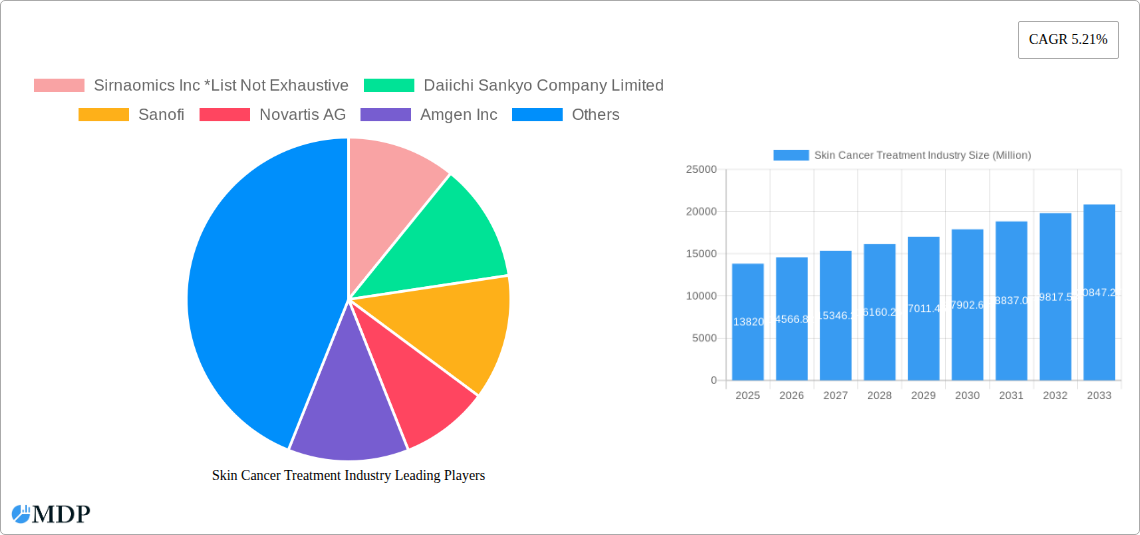
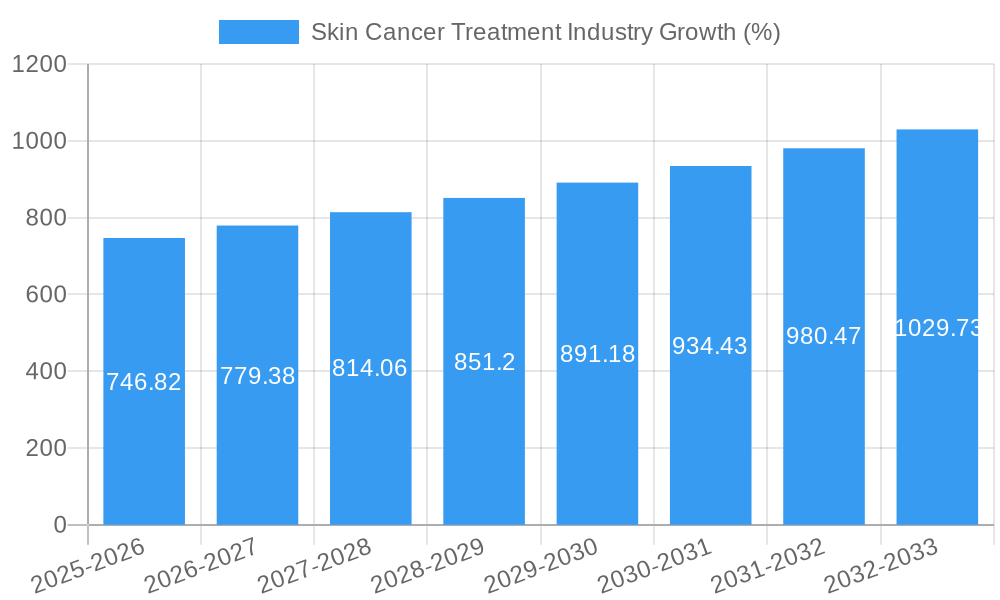
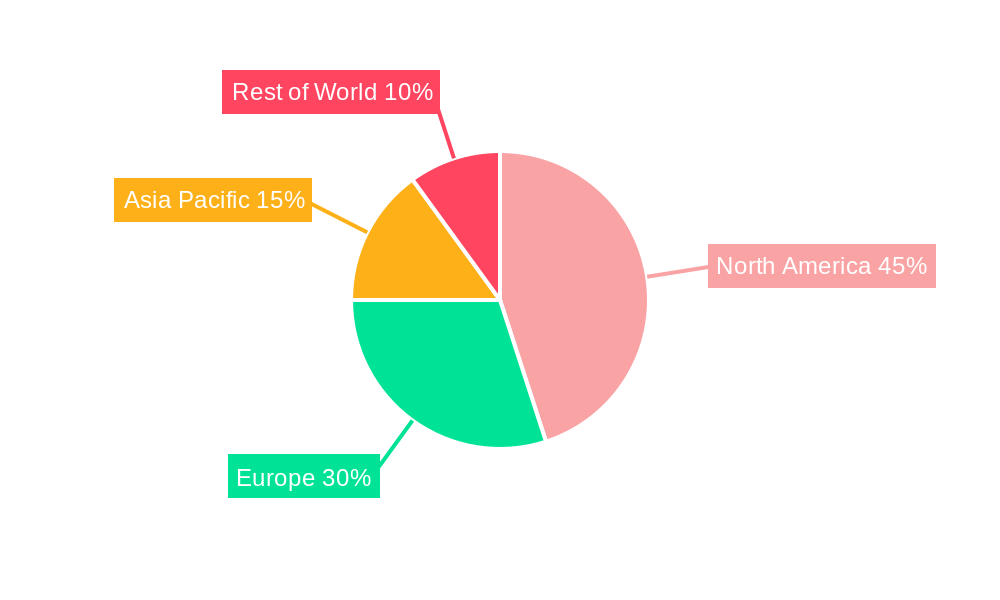
The global skin cancer treatment market, valued at $13.82 billion in 2025, is projected to experience robust growth, exhibiting a compound annual growth rate (CAGR) of 5.21% from 2025 to 2033. This expansion is fueled by several key drivers. Rising incidence rates of skin cancer, particularly melanoma, due to increasing UV radiation exposure and aging populations, are significantly impacting market growth. Advancements in treatment modalities, including targeted therapies, immunotherapies, and innovative surgical techniques, offer improved patient outcomes and contribute to market expansion. Furthermore, increased awareness campaigns regarding early detection and prevention are driving demand for diagnostic services and treatment options. The market is segmented by cancer type (melanoma, non-melanoma), treatment type (diagnosis, therapeutics), and geography, with North America currently holding a significant market share due to high healthcare spending and advanced medical infrastructure. However, the market faces certain restraints, including high treatment costs, potential side effects associated with certain therapies, and disparities in access to quality healthcare in developing regions.
Despite these challenges, the future outlook for the skin cancer treatment market remains positive. The ongoing research and development efforts focused on personalized medicine and novel therapeutic approaches are expected to further propel market growth. The increasing adoption of minimally invasive procedures and teledermatology is also streamlining access to care and enhancing treatment efficiency. The emergence of biosimilars and generic medications could potentially make treatments more affordable, thereby expanding market reach. Competition among established pharmaceutical companies and emerging biotech firms is driving innovation and creating opportunities for market entrants. Geographically, the Asia-Pacific region is poised for significant growth, driven by rising healthcare expenditure and increasing awareness about skin cancer prevention and treatment. This dynamic interplay of factors suggests a sustained and substantial growth trajectory for the skin cancer treatment market over the forecast period.
Skin Cancer Treatment Market Report: 2019-2033 Forecast
This comprehensive report provides a detailed analysis of the global skin cancer treatment market, projecting a market valuation of xx Million by 2033. The report covers market dynamics, leading players, key trends, and future opportunities, offering invaluable insights for stakeholders across the industry. The study period is 2019-2033, with 2025 serving as both the base and estimated year. This report is crucial for understanding the rapidly evolving landscape of skin cancer treatment and making informed strategic decisions.
Skin Cancer Treatment Industry Market Dynamics & Concentration
The global skin cancer treatment market exhibits a moderately concentrated landscape, with several major pharmaceutical companies holding significant market share. Market concentration is influenced by factors such as R&D investment, regulatory approvals, and successful product launches. The market share of the top 5 players is estimated at xx%, demonstrating significant consolidation. Innovation drivers include advancements in immunotherapy, targeted therapies, and diagnostic technologies. Stringent regulatory frameworks, particularly in developed markets, impact market entry and product approvals. The presence of alternative treatments, such as surgery and radiation therapy, creates competition, while the rising incidence of skin cancer fuels market growth. Mergers and acquisitions (M&A) activity is relatively high, with xx M&A deals recorded in the historical period (2019-2024).
- Market Concentration: Top 5 players hold xx% market share (2025).
- Innovation Drivers: Immunotherapy, targeted therapies, advanced diagnostics.
- Regulatory Framework: Stringent approvals, varying across regions.
- Product Substitutes: Surgery, radiation therapy.
- End-User Trends: Increasing awareness, demand for minimally invasive treatments.
- M&A Activity: xx deals between 2019-2024.
Skin Cancer Treatment Industry Trends & Analysis
The skin cancer treatment market is experiencing robust growth, driven by several key factors. The increasing prevalence of skin cancer globally, particularly melanoma, is a primary driver. Technological advancements, such as the development of novel immunotherapies and targeted therapies, are significantly impacting treatment effectiveness and patient outcomes. Consumer preferences are shifting towards less invasive procedures with improved cosmetic results, further propelling the demand for advanced treatment options. The market exhibits strong competitive dynamics, with pharmaceutical companies investing heavily in R&D and strategic partnerships to expand their product portfolios and market share. The compound annual growth rate (CAGR) for the forecast period (2025-2033) is estimated at xx%, and market penetration for innovative therapies is projected to reach xx% by 2033.
Leading Markets & Segments in Skin Cancer Treatment Industry
The North American region dominates the skin cancer treatment market, driven by factors such as high incidence rates, advanced healthcare infrastructure, and high healthcare expenditure. Within this region, the United States holds the largest market share. The melanoma segment accounts for the largest share of the market due to its aggressive nature and high treatment costs. Within the therapeutics segment, immunotherapies and targeted therapies are witnessing the fastest growth. The diagnostic segment is also experiencing significant growth as early detection improves patient outcomes.
- Key Drivers (North America): High skin cancer incidence, advanced healthcare infrastructure, high per capita healthcare spending.
- Melanoma Segment Dominance: High incidence rate, aggressive nature, and high treatment costs.
- Therapeutics Segment Growth: Increased adoption of immunotherapies and targeted therapies.
- Diagnostics Segment Growth: Early detection and improved patient outcomes.
Skin Cancer Treatment Industry Product Developments
Recent years have seen significant advancements in skin cancer treatment, particularly in the areas of immunotherapy and targeted therapies. Novel immunotherapeutic agents, such as checkpoint inhibitors, are revolutionizing the treatment landscape, offering improved efficacy and durable responses. Targeted therapies are showing promising results in specific subsets of skin cancer patients. These developments, combined with advancements in diagnostic tools, are improving patient outcomes and driving market growth. The focus is on enhancing treatment efficacy, reducing side effects, and improving patient quality of life.
Key Drivers of Skin Cancer Treatment Industry Growth
Several factors contribute to the substantial growth of the skin cancer treatment market. The rising global prevalence of skin cancer, driven by factors like increased UV radiation exposure and aging populations, is a primary driver. Technological advancements, including the development of novel therapies, diagnostic tools, and minimally invasive procedures, are accelerating market expansion. Favorable regulatory landscapes in key markets are facilitating product approvals and market entry. Increased healthcare spending and improved insurance coverage further fuel market growth.
Challenges in the Skin Cancer Treatment Industry Market
Despite strong growth potential, the skin cancer treatment market faces several challenges. High drug development costs and stringent regulatory hurdles pose significant barriers to market entry for new therapies. Supply chain disruptions and pricing pressures can impact profitability. The competitive landscape, with several established players and emerging companies, necessitates strategic differentiation to succeed. The efficacy and safety profile of new therapies often require extensive clinical trials before gaining market approval.
Emerging Opportunities in Skin Cancer Treatment Industry
The skin cancer treatment market presents several promising opportunities for long-term growth. Advancements in personalized medicine, leveraging genomic profiling to tailor treatment strategies, offer significant potential. Strategic partnerships between pharmaceutical companies and technology providers are driving innovation in diagnostic and therapeutic tools. Expanding market access in developing countries with high skin cancer incidence rates presents significant growth potential. The continuous development of minimally invasive techniques further contributes to market growth.
Leading Players in the Skin Cancer Treatment Industry Sector
- Sirnaomics Inc
- Daiichi Sankyo Company Limited
- Sanofi
- Novartis AG
- Amgen Inc
- Merck & Co Inc
- F Hoffmann-La Roche Ltd
- Abbott
- Labcorp
- Sun Pharmaceutical Industries Ltd
- QIAGEN
- Bristol-Myers Squibb Company
- Pfizer Inc
Key Milestones in Skin Cancer Treatment Industry
- March 2022: FDA approval of nivolumab and relatlimab-rmbw (Opdualag, Bristol-Myers Squibb Company) for unresectable or metastatic melanoma.
- January 2022: SkinCure Oncology launches GentleCure.com, an educational platform for BCC and SCC treatment.
Strategic Outlook for Skin Cancer Treatment Industry Market
The future of the skin cancer treatment market is bright, driven by continuous innovation in therapeutics and diagnostics. Strategic partnerships and acquisitions will continue to shape the market landscape. Personalized medicine, focusing on tailored treatment approaches, will play a crucial role. Expansion into emerging markets, particularly in regions with a high burden of skin cancer, presents a key growth opportunity. The long-term outlook points toward a robust market with considerable potential for growth and innovation.
Skin Cancer Treatment Industry Segmentation
-
1. Cancer Type
- 1.1. Melanoma
- 1.2. Non-melanoma
-
2. Type
-
2.1. Diagnosis
- 2.1.1. Dermatoscopy
- 2.1.2. Biopsy
- 2.1.3. Genetic Tests
- 2.1.4. Others
-
2.2. Therapeutics
- 2.2.1. Chemotherapy
- 2.2.2. Immunotherapy
- 2.2.3. Targeted Therapy
-
2.1. Diagnosis
Skin Cancer Treatment Industry Segmentation By Geography
-
1. North America
- 1.1. United States
- 1.2. Canada
- 1.3. Mexico
-
2. Europe
- 2.1. Germany
- 2.2. United Kingdom
- 2.3. France
- 2.4. Italy
- 2.5. Spain
- 2.6. Rest of Europe
-
3. Asia Pacific
- 3.1. China
- 3.2. Japan
- 3.3. India
- 3.4. Australia
- 3.5. South Korea
- 3.6. Rest of Asia Pacific
-
4. Middle East and Africa
- 4.1. GCC
- 4.2. South Africa
- 4.3. Rest of Middle East and Africa
-
5. South America
- 5.1. Brazil
- 5.2. Argentina
- 5.3. Rest of South America
Skin Cancer Treatment Industry REPORT HIGHLIGHTS
| Aspects | Details |
|---|---|
| Study Period | 2019-2033 |
| Base Year | 2024 |
| Estimated Year | 2025 |
| Forecast Period | 2025-2033 |
| Historical Period | 2019-2024 |
| Growth Rate | CAGR of 5.21% from 2019-2033 |
| Segmentation |
|
Table of Contents
- 1. Introduction
- 1.1. Research Scope
- 1.2. Market Segmentation
- 1.3. Research Methodology
- 1.4. Definitions and Assumptions
- 2. Executive Summary
- 2.1. Introduction
- 3. Market Dynamics
- 3.1. Introduction
- 3.2. Market Drivers
- 3.2.1. Increasing Incidence of Skin Cancer; Rising Awareness About Skin Cancer; Extensive Research and Developments
- 3.3. Market Restrains
- 3.3.1. High Cost Associated with Therapy; Stringent Regulatory Framework
- 3.4. Market Trends
- 3.4.1. Non-Melanoma by Cancer Type Segment is Expected to Grow Over the Forecast Period
- 4. Market Factor Analysis
- 4.1. Porters Five Forces
- 4.2. Supply/Value Chain
- 4.3. PESTEL analysis
- 4.4. Market Entropy
- 4.5. Patent/Trademark Analysis
- 5. Global Skin Cancer Treatment Industry Analysis, Insights and Forecast, 2019-2031
- 5.1. Market Analysis, Insights and Forecast - by Cancer Type
- 5.1.1. Melanoma
- 5.1.2. Non-melanoma
- 5.2. Market Analysis, Insights and Forecast - by Type
- 5.2.1. Diagnosis
- 5.2.1.1. Dermatoscopy
- 5.2.1.2. Biopsy
- 5.2.1.3. Genetic Tests
- 5.2.1.4. Others
- 5.2.2. Therapeutics
- 5.2.2.1. Chemotherapy
- 5.2.2.2. Immunotherapy
- 5.2.2.3. Targeted Therapy
- 5.2.1. Diagnosis
- 5.3. Market Analysis, Insights and Forecast - by Region
- 5.3.1. North America
- 5.3.2. Europe
- 5.3.3. Asia Pacific
- 5.3.4. Middle East and Africa
- 5.3.5. South America
- 5.1. Market Analysis, Insights and Forecast - by Cancer Type
- 6. North America Skin Cancer Treatment Industry Analysis, Insights and Forecast, 2019-2031
- 6.1. Market Analysis, Insights and Forecast - by Cancer Type
- 6.1.1. Melanoma
- 6.1.2. Non-melanoma
- 6.2. Market Analysis, Insights and Forecast - by Type
- 6.2.1. Diagnosis
- 6.2.1.1. Dermatoscopy
- 6.2.1.2. Biopsy
- 6.2.1.3. Genetic Tests
- 6.2.1.4. Others
- 6.2.2. Therapeutics
- 6.2.2.1. Chemotherapy
- 6.2.2.2. Immunotherapy
- 6.2.2.3. Targeted Therapy
- 6.2.1. Diagnosis
- 6.1. Market Analysis, Insights and Forecast - by Cancer Type
- 7. Europe Skin Cancer Treatment Industry Analysis, Insights and Forecast, 2019-2031
- 7.1. Market Analysis, Insights and Forecast - by Cancer Type
- 7.1.1. Melanoma
- 7.1.2. Non-melanoma
- 7.2. Market Analysis, Insights and Forecast - by Type
- 7.2.1. Diagnosis
- 7.2.1.1. Dermatoscopy
- 7.2.1.2. Biopsy
- 7.2.1.3. Genetic Tests
- 7.2.1.4. Others
- 7.2.2. Therapeutics
- 7.2.2.1. Chemotherapy
- 7.2.2.2. Immunotherapy
- 7.2.2.3. Targeted Therapy
- 7.2.1. Diagnosis
- 7.1. Market Analysis, Insights and Forecast - by Cancer Type
- 8. Asia Pacific Skin Cancer Treatment Industry Analysis, Insights and Forecast, 2019-2031
- 8.1. Market Analysis, Insights and Forecast - by Cancer Type
- 8.1.1. Melanoma
- 8.1.2. Non-melanoma
- 8.2. Market Analysis, Insights and Forecast - by Type
- 8.2.1. Diagnosis
- 8.2.1.1. Dermatoscopy
- 8.2.1.2. Biopsy
- 8.2.1.3. Genetic Tests
- 8.2.1.4. Others
- 8.2.2. Therapeutics
- 8.2.2.1. Chemotherapy
- 8.2.2.2. Immunotherapy
- 8.2.2.3. Targeted Therapy
- 8.2.1. Diagnosis
- 8.1. Market Analysis, Insights and Forecast - by Cancer Type
- 9. Middle East and Africa Skin Cancer Treatment Industry Analysis, Insights and Forecast, 2019-2031
- 9.1. Market Analysis, Insights and Forecast - by Cancer Type
- 9.1.1. Melanoma
- 9.1.2. Non-melanoma
- 9.2. Market Analysis, Insights and Forecast - by Type
- 9.2.1. Diagnosis
- 9.2.1.1. Dermatoscopy
- 9.2.1.2. Biopsy
- 9.2.1.3. Genetic Tests
- 9.2.1.4. Others
- 9.2.2. Therapeutics
- 9.2.2.1. Chemotherapy
- 9.2.2.2. Immunotherapy
- 9.2.2.3. Targeted Therapy
- 9.2.1. Diagnosis
- 9.1. Market Analysis, Insights and Forecast - by Cancer Type
- 10. South America Skin Cancer Treatment Industry Analysis, Insights and Forecast, 2019-2031
- 10.1. Market Analysis, Insights and Forecast - by Cancer Type
- 10.1.1. Melanoma
- 10.1.2. Non-melanoma
- 10.2. Market Analysis, Insights and Forecast - by Type
- 10.2.1. Diagnosis
- 10.2.1.1. Dermatoscopy
- 10.2.1.2. Biopsy
- 10.2.1.3. Genetic Tests
- 10.2.1.4. Others
- 10.2.2. Therapeutics
- 10.2.2.1. Chemotherapy
- 10.2.2.2. Immunotherapy
- 10.2.2.3. Targeted Therapy
- 10.2.1. Diagnosis
- 10.1. Market Analysis, Insights and Forecast - by Cancer Type
- 11. North Americ Skin Cancer Treatment Industry Analysis, Insights and Forecast, 2019-2031
- 11.1. Market Analysis, Insights and Forecast - By Country/Sub-region
- 11.1.1 United States
- 11.1.2 Canada
- 11.1.3 Mexico
- 12. South America Skin Cancer Treatment Industry Analysis, Insights and Forecast, 2019-2031
- 12.1. Market Analysis, Insights and Forecast - By Country/Sub-region
- 12.1.1 Brazil
- 12.1.2 Mexico
- 12.1.3 Rest of South America
- 13. Europe Skin Cancer Treatment Industry Analysis, Insights and Forecast, 2019-2031
- 13.1. Market Analysis, Insights and Forecast - By Country/Sub-region
- 13.1.1 Germany
- 13.1.2 United Kingdom
- 13.1.3 France
- 13.1.4 Italy
- 13.1.5 Spain
- 13.1.6 Rest of Europe
- 14. Asia Pacific Skin Cancer Treatment Industry Analysis, Insights and Forecast, 2019-2031
- 14.1. Market Analysis, Insights and Forecast - By Country/Sub-region
- 14.1.1 China
- 14.1.2 Japan
- 14.1.3 India
- 14.1.4 South Korea
- 14.1.5 Taiwan
- 14.1.6 Australia
- 14.1.7 Rest of Asia-Pacific
- 15. MEA Skin Cancer Treatment Industry Analysis, Insights and Forecast, 2019-2031
- 15.1. Market Analysis, Insights and Forecast - By Country/Sub-region
- 15.1.1 Middle East
- 15.1.2 Africa
- 16. Competitive Analysis
- 16.1. Global Market Share Analysis 2024
- 16.2. Company Profiles
- 16.2.1 Sirnaomics Inc *List Not Exhaustive
- 16.2.1.1. Overview
- 16.2.1.2. Products
- 16.2.1.3. SWOT Analysis
- 16.2.1.4. Recent Developments
- 16.2.1.5. Financials (Based on Availability)
- 16.2.2 Daiichi Sankyo Company Limited
- 16.2.2.1. Overview
- 16.2.2.2. Products
- 16.2.2.3. SWOT Analysis
- 16.2.2.4. Recent Developments
- 16.2.2.5. Financials (Based on Availability)
- 16.2.3 Sanofi
- 16.2.3.1. Overview
- 16.2.3.2. Products
- 16.2.3.3. SWOT Analysis
- 16.2.3.4. Recent Developments
- 16.2.3.5. Financials (Based on Availability)
- 16.2.4 Novartis AG
- 16.2.4.1. Overview
- 16.2.4.2. Products
- 16.2.4.3. SWOT Analysis
- 16.2.4.4. Recent Developments
- 16.2.4.5. Financials (Based on Availability)
- 16.2.5 Amgen Inc
- 16.2.5.1. Overview
- 16.2.5.2. Products
- 16.2.5.3. SWOT Analysis
- 16.2.5.4. Recent Developments
- 16.2.5.5. Financials (Based on Availability)
- 16.2.6 Merck & Co Inc
- 16.2.6.1. Overview
- 16.2.6.2. Products
- 16.2.6.3. SWOT Analysis
- 16.2.6.4. Recent Developments
- 16.2.6.5. Financials (Based on Availability)
- 16.2.7 F Hoffmann-La Roche Ltd
- 16.2.7.1. Overview
- 16.2.7.2. Products
- 16.2.7.3. SWOT Analysis
- 16.2.7.4. Recent Developments
- 16.2.7.5. Financials (Based on Availability)
- 16.2.8 Abbott
- 16.2.8.1. Overview
- 16.2.8.2. Products
- 16.2.8.3. SWOT Analysis
- 16.2.8.4. Recent Developments
- 16.2.8.5. Financials (Based on Availability)
- 16.2.9 Labcorp
- 16.2.9.1. Overview
- 16.2.9.2. Products
- 16.2.9.3. SWOT Analysis
- 16.2.9.4. Recent Developments
- 16.2.9.5. Financials (Based on Availability)
- 16.2.10 Sun Pharmaceutical Industries Ltd
- 16.2.10.1. Overview
- 16.2.10.2. Products
- 16.2.10.3. SWOT Analysis
- 16.2.10.4. Recent Developments
- 16.2.10.5. Financials (Based on Availability)
- 16.2.11 QIAGEN
- 16.2.11.1. Overview
- 16.2.11.2. Products
- 16.2.11.3. SWOT Analysis
- 16.2.11.4. Recent Developments
- 16.2.11.5. Financials (Based on Availability)
- 16.2.12 Bristol-Myers Squibb Company
- 16.2.12.1. Overview
- 16.2.12.2. Products
- 16.2.12.3. SWOT Analysis
- 16.2.12.4. Recent Developments
- 16.2.12.5. Financials (Based on Availability)
- 16.2.13 Pfizer Inc
- 16.2.13.1. Overview
- 16.2.13.2. Products
- 16.2.13.3. SWOT Analysis
- 16.2.13.4. Recent Developments
- 16.2.13.5. Financials (Based on Availability)
- 16.2.1 Sirnaomics Inc *List Not Exhaustive
List of Figures
- Figure 1: Global Skin Cancer Treatment Industry Revenue Breakdown (Million, %) by Region 2024 & 2032
- Figure 2: North Americ Skin Cancer Treatment Industry Revenue (Million), by Country 2024 & 2032
- Figure 3: North Americ Skin Cancer Treatment Industry Revenue Share (%), by Country 2024 & 2032
- Figure 4: South America Skin Cancer Treatment Industry Revenue (Million), by Country 2024 & 2032
- Figure 5: South America Skin Cancer Treatment Industry Revenue Share (%), by Country 2024 & 2032
- Figure 6: Europe Skin Cancer Treatment Industry Revenue (Million), by Country 2024 & 2032
- Figure 7: Europe Skin Cancer Treatment Industry Revenue Share (%), by Country 2024 & 2032
- Figure 8: Asia Pacific Skin Cancer Treatment Industry Revenue (Million), by Country 2024 & 2032
- Figure 9: Asia Pacific Skin Cancer Treatment Industry Revenue Share (%), by Country 2024 & 2032
- Figure 10: MEA Skin Cancer Treatment Industry Revenue (Million), by Country 2024 & 2032
- Figure 11: MEA Skin Cancer Treatment Industry Revenue Share (%), by Country 2024 & 2032
- Figure 12: North America Skin Cancer Treatment Industry Revenue (Million), by Cancer Type 2024 & 2032
- Figure 13: North America Skin Cancer Treatment Industry Revenue Share (%), by Cancer Type 2024 & 2032
- Figure 14: North America Skin Cancer Treatment Industry Revenue (Million), by Type 2024 & 2032
- Figure 15: North America Skin Cancer Treatment Industry Revenue Share (%), by Type 2024 & 2032
- Figure 16: North America Skin Cancer Treatment Industry Revenue (Million), by Country 2024 & 2032
- Figure 17: North America Skin Cancer Treatment Industry Revenue Share (%), by Country 2024 & 2032
- Figure 18: Europe Skin Cancer Treatment Industry Revenue (Million), by Cancer Type 2024 & 2032
- Figure 19: Europe Skin Cancer Treatment Industry Revenue Share (%), by Cancer Type 2024 & 2032
- Figure 20: Europe Skin Cancer Treatment Industry Revenue (Million), by Type 2024 & 2032
- Figure 21: Europe Skin Cancer Treatment Industry Revenue Share (%), by Type 2024 & 2032
- Figure 22: Europe Skin Cancer Treatment Industry Revenue (Million), by Country 2024 & 2032
- Figure 23: Europe Skin Cancer Treatment Industry Revenue Share (%), by Country 2024 & 2032
- Figure 24: Asia Pacific Skin Cancer Treatment Industry Revenue (Million), by Cancer Type 2024 & 2032
- Figure 25: Asia Pacific Skin Cancer Treatment Industry Revenue Share (%), by Cancer Type 2024 & 2032
- Figure 26: Asia Pacific Skin Cancer Treatment Industry Revenue (Million), by Type 2024 & 2032
- Figure 27: Asia Pacific Skin Cancer Treatment Industry Revenue Share (%), by Type 2024 & 2032
- Figure 28: Asia Pacific Skin Cancer Treatment Industry Revenue (Million), by Country 2024 & 2032
- Figure 29: Asia Pacific Skin Cancer Treatment Industry Revenue Share (%), by Country 2024 & 2032
- Figure 30: Middle East and Africa Skin Cancer Treatment Industry Revenue (Million), by Cancer Type 2024 & 2032
- Figure 31: Middle East and Africa Skin Cancer Treatment Industry Revenue Share (%), by Cancer Type 2024 & 2032
- Figure 32: Middle East and Africa Skin Cancer Treatment Industry Revenue (Million), by Type 2024 & 2032
- Figure 33: Middle East and Africa Skin Cancer Treatment Industry Revenue Share (%), by Type 2024 & 2032
- Figure 34: Middle East and Africa Skin Cancer Treatment Industry Revenue (Million), by Country 2024 & 2032
- Figure 35: Middle East and Africa Skin Cancer Treatment Industry Revenue Share (%), by Country 2024 & 2032
- Figure 36: South America Skin Cancer Treatment Industry Revenue (Million), by Cancer Type 2024 & 2032
- Figure 37: South America Skin Cancer Treatment Industry Revenue Share (%), by Cancer Type 2024 & 2032
- Figure 38: South America Skin Cancer Treatment Industry Revenue (Million), by Type 2024 & 2032
- Figure 39: South America Skin Cancer Treatment Industry Revenue Share (%), by Type 2024 & 2032
- Figure 40: South America Skin Cancer Treatment Industry Revenue (Million), by Country 2024 & 2032
- Figure 41: South America Skin Cancer Treatment Industry Revenue Share (%), by Country 2024 & 2032
List of Tables
- Table 1: Global Skin Cancer Treatment Industry Revenue Million Forecast, by Region 2019 & 2032
- Table 2: Global Skin Cancer Treatment Industry Revenue Million Forecast, by Cancer Type 2019 & 2032
- Table 3: Global Skin Cancer Treatment Industry Revenue Million Forecast, by Type 2019 & 2032
- Table 4: Global Skin Cancer Treatment Industry Revenue Million Forecast, by Region 2019 & 2032
- Table 5: Global Skin Cancer Treatment Industry Revenue Million Forecast, by Country 2019 & 2032
- Table 6: United States Skin Cancer Treatment Industry Revenue (Million) Forecast, by Application 2019 & 2032
- Table 7: Canada Skin Cancer Treatment Industry Revenue (Million) Forecast, by Application 2019 & 2032
- Table 8: Mexico Skin Cancer Treatment Industry Revenue (Million) Forecast, by Application 2019 & 2032
- Table 9: Global Skin Cancer Treatment Industry Revenue Million Forecast, by Country 2019 & 2032
- Table 10: Brazil Skin Cancer Treatment Industry Revenue (Million) Forecast, by Application 2019 & 2032
- Table 11: Mexico Skin Cancer Treatment Industry Revenue (Million) Forecast, by Application 2019 & 2032
- Table 12: Rest of South America Skin Cancer Treatment Industry Revenue (Million) Forecast, by Application 2019 & 2032
- Table 13: Global Skin Cancer Treatment Industry Revenue Million Forecast, by Country 2019 & 2032
- Table 14: Germany Skin Cancer Treatment Industry Revenue (Million) Forecast, by Application 2019 & 2032
- Table 15: United Kingdom Skin Cancer Treatment Industry Revenue (Million) Forecast, by Application 2019 & 2032
- Table 16: France Skin Cancer Treatment Industry Revenue (Million) Forecast, by Application 2019 & 2032
- Table 17: Italy Skin Cancer Treatment Industry Revenue (Million) Forecast, by Application 2019 & 2032
- Table 18: Spain Skin Cancer Treatment Industry Revenue (Million) Forecast, by Application 2019 & 2032
- Table 19: Rest of Europe Skin Cancer Treatment Industry Revenue (Million) Forecast, by Application 2019 & 2032
- Table 20: Global Skin Cancer Treatment Industry Revenue Million Forecast, by Country 2019 & 2032
- Table 21: China Skin Cancer Treatment Industry Revenue (Million) Forecast, by Application 2019 & 2032
- Table 22: Japan Skin Cancer Treatment Industry Revenue (Million) Forecast, by Application 2019 & 2032
- Table 23: India Skin Cancer Treatment Industry Revenue (Million) Forecast, by Application 2019 & 2032
- Table 24: South Korea Skin Cancer Treatment Industry Revenue (Million) Forecast, by Application 2019 & 2032
- Table 25: Taiwan Skin Cancer Treatment Industry Revenue (Million) Forecast, by Application 2019 & 2032
- Table 26: Australia Skin Cancer Treatment Industry Revenue (Million) Forecast, by Application 2019 & 2032
- Table 27: Rest of Asia-Pacific Skin Cancer Treatment Industry Revenue (Million) Forecast, by Application 2019 & 2032
- Table 28: Global Skin Cancer Treatment Industry Revenue Million Forecast, by Country 2019 & 2032
- Table 29: Middle East Skin Cancer Treatment Industry Revenue (Million) Forecast, by Application 2019 & 2032
- Table 30: Africa Skin Cancer Treatment Industry Revenue (Million) Forecast, by Application 2019 & 2032
- Table 31: Global Skin Cancer Treatment Industry Revenue Million Forecast, by Cancer Type 2019 & 2032
- Table 32: Global Skin Cancer Treatment Industry Revenue Million Forecast, by Type 2019 & 2032
- Table 33: Global Skin Cancer Treatment Industry Revenue Million Forecast, by Country 2019 & 2032
- Table 34: United States Skin Cancer Treatment Industry Revenue (Million) Forecast, by Application 2019 & 2032
- Table 35: Canada Skin Cancer Treatment Industry Revenue (Million) Forecast, by Application 2019 & 2032
- Table 36: Mexico Skin Cancer Treatment Industry Revenue (Million) Forecast, by Application 2019 & 2032
- Table 37: Global Skin Cancer Treatment Industry Revenue Million Forecast, by Cancer Type 2019 & 2032
- Table 38: Global Skin Cancer Treatment Industry Revenue Million Forecast, by Type 2019 & 2032
- Table 39: Global Skin Cancer Treatment Industry Revenue Million Forecast, by Country 2019 & 2032
- Table 40: Germany Skin Cancer Treatment Industry Revenue (Million) Forecast, by Application 2019 & 2032
- Table 41: United Kingdom Skin Cancer Treatment Industry Revenue (Million) Forecast, by Application 2019 & 2032
- Table 42: France Skin Cancer Treatment Industry Revenue (Million) Forecast, by Application 2019 & 2032
- Table 43: Italy Skin Cancer Treatment Industry Revenue (Million) Forecast, by Application 2019 & 2032
- Table 44: Spain Skin Cancer Treatment Industry Revenue (Million) Forecast, by Application 2019 & 2032
- Table 45: Rest of Europe Skin Cancer Treatment Industry Revenue (Million) Forecast, by Application 2019 & 2032
- Table 46: Global Skin Cancer Treatment Industry Revenue Million Forecast, by Cancer Type 2019 & 2032
- Table 47: Global Skin Cancer Treatment Industry Revenue Million Forecast, by Type 2019 & 2032
- Table 48: Global Skin Cancer Treatment Industry Revenue Million Forecast, by Country 2019 & 2032
- Table 49: China Skin Cancer Treatment Industry Revenue (Million) Forecast, by Application 2019 & 2032
- Table 50: Japan Skin Cancer Treatment Industry Revenue (Million) Forecast, by Application 2019 & 2032
- Table 51: India Skin Cancer Treatment Industry Revenue (Million) Forecast, by Application 2019 & 2032
- Table 52: Australia Skin Cancer Treatment Industry Revenue (Million) Forecast, by Application 2019 & 2032
- Table 53: South Korea Skin Cancer Treatment Industry Revenue (Million) Forecast, by Application 2019 & 2032
- Table 54: Rest of Asia Pacific Skin Cancer Treatment Industry Revenue (Million) Forecast, by Application 2019 & 2032
- Table 55: Global Skin Cancer Treatment Industry Revenue Million Forecast, by Cancer Type 2019 & 2032
- Table 56: Global Skin Cancer Treatment Industry Revenue Million Forecast, by Type 2019 & 2032
- Table 57: Global Skin Cancer Treatment Industry Revenue Million Forecast, by Country 2019 & 2032
- Table 58: GCC Skin Cancer Treatment Industry Revenue (Million) Forecast, by Application 2019 & 2032
- Table 59: South Africa Skin Cancer Treatment Industry Revenue (Million) Forecast, by Application 2019 & 2032
- Table 60: Rest of Middle East and Africa Skin Cancer Treatment Industry Revenue (Million) Forecast, by Application 2019 & 2032
- Table 61: Global Skin Cancer Treatment Industry Revenue Million Forecast, by Cancer Type 2019 & 2032
- Table 62: Global Skin Cancer Treatment Industry Revenue Million Forecast, by Type 2019 & 2032
- Table 63: Global Skin Cancer Treatment Industry Revenue Million Forecast, by Country 2019 & 2032
- Table 64: Brazil Skin Cancer Treatment Industry Revenue (Million) Forecast, by Application 2019 & 2032
- Table 65: Argentina Skin Cancer Treatment Industry Revenue (Million) Forecast, by Application 2019 & 2032
- Table 66: Rest of South America Skin Cancer Treatment Industry Revenue (Million) Forecast, by Application 2019 & 2032
Frequently Asked Questions
1. What is the projected Compound Annual Growth Rate (CAGR) of the Skin Cancer Treatment Industry?
The projected CAGR is approximately 5.21%.
2. Which companies are prominent players in the Skin Cancer Treatment Industry?
Key companies in the market include Sirnaomics Inc *List Not Exhaustive, Daiichi Sankyo Company Limited, Sanofi, Novartis AG, Amgen Inc, Merck & Co Inc, F Hoffmann-La Roche Ltd, Abbott, Labcorp, Sun Pharmaceutical Industries Ltd, QIAGEN, Bristol-Myers Squibb Company, Pfizer Inc.
3. What are the main segments of the Skin Cancer Treatment Industry?
The market segments include Cancer Type, Type.
4. Can you provide details about the market size?
The market size is estimated to be USD 13.82 Million as of 2022.
5. What are some drivers contributing to market growth?
Increasing Incidence of Skin Cancer; Rising Awareness About Skin Cancer; Extensive Research and Developments.
6. What are the notable trends driving market growth?
Non-Melanoma by Cancer Type Segment is Expected to Grow Over the Forecast Period.
7. Are there any restraints impacting market growth?
High Cost Associated with Therapy; Stringent Regulatory Framework.
8. Can you provide examples of recent developments in the market?
In March 2022, the United States Food and Drug Administration approved nivolumab and relatlimab-rmbw (Opdualag, Bristol-Myers Squibb Company) for adult and pediatric patients 12 years of age or older with unresectable or metastatic melanoma. Opdualag is a fixed-dose combination of the LAG-3-blocking antibody relatlimab and the programmed death receptor-1 blocking antibody nivolumab.
9. What pricing options are available for accessing the report?
Pricing options include single-user, multi-user, and enterprise licenses priced at USD 4750, USD 5250, and USD 8750 respectively.
10. Is the market size provided in terms of value or volume?
The market size is provided in terms of value, measured in Million.
11. Are there any specific market keywords associated with the report?
Yes, the market keyword associated with the report is "Skin Cancer Treatment Industry," which aids in identifying and referencing the specific market segment covered.
12. How do I determine which pricing option suits my needs best?
The pricing options vary based on user requirements and access needs. Individual users may opt for single-user licenses, while businesses requiring broader access may choose multi-user or enterprise licenses for cost-effective access to the report.
13. Are there any additional resources or data provided in the Skin Cancer Treatment Industry report?
While the report offers comprehensive insights, it's advisable to review the specific contents or supplementary materials provided to ascertain if additional resources or data are available.
14. How can I stay updated on further developments or reports in the Skin Cancer Treatment Industry?
To stay informed about further developments, trends, and reports in the Skin Cancer Treatment Industry, consider subscribing to industry newsletters, following relevant companies and organizations, or regularly checking reputable industry news sources and publications.
Methodology
Step 1 - Identification of Relevant Samples Size from Population Database


Step 2 - Approaches for Defining Global Market Size (Value, Volume* & Price*)

Note*: In applicable scenarios
Step 3 - Data Sources
Primary Research
- Web Analytics
- Survey Reports
- Research Institute
- Latest Research Reports
- Opinion Leaders
Secondary Research
- Annual Reports
- White Paper
- Latest Press Release
- Industry Association
- Paid Database
- Investor Presentations

Step 4 - Data Triangulation
Involves using different sources of information in order to increase the validity of a study
These sources are likely to be stakeholders in a program - participants, other researchers, program staff, other community members, and so on.
Then we put all data in single framework & apply various statistical tools to find out the dynamic on the market.
During the analysis stage, feedback from the stakeholder groups would be compared to determine areas of agreement as well as areas of divergence
