

Key Insights
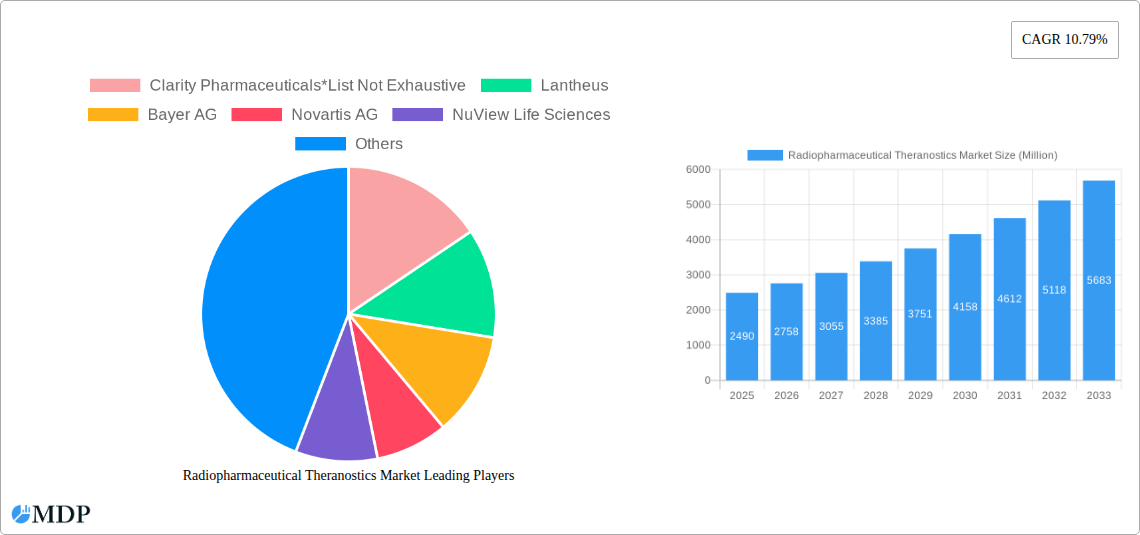
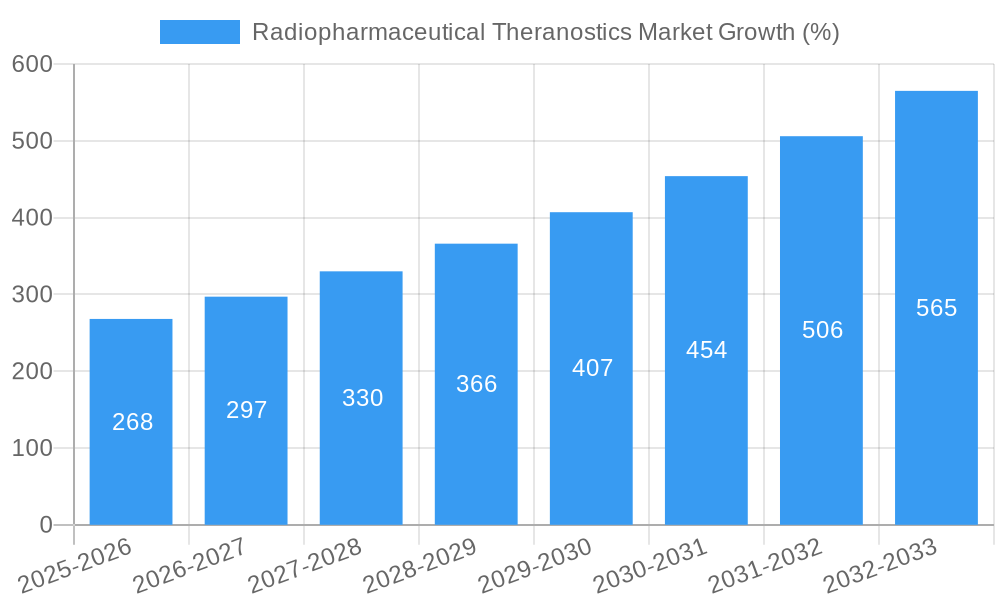
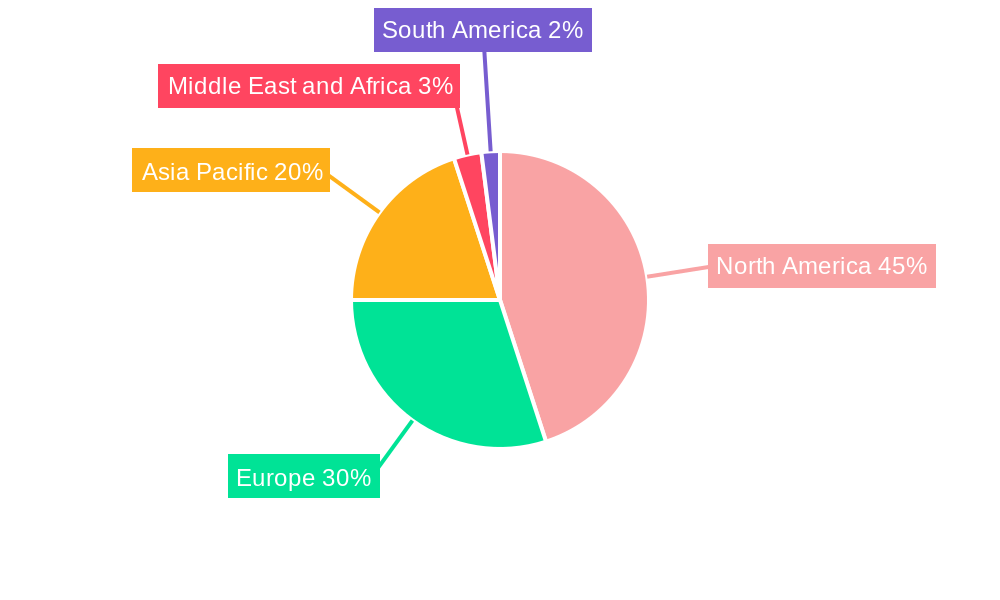
The radiopharmaceutical theranostics market, valued at $2.49 billion in 2025, is projected to experience robust growth, exhibiting a compound annual growth rate (CAGR) of 10.79% from 2025 to 2033. This expansion is driven by several key factors. The increasing prevalence of cancer and other debilitating diseases requiring precise and personalized treatment fuels demand for theranostic radiopharmaceuticals. Advancements in radioisotope technology, particularly in targeted drug delivery systems and imaging techniques, are significantly improving diagnostic accuracy and therapeutic efficacy. Furthermore, growing research and development activities focused on developing novel radiopharmaceuticals are contributing to market growth. The market is segmented by type (companion diagnostic and therapeutic radiopharmaceuticals), radioisotopes (Technetium, Gallium, Iodine, Lutetium, Copper, and others), source (nuclear reactors and cyclotrons), application (oncology, cardiology, neurology, and others), and end-user (hospitals, diagnostic imaging centers, research institutes, and others). The North American market currently holds a significant share, attributable to advanced healthcare infrastructure, higher adoption rates of innovative therapies, and substantial funding for research. However, Asia Pacific is expected to witness rapid growth due to increasing healthcare expenditure and a rising prevalence of target diseases.
Competitive dynamics within the market are intense, with major players such as Lantheus, Bayer AG, Novartis AG, and GE Healthcare vying for market share. The emergence of smaller, specialized companies focused on developing innovative radiopharmaceuticals further intensifies competition. While the market faces challenges such as stringent regulatory approvals and high manufacturing costs, the significant advantages offered by theranostics in terms of improved patient outcomes and reduced healthcare costs are likely to outweigh these hurdles. The future trajectory of the market is optimistic, anticipating continued expansion driven by technological innovation, increasing disease prevalence, and growing investments in the sector. The focus on personalized medicine and the development of more effective and safer radiopharmaceuticals will further propel market growth throughout the forecast period.
Radiopharmaceutical Theranostics Market: A Comprehensive Report (2019-2033)
This comprehensive report provides a detailed analysis of the Radiopharmaceutical Theranostics market, offering invaluable insights for stakeholders across the industry. With a study period spanning 2019-2033, a base year of 2025, and a forecast period of 2025-2033, this report offers a complete understanding of past performance, present market dynamics, and future growth potential. The market is projected to reach xx Million by 2033, exhibiting a healthy CAGR of xx% during the forecast period.
Radiopharmaceutical Theranostics Market Dynamics & Concentration
The Radiopharmaceutical Theranostics market is characterized by a moderately concentrated landscape with key players such as Clarity Pharmaceuticals, Lantheus, Bayer AG, Novartis AG, and others actively shaping market dynamics. Market concentration is influenced by factors including regulatory approvals, technological advancements, and strategic collaborations. The market share of the top five players is estimated at xx%, indicating both consolidation and opportunity for emerging players.
- Innovation Drivers: Continuous advancements in radioisotope technology, targeted drug delivery systems, and imaging techniques are driving market growth. The development of novel radiopharmaceuticals for specific cancer types is a key innovation focus.
- Regulatory Frameworks: Stringent regulatory approvals and guidelines impact market entry and product development timelines. Navigating these regulations is crucial for market success.
- Product Substitutes: While there are limited direct substitutes, advancements in other imaging modalities and cancer therapies present indirect competition.
- End-User Trends: Increasing prevalence of chronic diseases, particularly cancer, coupled with a growing preference for minimally invasive treatment options, fuels market demand. Hospitals and diagnostic imaging centers constitute the largest end-user segment.
- M&A Activities: The market has witnessed a significant number of mergers and acquisitions (M&As) in recent years, totaling xx deals in the past five years. These activities reflect the strategic importance of this sector and the pursuit of expansion by established players.
Radiopharmaceutical Theranostics Market Industry Trends & Analysis
The Radiopharmaceutical Theranostics market exhibits robust growth driven by several key factors. The increasing prevalence of cancer globally is a primary driver, demanding advanced diagnostic and therapeutic solutions. Technological advancements, including the development of novel radioisotopes and targeted delivery systems, further accelerate market expansion. Consumer preference for minimally invasive procedures and personalized medicine reinforces the demand for radiopharmaceutical theranostics. Competitive dynamics are shaped by collaborations, strategic alliances, and the continuous introduction of innovative products. The market penetration of targeted therapeutic radiopharmaceuticals is expected to increase significantly during the forecast period, reaching xx% by 2033.
Leading Markets & Segments in Radiopharmaceutical Theranostics Market
North America currently dominates the Radiopharmaceutical Theranostics market, driven by robust healthcare infrastructure, high disease prevalence, and strong regulatory support. However, the Asia-Pacific region is poised for substantial growth due to rising healthcare expenditure and increasing awareness of advanced treatment options.
Dominant Segments:
- By Type: Targeted Therapeutic Radiopharmaceuticals are expected to lead the market owing to their high efficacy in cancer treatment.
- By Radioisotopes: Technetium- and Lutetium (Lu)-based radiopharmaceuticals hold significant market shares, reflecting their established applications in various diagnostic and therapeutic procedures.
- By Source: Cyclotrons are preferred over nuclear reactors due to their flexibility and ability to produce a wider range of radioisotopes.
- By Application: Oncology remains the dominant application area, followed by cardiology and neurology.
- By End User: Hospitals and diagnostic imaging centers form the largest end-user segment.
Key Drivers for Leading Regions/Segments:
- North America: Strong R&D infrastructure, high healthcare expenditure, and early adoption of innovative technologies.
- Europe: Well-established healthcare systems and increasing focus on personalized medicine.
- Asia-Pacific: Rising healthcare expenditure, growing awareness of advanced medical treatments, and increasing prevalence of target diseases.
Radiopharmaceutical Theranostics Market Product Developments
Recent product innovations focus on enhancing the therapeutic efficacy and reducing the side effects of radiopharmaceuticals. This includes advancements in targeted delivery systems, improved radioisotope production methods, and the development of theranostic agents that integrate both diagnostic and therapeutic functionalities. These innovations are strategically aligned to meet the evolving needs of patients and healthcare professionals.
Key Drivers of Radiopharmaceutical Theranostics Market Growth
Several factors contribute to the market's growth trajectory:
- Technological advancements: The development of novel radioisotopes, targeted drug delivery systems, and advanced imaging techniques fuels market expansion.
- Rising prevalence of cancer: The increasing incidence of cancer globally creates significant demand for effective diagnostic and therapeutic solutions.
- Favorable regulatory environment: Supportive regulatory frameworks accelerate the development and market entry of innovative radiopharmaceuticals.
Challenges in the Radiopharmaceutical Theranostics Market
The market faces certain challenges including:
- Stringent regulatory hurdles: The approval process for new radiopharmaceuticals is complex and time-consuming.
- Supply chain complexities: The production and distribution of radiopharmaceuticals necessitate specialized infrastructure and logistics.
- High treatment costs: The cost of radiopharmaceutical therapies can limit accessibility for some patients.
Emerging Opportunities in the Radiopharmaceutical Theranostics Market
The market presents several promising opportunities:
- Technological breakthroughs: Continuous innovation in radioisotope technology, targeted drug delivery, and imaging techniques promise significant advancements in treatment efficacy and patient outcomes.
- Strategic partnerships: Collaborations between pharmaceutical companies, research institutions, and healthcare providers can accelerate product development and market access.
- Market expansion: Emerging markets in Asia and other developing regions offer substantial untapped potential for growth.
Leading Players in the Radiopharmaceutical Theranostics Market Sector
- Clarity Pharmaceuticals
- Lantheus
- Bayer AG
- Novartis AG
- NuView Life Sciences
- Telix Pharmaceuticals Limited
- GE HealthCare
- Cardinal Health
- ARICEUM THERAPEUTICS
- Curium
- Jubilant Radiopharma
Key Milestones in Radiopharmaceutical Theranostics Market Industry
- March 2023: Radiopharm Theranostics plans to acquire Pharma15 Corporation, expanding its portfolio of therapeutic radiopharmaceuticals for prostate cancer.
- March 2023: Radiopharm Theranostics and GenesisCare collaborate on a two-year research initiative to develop novel radiopharmaceuticals for complex cancers. These developments significantly impact market dynamics by expanding product pipelines and fostering innovation.
Strategic Outlook for Radiopharmaceutical Theranostics Market Market
The future of the Radiopharmaceutical Theranostics market is bright, fueled by continuous technological advancements, growing disease prevalence, and increasing investments in R&D. Strategic partnerships, market expansion efforts, and the development of novel radiopharmaceuticals will shape the market's future landscape, creating significant opportunities for growth and innovation.
Radiopharmaceutical Theranostics Market Segmentation
-
1. Type
- 1.1. Companion Diagnostic Radiopharmaceuticals
- 1.2. Targeted Therapeutic Radiopharmaceuticals
-
2. Radioisotopes
- 2.1. Technetium-99
- 2.2. Gallium-68
- 2.3. Iodine-131
- 2.4. Lutetium (Lu)- 177
- 2.5. Copper (Cu)- 67 & 64
- 2.6. Other Radioisotopes
-
3. Source
- 3.1. Nuclear Reactors
- 3.2. Cyclotrons
-
4. Application
- 4.1. Oncology
- 4.2. Cardiology
- 4.3. Neurology
- 4.4. Other Applications
-
5. End User
- 5.1. Hospitals
- 5.2. Diagnostic Imaging Centers
- 5.3. Research Institutes
- 5.4. Other End Users
Radiopharmaceutical Theranostics Market Segmentation By Geography
-
1. North America
- 1.1. United States
- 1.2. Canada
- 1.3. Mexico
-
2. Europe
- 2.1. Germany
- 2.2. United Kingdom
- 2.3. France
- 2.4. Italy
- 2.5. Spain
- 2.6. Rest of Europe
-
3. Asia Pacific
- 3.1. China
- 3.2. Japan
- 3.3. India
- 3.4. Australia
- 3.5. South Korea
- 3.6. Rest of Asia Pacific
-
4. Middle East and Africa
- 4.1. GCC
- 4.2. South Africa
- 4.3. Rest of Middle East and Africa
-
5. South America
- 5.1. Brazil
- 5.2. Argentina
- 5.3. Rest of South America
Radiopharmaceutical Theranostics Market REPORT HIGHLIGHTS
| Aspects | Details |
|---|---|
| Study Period | 2019-2033 |
| Base Year | 2024 |
| Estimated Year | 2025 |
| Forecast Period | 2025-2033 |
| Historical Period | 2019-2024 |
| Growth Rate | CAGR of 10.79% from 2019-2033 |
| Segmentation |
|
Table of Contents
- 1. Introduction
- 1.1. Research Scope
- 1.2. Market Segmentation
- 1.3. Research Methodology
- 1.4. Definitions and Assumptions
- 2. Executive Summary
- 2.1. Introduction
- 3. Market Dynamics
- 3.1. Introduction
- 3.2. Market Drivers
- 3.2.1. Advancements in Targeted Cancer Therapies; Growing Emphasis on Personalized Medicine; Expanding Applications in Diagnostic Imaging
- 3.3. Market Restrains
- 3.3.1. Supply Chain Complexities and Limited Production Capacity; Regulatory Challenges and Approval Processes
- 3.4. Market Trends
- 3.4.1. The Companion Diagnostic Radiopharmaceuticals Segment is Expected to Dominate the Radiopharmaceutical Theranostics Market During the Forecast Period
- 4. Market Factor Analysis
- 4.1. Porters Five Forces
- 4.2. Supply/Value Chain
- 4.3. PESTEL analysis
- 4.4. Market Entropy
- 4.5. Patent/Trademark Analysis
- 5. Global Radiopharmaceutical Theranostics Market Analysis, Insights and Forecast, 2019-2031
- 5.1. Market Analysis, Insights and Forecast - by Type
- 5.1.1. Companion Diagnostic Radiopharmaceuticals
- 5.1.2. Targeted Therapeutic Radiopharmaceuticals
- 5.2. Market Analysis, Insights and Forecast - by Radioisotopes
- 5.2.1. Technetium-99
- 5.2.2. Gallium-68
- 5.2.3. Iodine-131
- 5.2.4. Lutetium (Lu)- 177
- 5.2.5. Copper (Cu)- 67 & 64
- 5.2.6. Other Radioisotopes
- 5.3. Market Analysis, Insights and Forecast - by Source
- 5.3.1. Nuclear Reactors
- 5.3.2. Cyclotrons
- 5.4. Market Analysis, Insights and Forecast - by Application
- 5.4.1. Oncology
- 5.4.2. Cardiology
- 5.4.3. Neurology
- 5.4.4. Other Applications
- 5.5. Market Analysis, Insights and Forecast - by End User
- 5.5.1. Hospitals
- 5.5.2. Diagnostic Imaging Centers
- 5.5.3. Research Institutes
- 5.5.4. Other End Users
- 5.6. Market Analysis, Insights and Forecast - by Region
- 5.6.1. North America
- 5.6.2. Europe
- 5.6.3. Asia Pacific
- 5.6.4. Middle East and Africa
- 5.6.5. South America
- 5.1. Market Analysis, Insights and Forecast - by Type
- 6. North America Radiopharmaceutical Theranostics Market Analysis, Insights and Forecast, 2019-2031
- 6.1. Market Analysis, Insights and Forecast - by Type
- 6.1.1. Companion Diagnostic Radiopharmaceuticals
- 6.1.2. Targeted Therapeutic Radiopharmaceuticals
- 6.2. Market Analysis, Insights and Forecast - by Radioisotopes
- 6.2.1. Technetium-99
- 6.2.2. Gallium-68
- 6.2.3. Iodine-131
- 6.2.4. Lutetium (Lu)- 177
- 6.2.5. Copper (Cu)- 67 & 64
- 6.2.6. Other Radioisotopes
- 6.3. Market Analysis, Insights and Forecast - by Source
- 6.3.1. Nuclear Reactors
- 6.3.2. Cyclotrons
- 6.4. Market Analysis, Insights and Forecast - by Application
- 6.4.1. Oncology
- 6.4.2. Cardiology
- 6.4.3. Neurology
- 6.4.4. Other Applications
- 6.5. Market Analysis, Insights and Forecast - by End User
- 6.5.1. Hospitals
- 6.5.2. Diagnostic Imaging Centers
- 6.5.3. Research Institutes
- 6.5.4. Other End Users
- 6.1. Market Analysis, Insights and Forecast - by Type
- 7. Europe Radiopharmaceutical Theranostics Market Analysis, Insights and Forecast, 2019-2031
- 7.1. Market Analysis, Insights and Forecast - by Type
- 7.1.1. Companion Diagnostic Radiopharmaceuticals
- 7.1.2. Targeted Therapeutic Radiopharmaceuticals
- 7.2. Market Analysis, Insights and Forecast - by Radioisotopes
- 7.2.1. Technetium-99
- 7.2.2. Gallium-68
- 7.2.3. Iodine-131
- 7.2.4. Lutetium (Lu)- 177
- 7.2.5. Copper (Cu)- 67 & 64
- 7.2.6. Other Radioisotopes
- 7.3. Market Analysis, Insights and Forecast - by Source
- 7.3.1. Nuclear Reactors
- 7.3.2. Cyclotrons
- 7.4. Market Analysis, Insights and Forecast - by Application
- 7.4.1. Oncology
- 7.4.2. Cardiology
- 7.4.3. Neurology
- 7.4.4. Other Applications
- 7.5. Market Analysis, Insights and Forecast - by End User
- 7.5.1. Hospitals
- 7.5.2. Diagnostic Imaging Centers
- 7.5.3. Research Institutes
- 7.5.4. Other End Users
- 7.1. Market Analysis, Insights and Forecast - by Type
- 8. Asia Pacific Radiopharmaceutical Theranostics Market Analysis, Insights and Forecast, 2019-2031
- 8.1. Market Analysis, Insights and Forecast - by Type
- 8.1.1. Companion Diagnostic Radiopharmaceuticals
- 8.1.2. Targeted Therapeutic Radiopharmaceuticals
- 8.2. Market Analysis, Insights and Forecast - by Radioisotopes
- 8.2.1. Technetium-99
- 8.2.2. Gallium-68
- 8.2.3. Iodine-131
- 8.2.4. Lutetium (Lu)- 177
- 8.2.5. Copper (Cu)- 67 & 64
- 8.2.6. Other Radioisotopes
- 8.3. Market Analysis, Insights and Forecast - by Source
- 8.3.1. Nuclear Reactors
- 8.3.2. Cyclotrons
- 8.4. Market Analysis, Insights and Forecast - by Application
- 8.4.1. Oncology
- 8.4.2. Cardiology
- 8.4.3. Neurology
- 8.4.4. Other Applications
- 8.5. Market Analysis, Insights and Forecast - by End User
- 8.5.1. Hospitals
- 8.5.2. Diagnostic Imaging Centers
- 8.5.3. Research Institutes
- 8.5.4. Other End Users
- 8.1. Market Analysis, Insights and Forecast - by Type
- 9. Middle East and Africa Radiopharmaceutical Theranostics Market Analysis, Insights and Forecast, 2019-2031
- 9.1. Market Analysis, Insights and Forecast - by Type
- 9.1.1. Companion Diagnostic Radiopharmaceuticals
- 9.1.2. Targeted Therapeutic Radiopharmaceuticals
- 9.2. Market Analysis, Insights and Forecast - by Radioisotopes
- 9.2.1. Technetium-99
- 9.2.2. Gallium-68
- 9.2.3. Iodine-131
- 9.2.4. Lutetium (Lu)- 177
- 9.2.5. Copper (Cu)- 67 & 64
- 9.2.6. Other Radioisotopes
- 9.3. Market Analysis, Insights and Forecast - by Source
- 9.3.1. Nuclear Reactors
- 9.3.2. Cyclotrons
- 9.4. Market Analysis, Insights and Forecast - by Application
- 9.4.1. Oncology
- 9.4.2. Cardiology
- 9.4.3. Neurology
- 9.4.4. Other Applications
- 9.5. Market Analysis, Insights and Forecast - by End User
- 9.5.1. Hospitals
- 9.5.2. Diagnostic Imaging Centers
- 9.5.3. Research Institutes
- 9.5.4. Other End Users
- 9.1. Market Analysis, Insights and Forecast - by Type
- 10. South America Radiopharmaceutical Theranostics Market Analysis, Insights and Forecast, 2019-2031
- 10.1. Market Analysis, Insights and Forecast - by Type
- 10.1.1. Companion Diagnostic Radiopharmaceuticals
- 10.1.2. Targeted Therapeutic Radiopharmaceuticals
- 10.2. Market Analysis, Insights and Forecast - by Radioisotopes
- 10.2.1. Technetium-99
- 10.2.2. Gallium-68
- 10.2.3. Iodine-131
- 10.2.4. Lutetium (Lu)- 177
- 10.2.5. Copper (Cu)- 67 & 64
- 10.2.6. Other Radioisotopes
- 10.3. Market Analysis, Insights and Forecast - by Source
- 10.3.1. Nuclear Reactors
- 10.3.2. Cyclotrons
- 10.4. Market Analysis, Insights and Forecast - by Application
- 10.4.1. Oncology
- 10.4.2. Cardiology
- 10.4.3. Neurology
- 10.4.4. Other Applications
- 10.5. Market Analysis, Insights and Forecast - by End User
- 10.5.1. Hospitals
- 10.5.2. Diagnostic Imaging Centers
- 10.5.3. Research Institutes
- 10.5.4. Other End Users
- 10.1. Market Analysis, Insights and Forecast - by Type
- 11. North America Radiopharmaceutical Theranostics Market Analysis, Insights and Forecast, 2019-2031
- 11.1. Market Analysis, Insights and Forecast - By Country/Sub-region
- 11.1.1 United States
- 11.1.2 Canada
- 11.1.3 Mexico
- 12. Europe Radiopharmaceutical Theranostics Market Analysis, Insights and Forecast, 2019-2031
- 12.1. Market Analysis, Insights and Forecast - By Country/Sub-region
- 12.1.1 Germany
- 12.1.2 United Kingdom
- 12.1.3 France
- 12.1.4 Italy
- 12.1.5 Spain
- 12.1.6 Rest of Europe
- 13. Asia Pacific Radiopharmaceutical Theranostics Market Analysis, Insights and Forecast, 2019-2031
- 13.1. Market Analysis, Insights and Forecast - By Country/Sub-region
- 13.1.1 China
- 13.1.2 Japan
- 13.1.3 India
- 13.1.4 Australia
- 13.1.5 South Korea
- 13.1.6 Rest of Asia Pacific
- 14. Middle East and Africa Radiopharmaceutical Theranostics Market Analysis, Insights and Forecast, 2019-2031
- 14.1. Market Analysis, Insights and Forecast - By Country/Sub-region
- 14.1.1 GCC
- 14.1.2 South Africa
- 14.1.3 Rest of Middle East and Africa
- 15. South America Radiopharmaceutical Theranostics Market Analysis, Insights and Forecast, 2019-2031
- 15.1. Market Analysis, Insights and Forecast - By Country/Sub-region
- 15.1.1 Brazil
- 15.1.2 Argentina
- 15.1.3 Rest of South America
- 16. Competitive Analysis
- 16.1. Global Market Share Analysis 2024
- 16.2. Company Profiles
- 16.2.1 Clarity Pharmaceuticals*List Not Exhaustive
- 16.2.1.1. Overview
- 16.2.1.2. Products
- 16.2.1.3. SWOT Analysis
- 16.2.1.4. Recent Developments
- 16.2.1.5. Financials (Based on Availability)
- 16.2.2 Lantheus
- 16.2.2.1. Overview
- 16.2.2.2. Products
- 16.2.2.3. SWOT Analysis
- 16.2.2.4. Recent Developments
- 16.2.2.5. Financials (Based on Availability)
- 16.2.3 Bayer AG
- 16.2.3.1. Overview
- 16.2.3.2. Products
- 16.2.3.3. SWOT Analysis
- 16.2.3.4. Recent Developments
- 16.2.3.5. Financials (Based on Availability)
- 16.2.4 Novartis AG
- 16.2.4.1. Overview
- 16.2.4.2. Products
- 16.2.4.3. SWOT Analysis
- 16.2.4.4. Recent Developments
- 16.2.4.5. Financials (Based on Availability)
- 16.2.5 NuView Life Sciences
- 16.2.5.1. Overview
- 16.2.5.2. Products
- 16.2.5.3. SWOT Analysis
- 16.2.5.4. Recent Developments
- 16.2.5.5. Financials (Based on Availability)
- 16.2.6 Telix Pharmaceuticals Limited
- 16.2.6.1. Overview
- 16.2.6.2. Products
- 16.2.6.3. SWOT Analysis
- 16.2.6.4. Recent Developments
- 16.2.6.5. Financials (Based on Availability)
- 16.2.7 GE HealthCare
- 16.2.7.1. Overview
- 16.2.7.2. Products
- 16.2.7.3. SWOT Analysis
- 16.2.7.4. Recent Developments
- 16.2.7.5. Financials (Based on Availability)
- 16.2.8 Cardinal Health
- 16.2.8.1. Overview
- 16.2.8.2. Products
- 16.2.8.3. SWOT Analysis
- 16.2.8.4. Recent Developments
- 16.2.8.5. Financials (Based on Availability)
- 16.2.9 ARICEUM THERAPEUTICS
- 16.2.9.1. Overview
- 16.2.9.2. Products
- 16.2.9.3. SWOT Analysis
- 16.2.9.4. Recent Developments
- 16.2.9.5. Financials (Based on Availability)
- 16.2.10 Curium
- 16.2.10.1. Overview
- 16.2.10.2. Products
- 16.2.10.3. SWOT Analysis
- 16.2.10.4. Recent Developments
- 16.2.10.5. Financials (Based on Availability)
- 16.2.11 Jubilant Radiopharma
- 16.2.11.1. Overview
- 16.2.11.2. Products
- 16.2.11.3. SWOT Analysis
- 16.2.11.4. Recent Developments
- 16.2.11.5. Financials (Based on Availability)
- 16.2.1 Clarity Pharmaceuticals*List Not Exhaustive
List of Figures
- Figure 1: Global Radiopharmaceutical Theranostics Market Revenue Breakdown (Million, %) by Region 2024 & 2032
- Figure 2: North America Radiopharmaceutical Theranostics Market Revenue (Million), by Country 2024 & 2032
- Figure 3: North America Radiopharmaceutical Theranostics Market Revenue Share (%), by Country 2024 & 2032
- Figure 4: Europe Radiopharmaceutical Theranostics Market Revenue (Million), by Country 2024 & 2032
- Figure 5: Europe Radiopharmaceutical Theranostics Market Revenue Share (%), by Country 2024 & 2032
- Figure 6: Asia Pacific Radiopharmaceutical Theranostics Market Revenue (Million), by Country 2024 & 2032
- Figure 7: Asia Pacific Radiopharmaceutical Theranostics Market Revenue Share (%), by Country 2024 & 2032
- Figure 8: Middle East and Africa Radiopharmaceutical Theranostics Market Revenue (Million), by Country 2024 & 2032
- Figure 9: Middle East and Africa Radiopharmaceutical Theranostics Market Revenue Share (%), by Country 2024 & 2032
- Figure 10: South America Radiopharmaceutical Theranostics Market Revenue (Million), by Country 2024 & 2032
- Figure 11: South America Radiopharmaceutical Theranostics Market Revenue Share (%), by Country 2024 & 2032
- Figure 12: North America Radiopharmaceutical Theranostics Market Revenue (Million), by Type 2024 & 2032
- Figure 13: North America Radiopharmaceutical Theranostics Market Revenue Share (%), by Type 2024 & 2032
- Figure 14: North America Radiopharmaceutical Theranostics Market Revenue (Million), by Radioisotopes 2024 & 2032
- Figure 15: North America Radiopharmaceutical Theranostics Market Revenue Share (%), by Radioisotopes 2024 & 2032
- Figure 16: North America Radiopharmaceutical Theranostics Market Revenue (Million), by Source 2024 & 2032
- Figure 17: North America Radiopharmaceutical Theranostics Market Revenue Share (%), by Source 2024 & 2032
- Figure 18: North America Radiopharmaceutical Theranostics Market Revenue (Million), by Application 2024 & 2032
- Figure 19: North America Radiopharmaceutical Theranostics Market Revenue Share (%), by Application 2024 & 2032
- Figure 20: North America Radiopharmaceutical Theranostics Market Revenue (Million), by End User 2024 & 2032
- Figure 21: North America Radiopharmaceutical Theranostics Market Revenue Share (%), by End User 2024 & 2032
- Figure 22: North America Radiopharmaceutical Theranostics Market Revenue (Million), by Country 2024 & 2032
- Figure 23: North America Radiopharmaceutical Theranostics Market Revenue Share (%), by Country 2024 & 2032
- Figure 24: Europe Radiopharmaceutical Theranostics Market Revenue (Million), by Type 2024 & 2032
- Figure 25: Europe Radiopharmaceutical Theranostics Market Revenue Share (%), by Type 2024 & 2032
- Figure 26: Europe Radiopharmaceutical Theranostics Market Revenue (Million), by Radioisotopes 2024 & 2032
- Figure 27: Europe Radiopharmaceutical Theranostics Market Revenue Share (%), by Radioisotopes 2024 & 2032
- Figure 28: Europe Radiopharmaceutical Theranostics Market Revenue (Million), by Source 2024 & 2032
- Figure 29: Europe Radiopharmaceutical Theranostics Market Revenue Share (%), by Source 2024 & 2032
- Figure 30: Europe Radiopharmaceutical Theranostics Market Revenue (Million), by Application 2024 & 2032
- Figure 31: Europe Radiopharmaceutical Theranostics Market Revenue Share (%), by Application 2024 & 2032
- Figure 32: Europe Radiopharmaceutical Theranostics Market Revenue (Million), by End User 2024 & 2032
- Figure 33: Europe Radiopharmaceutical Theranostics Market Revenue Share (%), by End User 2024 & 2032
- Figure 34: Europe Radiopharmaceutical Theranostics Market Revenue (Million), by Country 2024 & 2032
- Figure 35: Europe Radiopharmaceutical Theranostics Market Revenue Share (%), by Country 2024 & 2032
- Figure 36: Asia Pacific Radiopharmaceutical Theranostics Market Revenue (Million), by Type 2024 & 2032
- Figure 37: Asia Pacific Radiopharmaceutical Theranostics Market Revenue Share (%), by Type 2024 & 2032
- Figure 38: Asia Pacific Radiopharmaceutical Theranostics Market Revenue (Million), by Radioisotopes 2024 & 2032
- Figure 39: Asia Pacific Radiopharmaceutical Theranostics Market Revenue Share (%), by Radioisotopes 2024 & 2032
- Figure 40: Asia Pacific Radiopharmaceutical Theranostics Market Revenue (Million), by Source 2024 & 2032
- Figure 41: Asia Pacific Radiopharmaceutical Theranostics Market Revenue Share (%), by Source 2024 & 2032
- Figure 42: Asia Pacific Radiopharmaceutical Theranostics Market Revenue (Million), by Application 2024 & 2032
- Figure 43: Asia Pacific Radiopharmaceutical Theranostics Market Revenue Share (%), by Application 2024 & 2032
- Figure 44: Asia Pacific Radiopharmaceutical Theranostics Market Revenue (Million), by End User 2024 & 2032
- Figure 45: Asia Pacific Radiopharmaceutical Theranostics Market Revenue Share (%), by End User 2024 & 2032
- Figure 46: Asia Pacific Radiopharmaceutical Theranostics Market Revenue (Million), by Country 2024 & 2032
- Figure 47: Asia Pacific Radiopharmaceutical Theranostics Market Revenue Share (%), by Country 2024 & 2032
- Figure 48: Middle East and Africa Radiopharmaceutical Theranostics Market Revenue (Million), by Type 2024 & 2032
- Figure 49: Middle East and Africa Radiopharmaceutical Theranostics Market Revenue Share (%), by Type 2024 & 2032
- Figure 50: Middle East and Africa Radiopharmaceutical Theranostics Market Revenue (Million), by Radioisotopes 2024 & 2032
- Figure 51: Middle East and Africa Radiopharmaceutical Theranostics Market Revenue Share (%), by Radioisotopes 2024 & 2032
- Figure 52: Middle East and Africa Radiopharmaceutical Theranostics Market Revenue (Million), by Source 2024 & 2032
- Figure 53: Middle East and Africa Radiopharmaceutical Theranostics Market Revenue Share (%), by Source 2024 & 2032
- Figure 54: Middle East and Africa Radiopharmaceutical Theranostics Market Revenue (Million), by Application 2024 & 2032
- Figure 55: Middle East and Africa Radiopharmaceutical Theranostics Market Revenue Share (%), by Application 2024 & 2032
- Figure 56: Middle East and Africa Radiopharmaceutical Theranostics Market Revenue (Million), by End User 2024 & 2032
- Figure 57: Middle East and Africa Radiopharmaceutical Theranostics Market Revenue Share (%), by End User 2024 & 2032
- Figure 58: Middle East and Africa Radiopharmaceutical Theranostics Market Revenue (Million), by Country 2024 & 2032
- Figure 59: Middle East and Africa Radiopharmaceutical Theranostics Market Revenue Share (%), by Country 2024 & 2032
- Figure 60: South America Radiopharmaceutical Theranostics Market Revenue (Million), by Type 2024 & 2032
- Figure 61: South America Radiopharmaceutical Theranostics Market Revenue Share (%), by Type 2024 & 2032
- Figure 62: South America Radiopharmaceutical Theranostics Market Revenue (Million), by Radioisotopes 2024 & 2032
- Figure 63: South America Radiopharmaceutical Theranostics Market Revenue Share (%), by Radioisotopes 2024 & 2032
- Figure 64: South America Radiopharmaceutical Theranostics Market Revenue (Million), by Source 2024 & 2032
- Figure 65: South America Radiopharmaceutical Theranostics Market Revenue Share (%), by Source 2024 & 2032
- Figure 66: South America Radiopharmaceutical Theranostics Market Revenue (Million), by Application 2024 & 2032
- Figure 67: South America Radiopharmaceutical Theranostics Market Revenue Share (%), by Application 2024 & 2032
- Figure 68: South America Radiopharmaceutical Theranostics Market Revenue (Million), by End User 2024 & 2032
- Figure 69: South America Radiopharmaceutical Theranostics Market Revenue Share (%), by End User 2024 & 2032
- Figure 70: South America Radiopharmaceutical Theranostics Market Revenue (Million), by Country 2024 & 2032
- Figure 71: South America Radiopharmaceutical Theranostics Market Revenue Share (%), by Country 2024 & 2032
List of Tables
- Table 1: Global Radiopharmaceutical Theranostics Market Revenue Million Forecast, by Region 2019 & 2032
- Table 2: Global Radiopharmaceutical Theranostics Market Revenue Million Forecast, by Type 2019 & 2032
- Table 3: Global Radiopharmaceutical Theranostics Market Revenue Million Forecast, by Radioisotopes 2019 & 2032
- Table 4: Global Radiopharmaceutical Theranostics Market Revenue Million Forecast, by Source 2019 & 2032
- Table 5: Global Radiopharmaceutical Theranostics Market Revenue Million Forecast, by Application 2019 & 2032
- Table 6: Global Radiopharmaceutical Theranostics Market Revenue Million Forecast, by End User 2019 & 2032
- Table 7: Global Radiopharmaceutical Theranostics Market Revenue Million Forecast, by Region 2019 & 2032
- Table 8: Global Radiopharmaceutical Theranostics Market Revenue Million Forecast, by Country 2019 & 2032
- Table 9: United States Radiopharmaceutical Theranostics Market Revenue (Million) Forecast, by Application 2019 & 2032
- Table 10: Canada Radiopharmaceutical Theranostics Market Revenue (Million) Forecast, by Application 2019 & 2032
- Table 11: Mexico Radiopharmaceutical Theranostics Market Revenue (Million) Forecast, by Application 2019 & 2032
- Table 12: Global Radiopharmaceutical Theranostics Market Revenue Million Forecast, by Country 2019 & 2032
- Table 13: Germany Radiopharmaceutical Theranostics Market Revenue (Million) Forecast, by Application 2019 & 2032
- Table 14: United Kingdom Radiopharmaceutical Theranostics Market Revenue (Million) Forecast, by Application 2019 & 2032
- Table 15: France Radiopharmaceutical Theranostics Market Revenue (Million) Forecast, by Application 2019 & 2032
- Table 16: Italy Radiopharmaceutical Theranostics Market Revenue (Million) Forecast, by Application 2019 & 2032
- Table 17: Spain Radiopharmaceutical Theranostics Market Revenue (Million) Forecast, by Application 2019 & 2032
- Table 18: Rest of Europe Radiopharmaceutical Theranostics Market Revenue (Million) Forecast, by Application 2019 & 2032
- Table 19: Global Radiopharmaceutical Theranostics Market Revenue Million Forecast, by Country 2019 & 2032
- Table 20: China Radiopharmaceutical Theranostics Market Revenue (Million) Forecast, by Application 2019 & 2032
- Table 21: Japan Radiopharmaceutical Theranostics Market Revenue (Million) Forecast, by Application 2019 & 2032
- Table 22: India Radiopharmaceutical Theranostics Market Revenue (Million) Forecast, by Application 2019 & 2032
- Table 23: Australia Radiopharmaceutical Theranostics Market Revenue (Million) Forecast, by Application 2019 & 2032
- Table 24: South Korea Radiopharmaceutical Theranostics Market Revenue (Million) Forecast, by Application 2019 & 2032
- Table 25: Rest of Asia Pacific Radiopharmaceutical Theranostics Market Revenue (Million) Forecast, by Application 2019 & 2032
- Table 26: Global Radiopharmaceutical Theranostics Market Revenue Million Forecast, by Country 2019 & 2032
- Table 27: GCC Radiopharmaceutical Theranostics Market Revenue (Million) Forecast, by Application 2019 & 2032
- Table 28: South Africa Radiopharmaceutical Theranostics Market Revenue (Million) Forecast, by Application 2019 & 2032
- Table 29: Rest of Middle East and Africa Radiopharmaceutical Theranostics Market Revenue (Million) Forecast, by Application 2019 & 2032
- Table 30: Global Radiopharmaceutical Theranostics Market Revenue Million Forecast, by Country 2019 & 2032
- Table 31: Brazil Radiopharmaceutical Theranostics Market Revenue (Million) Forecast, by Application 2019 & 2032
- Table 32: Argentina Radiopharmaceutical Theranostics Market Revenue (Million) Forecast, by Application 2019 & 2032
- Table 33: Rest of South America Radiopharmaceutical Theranostics Market Revenue (Million) Forecast, by Application 2019 & 2032
- Table 34: Global Radiopharmaceutical Theranostics Market Revenue Million Forecast, by Type 2019 & 2032
- Table 35: Global Radiopharmaceutical Theranostics Market Revenue Million Forecast, by Radioisotopes 2019 & 2032
- Table 36: Global Radiopharmaceutical Theranostics Market Revenue Million Forecast, by Source 2019 & 2032
- Table 37: Global Radiopharmaceutical Theranostics Market Revenue Million Forecast, by Application 2019 & 2032
- Table 38: Global Radiopharmaceutical Theranostics Market Revenue Million Forecast, by End User 2019 & 2032
- Table 39: Global Radiopharmaceutical Theranostics Market Revenue Million Forecast, by Country 2019 & 2032
- Table 40: United States Radiopharmaceutical Theranostics Market Revenue (Million) Forecast, by Application 2019 & 2032
- Table 41: Canada Radiopharmaceutical Theranostics Market Revenue (Million) Forecast, by Application 2019 & 2032
- Table 42: Mexico Radiopharmaceutical Theranostics Market Revenue (Million) Forecast, by Application 2019 & 2032
- Table 43: Global Radiopharmaceutical Theranostics Market Revenue Million Forecast, by Type 2019 & 2032
- Table 44: Global Radiopharmaceutical Theranostics Market Revenue Million Forecast, by Radioisotopes 2019 & 2032
- Table 45: Global Radiopharmaceutical Theranostics Market Revenue Million Forecast, by Source 2019 & 2032
- Table 46: Global Radiopharmaceutical Theranostics Market Revenue Million Forecast, by Application 2019 & 2032
- Table 47: Global Radiopharmaceutical Theranostics Market Revenue Million Forecast, by End User 2019 & 2032
- Table 48: Global Radiopharmaceutical Theranostics Market Revenue Million Forecast, by Country 2019 & 2032
- Table 49: Germany Radiopharmaceutical Theranostics Market Revenue (Million) Forecast, by Application 2019 & 2032
- Table 50: United Kingdom Radiopharmaceutical Theranostics Market Revenue (Million) Forecast, by Application 2019 & 2032
- Table 51: France Radiopharmaceutical Theranostics Market Revenue (Million) Forecast, by Application 2019 & 2032
- Table 52: Italy Radiopharmaceutical Theranostics Market Revenue (Million) Forecast, by Application 2019 & 2032
- Table 53: Spain Radiopharmaceutical Theranostics Market Revenue (Million) Forecast, by Application 2019 & 2032
- Table 54: Rest of Europe Radiopharmaceutical Theranostics Market Revenue (Million) Forecast, by Application 2019 & 2032
- Table 55: Global Radiopharmaceutical Theranostics Market Revenue Million Forecast, by Type 2019 & 2032
- Table 56: Global Radiopharmaceutical Theranostics Market Revenue Million Forecast, by Radioisotopes 2019 & 2032
- Table 57: Global Radiopharmaceutical Theranostics Market Revenue Million Forecast, by Source 2019 & 2032
- Table 58: Global Radiopharmaceutical Theranostics Market Revenue Million Forecast, by Application 2019 & 2032
- Table 59: Global Radiopharmaceutical Theranostics Market Revenue Million Forecast, by End User 2019 & 2032
- Table 60: Global Radiopharmaceutical Theranostics Market Revenue Million Forecast, by Country 2019 & 2032
- Table 61: China Radiopharmaceutical Theranostics Market Revenue (Million) Forecast, by Application 2019 & 2032
- Table 62: Japan Radiopharmaceutical Theranostics Market Revenue (Million) Forecast, by Application 2019 & 2032
- Table 63: India Radiopharmaceutical Theranostics Market Revenue (Million) Forecast, by Application 2019 & 2032
- Table 64: Australia Radiopharmaceutical Theranostics Market Revenue (Million) Forecast, by Application 2019 & 2032
- Table 65: South Korea Radiopharmaceutical Theranostics Market Revenue (Million) Forecast, by Application 2019 & 2032
- Table 66: Rest of Asia Pacific Radiopharmaceutical Theranostics Market Revenue (Million) Forecast, by Application 2019 & 2032
- Table 67: Global Radiopharmaceutical Theranostics Market Revenue Million Forecast, by Type 2019 & 2032
- Table 68: Global Radiopharmaceutical Theranostics Market Revenue Million Forecast, by Radioisotopes 2019 & 2032
- Table 69: Global Radiopharmaceutical Theranostics Market Revenue Million Forecast, by Source 2019 & 2032
- Table 70: Global Radiopharmaceutical Theranostics Market Revenue Million Forecast, by Application 2019 & 2032
- Table 71: Global Radiopharmaceutical Theranostics Market Revenue Million Forecast, by End User 2019 & 2032
- Table 72: Global Radiopharmaceutical Theranostics Market Revenue Million Forecast, by Country 2019 & 2032
- Table 73: GCC Radiopharmaceutical Theranostics Market Revenue (Million) Forecast, by Application 2019 & 2032
- Table 74: South Africa Radiopharmaceutical Theranostics Market Revenue (Million) Forecast, by Application 2019 & 2032
- Table 75: Rest of Middle East and Africa Radiopharmaceutical Theranostics Market Revenue (Million) Forecast, by Application 2019 & 2032
- Table 76: Global Radiopharmaceutical Theranostics Market Revenue Million Forecast, by Type 2019 & 2032
- Table 77: Global Radiopharmaceutical Theranostics Market Revenue Million Forecast, by Radioisotopes 2019 & 2032
- Table 78: Global Radiopharmaceutical Theranostics Market Revenue Million Forecast, by Source 2019 & 2032
- Table 79: Global Radiopharmaceutical Theranostics Market Revenue Million Forecast, by Application 2019 & 2032
- Table 80: Global Radiopharmaceutical Theranostics Market Revenue Million Forecast, by End User 2019 & 2032
- Table 81: Global Radiopharmaceutical Theranostics Market Revenue Million Forecast, by Country 2019 & 2032
- Table 82: Brazil Radiopharmaceutical Theranostics Market Revenue (Million) Forecast, by Application 2019 & 2032
- Table 83: Argentina Radiopharmaceutical Theranostics Market Revenue (Million) Forecast, by Application 2019 & 2032
- Table 84: Rest of South America Radiopharmaceutical Theranostics Market Revenue (Million) Forecast, by Application 2019 & 2032
Frequently Asked Questions
1. What is the projected Compound Annual Growth Rate (CAGR) of the Radiopharmaceutical Theranostics Market?
The projected CAGR is approximately 10.79%.
2. Which companies are prominent players in the Radiopharmaceutical Theranostics Market?
Key companies in the market include Clarity Pharmaceuticals*List Not Exhaustive, Lantheus, Bayer AG, Novartis AG, NuView Life Sciences, Telix Pharmaceuticals Limited, GE HealthCare, Cardinal Health, ARICEUM THERAPEUTICS, Curium, Jubilant Radiopharma.
3. What are the main segments of the Radiopharmaceutical Theranostics Market?
The market segments include Type, Radioisotopes, Source, Application, End User.
4. Can you provide details about the market size?
The market size is estimated to be USD 2.49 Million as of 2022.
5. What are some drivers contributing to market growth?
Advancements in Targeted Cancer Therapies; Growing Emphasis on Personalized Medicine; Expanding Applications in Diagnostic Imaging.
6. What are the notable trends driving market growth?
The Companion Diagnostic Radiopharmaceuticals Segment is Expected to Dominate the Radiopharmaceutical Theranostics Market During the Forecast Period.
7. Are there any restraints impacting market growth?
Supply Chain Complexities and Limited Production Capacity; Regulatory Challenges and Approval Processes.
8. Can you provide examples of recent developments in the market?
March 2023: Australian radiopharmaceuticals manufacturer Radiopharm Theranostics, through its wholly-owned US subsidiary, planned to acquire Pharma15 Corporation, a private US-based venture developing next-generation therapeutic radiopharmaceuticals for prostate cancer.
9. What pricing options are available for accessing the report?
Pricing options include single-user, multi-user, and enterprise licenses priced at USD 4750, USD 5250, and USD 8750 respectively.
10. Is the market size provided in terms of value or volume?
The market size is provided in terms of value, measured in Million.
11. Are there any specific market keywords associated with the report?
Yes, the market keyword associated with the report is "Radiopharmaceutical Theranostics Market," which aids in identifying and referencing the specific market segment covered.
12. How do I determine which pricing option suits my needs best?
The pricing options vary based on user requirements and access needs. Individual users may opt for single-user licenses, while businesses requiring broader access may choose multi-user or enterprise licenses for cost-effective access to the report.
13. Are there any additional resources or data provided in the Radiopharmaceutical Theranostics Market report?
While the report offers comprehensive insights, it's advisable to review the specific contents or supplementary materials provided to ascertain if additional resources or data are available.
14. How can I stay updated on further developments or reports in the Radiopharmaceutical Theranostics Market?
To stay informed about further developments, trends, and reports in the Radiopharmaceutical Theranostics Market, consider subscribing to industry newsletters, following relevant companies and organizations, or regularly checking reputable industry news sources and publications.
Methodology
Step 1 - Identification of Relevant Samples Size from Population Database


Step 2 - Approaches for Defining Global Market Size (Value, Volume* & Price*)

Note*: In applicable scenarios
Step 3 - Data Sources
Primary Research
- Web Analytics
- Survey Reports
- Research Institute
- Latest Research Reports
- Opinion Leaders
Secondary Research
- Annual Reports
- White Paper
- Latest Press Release
- Industry Association
- Paid Database
- Investor Presentations

Step 4 - Data Triangulation
Involves using different sources of information in order to increase the validity of a study
These sources are likely to be stakeholders in a program - participants, other researchers, program staff, other community members, and so on.
Then we put all data in single framework & apply various statistical tools to find out the dynamic on the market.
During the analysis stage, feedback from the stakeholder groups would be compared to determine areas of agreement as well as areas of divergence
