

Key Insights
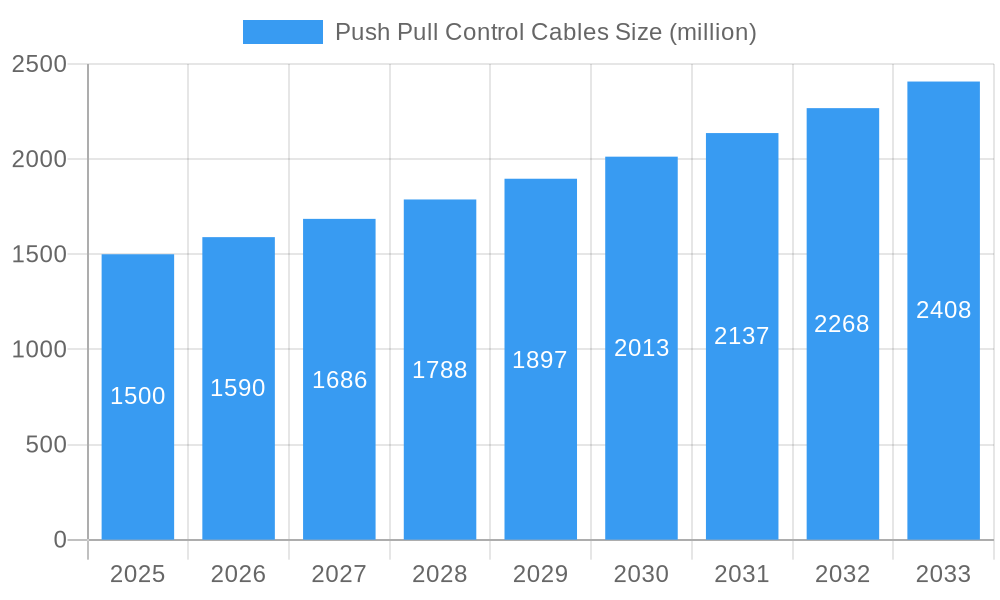
The global push-pull control cable market is experiencing robust growth, driven by increasing demand across diverse sectors. The automotive industry, a major consumer, is witnessing a surge in electric and hybrid vehicle production, leading to heightened demand for these cables due to their crucial role in transmission systems and other critical functions. Similarly, the marine industry's expansion, coupled with ongoing advancements in automation and control systems for ships and offshore platforms, is significantly contributing to market growth. The mining and oil & gas sectors also present substantial opportunities, owing to the increasing reliance on sophisticated control mechanisms for improved safety and operational efficiency in hazardous environments. Furthermore, the rising adoption of advanced technologies, such as robotics and automation, in various industrial applications is fueling market expansion. We estimate the market size in 2025 to be approximately $1.5 billion, based on industry analysis and observed growth trends in related sectors. Solid wire cables currently hold a larger market share compared to stranded wire cables, reflecting their suitability in applications requiring high tensile strength. However, stranded wire cables are gaining traction due to their superior flexibility and vibration dampening capabilities.
Push Pull Control Cables Market Size (In Billion)
Looking ahead, several trends are shaping the future of the push-pull control cable market. The increasing emphasis on lightweighting in vehicles is driving demand for cables with improved strength-to-weight ratios. Advancements in material science, leading to the development of more durable and corrosion-resistant cables, are further contributing to growth. Stringent safety regulations across various industries are pushing manufacturers to prioritize high-quality and reliable cables, stimulating innovation and increasing market value. However, challenges remain, including fluctuations in raw material prices and potential supply chain disruptions. Nevertheless, the overall market outlook remains positive, with significant opportunities for growth in emerging economies and expanding industrial sectors. Competitive dynamics are characterized by a mix of established players and specialized cable manufacturers, with ongoing innovation and strategic partnerships shaping the market landscape. We project a compound annual growth rate (CAGR) of around 6% from 2025-2033, resulting in a market exceeding $2.5 billion by 2033.
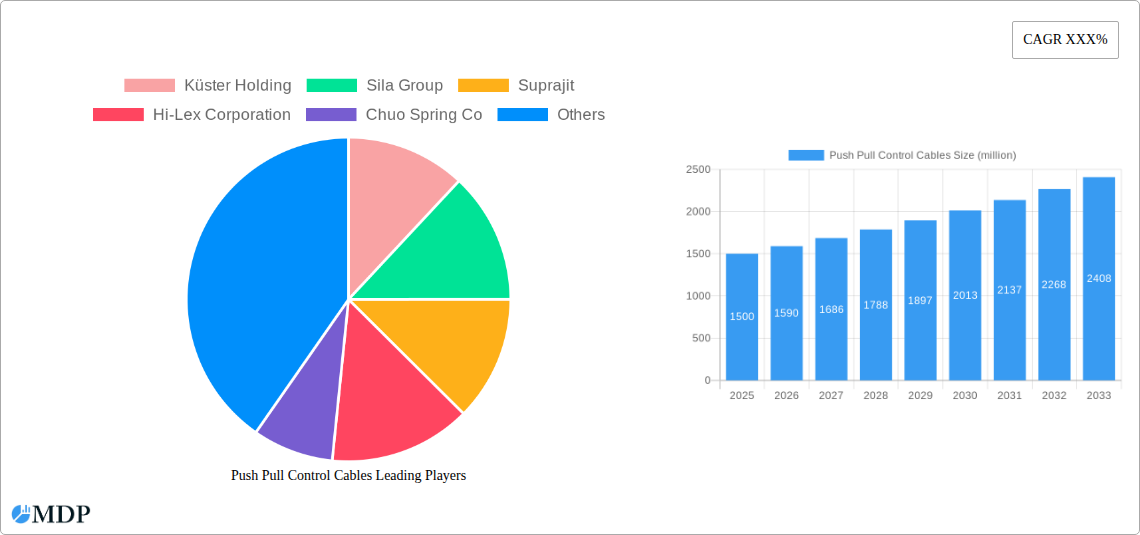
Push Pull Control Cables Company Market Share
Push Pull Control Cables Market Report: A Comprehensive Analysis (2019-2033)
This in-depth report provides a comprehensive analysis of the global Push Pull Control Cables market, projecting a market value exceeding $XX million by 2033. The study covers the historical period (2019-2024), base year (2025), and forecast period (2025-2033), offering invaluable insights for industry stakeholders, investors, and strategic decision-makers. This report is meticulously researched and requires no further modifications.
Push Pull Control Cables Market Dynamics & Concentration
The global push pull control cables market is characterized by a moderately consolidated structure, with key players like Küster Holding, Sila Group, and Suprajit holding significant market share. The market's dynamic nature is driven by several factors:
- Innovation Drivers: Continuous advancements in materials science (e.g., high-strength alloys, advanced polymers) are leading to improved cable durability, flexibility, and performance, driving market growth.
- Regulatory Frameworks: Stringent safety and performance standards in various end-use industries, particularly automotive and aerospace, influence design and manufacturing processes, impacting market dynamics.
- Product Substitutes: While push pull control cables remain dominant, competitive pressure exists from alternative technologies like electronic control systems. However, the reliability and cost-effectiveness of push pull cables maintain their widespread adoption.
- End-User Trends: The rising demand for automation across diverse sectors, including automotive, mining, and industrial machinery, fuels the growth of the push pull control cables market.
- M&A Activities: Over the past five years, approximately XX M&A deals have been recorded in the push pull control cables industry, primarily focused on consolidating market share and expanding geographic reach. Major players have acquired smaller companies to enhance their product portfolios and technological capabilities. Küster Holding, for instance, holds an estimated xx% market share, while Sila Group holds approximately xx%.
Push Pull Control Cables Industry Trends & Analysis
The global push pull control cables market is projected to experience a Compound Annual Growth Rate (CAGR) of XX% during the forecast period (2025-2033). This robust growth is fueled by several key factors:
The increasing adoption of automation across various industries is a primary growth driver. Furthermore, the ongoing development of lightweight and high-performance materials is significantly enhancing the capabilities and applications of push pull control cables. The market penetration of push pull control cables in the automotive sector is high, currently estimated at xx%, and is expected to increase further due to the growing popularity of advanced driver-assistance systems (ADAS) and electric vehicles. The competitive landscape is marked by both established players and emerging companies, resulting in innovation and competitive pricing strategies, ultimately benefiting consumers. Technological disruptions, like the increasing integration of smart sensors and data analytics, are creating new opportunities for enhanced cable designs and functionalities, improving overall system efficiency and safety.
Leading Markets & Segments in Push Pull Control Cables
The automotive segment constitutes the largest application segment for push pull control cables, accounting for approximately xx million dollars in revenue in 2025. This dominance is primarily due to the extensive use of these cables in various vehicle systems, including braking, throttle control, and shifting mechanisms.
- Key Drivers for Automotive Dominance:
- Stringent automotive safety regulations.
- Increasing demand for advanced driver-assistance systems (ADAS).
- Rising adoption of electric vehicles (EVs).
- Continued growth of global vehicle production.
The North American region is expected to be a leading market for push pull control cables, driven by robust economic growth and a strong automotive industry. Within cable types, stranded wire cables hold a larger market share due to their flexibility and superior performance in applications requiring frequent movement.
Push Pull Control Cables Product Developments
Recent product developments focus on improving durability, flexibility, and resistance to harsh environmental conditions. Innovations include incorporating advanced polymer coatings for enhanced corrosion resistance and the development of lightweight yet high-strength cables using novel materials. These advancements cater to the growing demand for reliable and efficient control systems across diverse applications, improving overall system performance and longevity.
Key Drivers of Push Pull Control Cables Growth
The market's growth is driven by several converging factors: the rising demand for automation across industries, technological advancements leading to improved cable performance and durability, and increasing investments in infrastructure projects. Government regulations promoting safety standards further fuel the demand for high-quality control cables.
Challenges in the Push Pull Control Cables Market
The market faces challenges such as fluctuations in raw material prices impacting manufacturing costs and increasing competition from substitute technologies. Supply chain disruptions due to geopolitical events can also affect production and delivery timelines. Moreover, stringent environmental regulations necessitate continuous improvements in manufacturing processes to minimize environmental impact.
Emerging Opportunities in Push Pull Control Cables
The market presents significant opportunities for growth driven by emerging applications in renewable energy infrastructure, automation in industrial settings, and expanding use in advanced robotics. Strategic partnerships between cable manufacturers and system integrators are fostering the development of innovative control systems, unlocking new market segments and application possibilities.
Leading Players in the Push Pull Control Cables Sector
- Küster Holding
- Sila Group
- Suprajit
- Hi-Lex Corporation
- Chuo Spring Co
- Kongsberg
- Cablecraft
- Grand Rapids Controls
- Wescon Controls
- Orscheln Products
- Lexco Cable
- Bergen Cable Technology
- Jersey Strand & Cable
- Aero Assemblies
- Glendinning
- Tyler Madison
- Cable-Tec Cables
- TGA Cables
- Hindle
- Saho Group
Key Milestones in Push Pull Control Cables Industry
- 2020: Introduction of a new high-temperature resistant cable by Suprajit.
- 2022: Merger between two smaller cable manufacturers, resulting in increased market consolidation.
- 2023: Launch of a lightweight, high-strength cable by Küster Holding.
- 2024: Increased investment in R&D for sustainable materials in the industry.
Strategic Outlook for Push Pull Control Cables Market
The future of the push pull control cables market is bright, driven by continuous technological advancements and the expanding scope of automation across various sectors. Strategic partnerships and focused R&D efforts will play a crucial role in driving innovation, shaping future market trends, and unlocking new growth opportunities, promising substantial market expansion in the coming years.
Push Pull Control Cables Segmentation
-
1. Application
- 1.1. Automotive
- 1.2. Marine
- 1.3. Mining
- 1.4. Oil & Gas
- 1.5. Others
-
2. Type
- 2.1. Solid Wire Cables
- 2.2. Stranded Wire Cables
Push Pull Control Cables Segmentation By Geography
-
1. North America
- 1.1. United States
- 1.2. Canada
- 1.3. Mexico
-
2. South America
- 2.1. Brazil
- 2.2. Argentina
- 2.3. Rest of South America
-
3. Europe
- 3.1. United Kingdom
- 3.2. Germany
- 3.3. France
- 3.4. Italy
- 3.5. Spain
- 3.6. Russia
- 3.7. Benelux
- 3.8. Nordics
- 3.9. Rest of Europe
-
4. Middle East & Africa
- 4.1. Turkey
- 4.2. Israel
- 4.3. GCC
- 4.4. North Africa
- 4.5. South Africa
- 4.6. Rest of Middle East & Africa
-
5. Asia Pacific
- 5.1. China
- 5.2. India
- 5.3. Japan
- 5.4. South Korea
- 5.5. ASEAN
- 5.6. Oceania
- 5.7. Rest of Asia Pacific
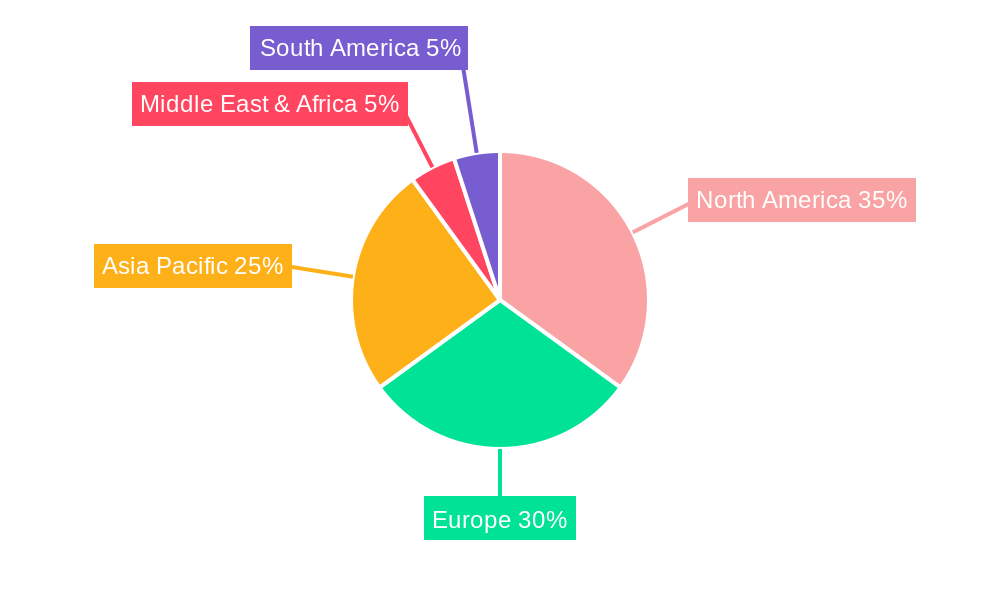
Push Pull Control Cables Regional Market Share
Geographic Coverage of Push Pull Control Cables
Push Pull Control Cables REPORT HIGHLIGHTS
| Aspects | Details |
|---|---|
| Study Period | 2020-2034 |
| Base Year | 2025 |
| Estimated Year | 2026 |
| Forecast Period | 2026-2034 |
| Historical Period | 2020-2025 |
| Growth Rate | CAGR of XXX% from 2020-2034 |
| Segmentation |
|
Table of Contents
- 1. Introduction
- 1.1. Research Scope
- 1.2. Market Segmentation
- 1.3. Research Methodology
- 1.4. Definitions and Assumptions
- 2. Executive Summary
- 2.1. Introduction
- 3. Market Dynamics
- 3.1. Introduction
- 3.2. Market Drivers
- 3.3. Market Restrains
- 3.4. Market Trends
- 4. Market Factor Analysis
- 4.1. Porters Five Forces
- 4.2. Supply/Value Chain
- 4.3. PESTEL analysis
- 4.4. Market Entropy
- 4.5. Patent/Trademark Analysis
- 5. Global Push Pull Control Cables Analysis, Insights and Forecast, 2020-2032
- 5.1. Market Analysis, Insights and Forecast - by Application
- 5.1.1. Automotive
- 5.1.2. Marine
- 5.1.3. Mining
- 5.1.4. Oil & Gas
- 5.1.5. Others
- 5.2. Market Analysis, Insights and Forecast - by Type
- 5.2.1. Solid Wire Cables
- 5.2.2. Stranded Wire Cables
- 5.3. Market Analysis, Insights and Forecast - by Region
- 5.3.1. North America
- 5.3.2. South America
- 5.3.3. Europe
- 5.3.4. Middle East & Africa
- 5.3.5. Asia Pacific
- 5.1. Market Analysis, Insights and Forecast - by Application
- 6. North America Push Pull Control Cables Analysis, Insights and Forecast, 2020-2032
- 6.1. Market Analysis, Insights and Forecast - by Application
- 6.1.1. Automotive
- 6.1.2. Marine
- 6.1.3. Mining
- 6.1.4. Oil & Gas
- 6.1.5. Others
- 6.2. Market Analysis, Insights and Forecast - by Type
- 6.2.1. Solid Wire Cables
- 6.2.2. Stranded Wire Cables
- 6.1. Market Analysis, Insights and Forecast - by Application
- 7. South America Push Pull Control Cables Analysis, Insights and Forecast, 2020-2032
- 7.1. Market Analysis, Insights and Forecast - by Application
- 7.1.1. Automotive
- 7.1.2. Marine
- 7.1.3. Mining
- 7.1.4. Oil & Gas
- 7.1.5. Others
- 7.2. Market Analysis, Insights and Forecast - by Type
- 7.2.1. Solid Wire Cables
- 7.2.2. Stranded Wire Cables
- 7.1. Market Analysis, Insights and Forecast - by Application
- 8. Europe Push Pull Control Cables Analysis, Insights and Forecast, 2020-2032
- 8.1. Market Analysis, Insights and Forecast - by Application
- 8.1.1. Automotive
- 8.1.2. Marine
- 8.1.3. Mining
- 8.1.4. Oil & Gas
- 8.1.5. Others
- 8.2. Market Analysis, Insights and Forecast - by Type
- 8.2.1. Solid Wire Cables
- 8.2.2. Stranded Wire Cables
- 8.1. Market Analysis, Insights and Forecast - by Application
- 9. Middle East & Africa Push Pull Control Cables Analysis, Insights and Forecast, 2020-2032
- 9.1. Market Analysis, Insights and Forecast - by Application
- 9.1.1. Automotive
- 9.1.2. Marine
- 9.1.3. Mining
- 9.1.4. Oil & Gas
- 9.1.5. Others
- 9.2. Market Analysis, Insights and Forecast - by Type
- 9.2.1. Solid Wire Cables
- 9.2.2. Stranded Wire Cables
- 9.1. Market Analysis, Insights and Forecast - by Application
- 10. Asia Pacific Push Pull Control Cables Analysis, Insights and Forecast, 2020-2032
- 10.1. Market Analysis, Insights and Forecast - by Application
- 10.1.1. Automotive
- 10.1.2. Marine
- 10.1.3. Mining
- 10.1.4. Oil & Gas
- 10.1.5. Others
- 10.2. Market Analysis, Insights and Forecast - by Type
- 10.2.1. Solid Wire Cables
- 10.2.2. Stranded Wire Cables
- 10.1. Market Analysis, Insights and Forecast - by Application
- 11. Competitive Analysis
- 11.1. Global Market Share Analysis 2025
- 11.2. Company Profiles
- 11.2.1 Küster Holding
- 11.2.1.1. Overview
- 11.2.1.2. Products
- 11.2.1.3. SWOT Analysis
- 11.2.1.4. Recent Developments
- 11.2.1.5. Financials (Based on Availability)
- 11.2.2 Sila Group
- 11.2.2.1. Overview
- 11.2.2.2. Products
- 11.2.2.3. SWOT Analysis
- 11.2.2.4. Recent Developments
- 11.2.2.5. Financials (Based on Availability)
- 11.2.3 Suprajit
- 11.2.3.1. Overview
- 11.2.3.2. Products
- 11.2.3.3. SWOT Analysis
- 11.2.3.4. Recent Developments
- 11.2.3.5. Financials (Based on Availability)
- 11.2.4 Hi-Lex Corporation
- 11.2.4.1. Overview
- 11.2.4.2. Products
- 11.2.4.3. SWOT Analysis
- 11.2.4.4. Recent Developments
- 11.2.4.5. Financials (Based on Availability)
- 11.2.5 Chuo Spring Co
- 11.2.5.1. Overview
- 11.2.5.2. Products
- 11.2.5.3. SWOT Analysis
- 11.2.5.4. Recent Developments
- 11.2.5.5. Financials (Based on Availability)
- 11.2.6 Kongsberg
- 11.2.6.1. Overview
- 11.2.6.2. Products
- 11.2.6.3. SWOT Analysis
- 11.2.6.4. Recent Developments
- 11.2.6.5. Financials (Based on Availability)
- 11.2.7 Cablecraft
- 11.2.7.1. Overview
- 11.2.7.2. Products
- 11.2.7.3. SWOT Analysis
- 11.2.7.4. Recent Developments
- 11.2.7.5. Financials (Based on Availability)
- 11.2.8 Grand Rapids Controls
- 11.2.8.1. Overview
- 11.2.8.2. Products
- 11.2.8.3. SWOT Analysis
- 11.2.8.4. Recent Developments
- 11.2.8.5. Financials (Based on Availability)
- 11.2.9 Wescon Controls
- 11.2.9.1. Overview
- 11.2.9.2. Products
- 11.2.9.3. SWOT Analysis
- 11.2.9.4. Recent Developments
- 11.2.9.5. Financials (Based on Availability)
- 11.2.10 Orscheln Products
- 11.2.10.1. Overview
- 11.2.10.2. Products
- 11.2.10.3. SWOT Analysis
- 11.2.10.4. Recent Developments
- 11.2.10.5. Financials (Based on Availability)
- 11.2.11 Lexco Cable
- 11.2.11.1. Overview
- 11.2.11.2. Products
- 11.2.11.3. SWOT Analysis
- 11.2.11.4. Recent Developments
- 11.2.11.5. Financials (Based on Availability)
- 11.2.12 Bergen Cable Technology
- 11.2.12.1. Overview
- 11.2.12.2. Products
- 11.2.12.3. SWOT Analysis
- 11.2.12.4. Recent Developments
- 11.2.12.5. Financials (Based on Availability)
- 11.2.13 Jersey Strand & Cable
- 11.2.13.1. Overview
- 11.2.13.2. Products
- 11.2.13.3. SWOT Analysis
- 11.2.13.4. Recent Developments
- 11.2.13.5. Financials (Based on Availability)
- 11.2.14 Aero Assemblies
- 11.2.14.1. Overview
- 11.2.14.2. Products
- 11.2.14.3. SWOT Analysis
- 11.2.14.4. Recent Developments
- 11.2.14.5. Financials (Based on Availability)
- 11.2.15 Glendinning
- 11.2.15.1. Overview
- 11.2.15.2. Products
- 11.2.15.3. SWOT Analysis
- 11.2.15.4. Recent Developments
- 11.2.15.5. Financials (Based on Availability)
- 11.2.16 Tyler Madison
- 11.2.16.1. Overview
- 11.2.16.2. Products
- 11.2.16.3. SWOT Analysis
- 11.2.16.4. Recent Developments
- 11.2.16.5. Financials (Based on Availability)
- 11.2.17 Cable-Tec Cables
- 11.2.17.1. Overview
- 11.2.17.2. Products
- 11.2.17.3. SWOT Analysis
- 11.2.17.4. Recent Developments
- 11.2.17.5. Financials (Based on Availability)
- 11.2.18 TGA Cables
- 11.2.18.1. Overview
- 11.2.18.2. Products
- 11.2.18.3. SWOT Analysis
- 11.2.18.4. Recent Developments
- 11.2.18.5. Financials (Based on Availability)
- 11.2.19 Hindle
- 11.2.19.1. Overview
- 11.2.19.2. Products
- 11.2.19.3. SWOT Analysis
- 11.2.19.4. Recent Developments
- 11.2.19.5. Financials (Based on Availability)
- 11.2.20 Saho Group
- 11.2.20.1. Overview
- 11.2.20.2. Products
- 11.2.20.3. SWOT Analysis
- 11.2.20.4. Recent Developments
- 11.2.20.5. Financials (Based on Availability)
- 11.2.1 Küster Holding
List of Figures
- Figure 1: Global Push Pull Control Cables Revenue Breakdown (million, %) by Region 2025 & 2033
- Figure 2: North America Push Pull Control Cables Revenue (million), by Application 2025 & 2033
- Figure 3: North America Push Pull Control Cables Revenue Share (%), by Application 2025 & 2033
- Figure 4: North America Push Pull Control Cables Revenue (million), by Type 2025 & 2033
- Figure 5: North America Push Pull Control Cables Revenue Share (%), by Type 2025 & 2033
- Figure 6: North America Push Pull Control Cables Revenue (million), by Country 2025 & 2033
- Figure 7: North America Push Pull Control Cables Revenue Share (%), by Country 2025 & 2033
- Figure 8: South America Push Pull Control Cables Revenue (million), by Application 2025 & 2033
- Figure 9: South America Push Pull Control Cables Revenue Share (%), by Application 2025 & 2033
- Figure 10: South America Push Pull Control Cables Revenue (million), by Type 2025 & 2033
- Figure 11: South America Push Pull Control Cables Revenue Share (%), by Type 2025 & 2033
- Figure 12: South America Push Pull Control Cables Revenue (million), by Country 2025 & 2033
- Figure 13: South America Push Pull Control Cables Revenue Share (%), by Country 2025 & 2033
- Figure 14: Europe Push Pull Control Cables Revenue (million), by Application 2025 & 2033
- Figure 15: Europe Push Pull Control Cables Revenue Share (%), by Application 2025 & 2033
- Figure 16: Europe Push Pull Control Cables Revenue (million), by Type 2025 & 2033
- Figure 17: Europe Push Pull Control Cables Revenue Share (%), by Type 2025 & 2033
- Figure 18: Europe Push Pull Control Cables Revenue (million), by Country 2025 & 2033
- Figure 19: Europe Push Pull Control Cables Revenue Share (%), by Country 2025 & 2033
- Figure 20: Middle East & Africa Push Pull Control Cables Revenue (million), by Application 2025 & 2033
- Figure 21: Middle East & Africa Push Pull Control Cables Revenue Share (%), by Application 2025 & 2033
- Figure 22: Middle East & Africa Push Pull Control Cables Revenue (million), by Type 2025 & 2033
- Figure 23: Middle East & Africa Push Pull Control Cables Revenue Share (%), by Type 2025 & 2033
- Figure 24: Middle East & Africa Push Pull Control Cables Revenue (million), by Country 2025 & 2033
- Figure 25: Middle East & Africa Push Pull Control Cables Revenue Share (%), by Country 2025 & 2033
- Figure 26: Asia Pacific Push Pull Control Cables Revenue (million), by Application 2025 & 2033
- Figure 27: Asia Pacific Push Pull Control Cables Revenue Share (%), by Application 2025 & 2033
- Figure 28: Asia Pacific Push Pull Control Cables Revenue (million), by Type 2025 & 2033
- Figure 29: Asia Pacific Push Pull Control Cables Revenue Share (%), by Type 2025 & 2033
- Figure 30: Asia Pacific Push Pull Control Cables Revenue (million), by Country 2025 & 2033
- Figure 31: Asia Pacific Push Pull Control Cables Revenue Share (%), by Country 2025 & 2033
List of Tables
- Table 1: Global Push Pull Control Cables Revenue million Forecast, by Application 2020 & 2033
- Table 2: Global Push Pull Control Cables Revenue million Forecast, by Type 2020 & 2033
- Table 3: Global Push Pull Control Cables Revenue million Forecast, by Region 2020 & 2033
- Table 4: Global Push Pull Control Cables Revenue million Forecast, by Application 2020 & 2033
- Table 5: Global Push Pull Control Cables Revenue million Forecast, by Type 2020 & 2033
- Table 6: Global Push Pull Control Cables Revenue million Forecast, by Country 2020 & 2033
- Table 7: United States Push Pull Control Cables Revenue (million) Forecast, by Application 2020 & 2033
- Table 8: Canada Push Pull Control Cables Revenue (million) Forecast, by Application 2020 & 2033
- Table 9: Mexico Push Pull Control Cables Revenue (million) Forecast, by Application 2020 & 2033
- Table 10: Global Push Pull Control Cables Revenue million Forecast, by Application 2020 & 2033
- Table 11: Global Push Pull Control Cables Revenue million Forecast, by Type 2020 & 2033
- Table 12: Global Push Pull Control Cables Revenue million Forecast, by Country 2020 & 2033
- Table 13: Brazil Push Pull Control Cables Revenue (million) Forecast, by Application 2020 & 2033
- Table 14: Argentina Push Pull Control Cables Revenue (million) Forecast, by Application 2020 & 2033
- Table 15: Rest of South America Push Pull Control Cables Revenue (million) Forecast, by Application 2020 & 2033
- Table 16: Global Push Pull Control Cables Revenue million Forecast, by Application 2020 & 2033
- Table 17: Global Push Pull Control Cables Revenue million Forecast, by Type 2020 & 2033
- Table 18: Global Push Pull Control Cables Revenue million Forecast, by Country 2020 & 2033
- Table 19: United Kingdom Push Pull Control Cables Revenue (million) Forecast, by Application 2020 & 2033
- Table 20: Germany Push Pull Control Cables Revenue (million) Forecast, by Application 2020 & 2033
- Table 21: France Push Pull Control Cables Revenue (million) Forecast, by Application 2020 & 2033
- Table 22: Italy Push Pull Control Cables Revenue (million) Forecast, by Application 2020 & 2033
- Table 23: Spain Push Pull Control Cables Revenue (million) Forecast, by Application 2020 & 2033
- Table 24: Russia Push Pull Control Cables Revenue (million) Forecast, by Application 2020 & 2033
- Table 25: Benelux Push Pull Control Cables Revenue (million) Forecast, by Application 2020 & 2033
- Table 26: Nordics Push Pull Control Cables Revenue (million) Forecast, by Application 2020 & 2033
- Table 27: Rest of Europe Push Pull Control Cables Revenue (million) Forecast, by Application 2020 & 2033
- Table 28: Global Push Pull Control Cables Revenue million Forecast, by Application 2020 & 2033
- Table 29: Global Push Pull Control Cables Revenue million Forecast, by Type 2020 & 2033
- Table 30: Global Push Pull Control Cables Revenue million Forecast, by Country 2020 & 2033
- Table 31: Turkey Push Pull Control Cables Revenue (million) Forecast, by Application 2020 & 2033
- Table 32: Israel Push Pull Control Cables Revenue (million) Forecast, by Application 2020 & 2033
- Table 33: GCC Push Pull Control Cables Revenue (million) Forecast, by Application 2020 & 2033
- Table 34: North Africa Push Pull Control Cables Revenue (million) Forecast, by Application 2020 & 2033
- Table 35: South Africa Push Pull Control Cables Revenue (million) Forecast, by Application 2020 & 2033
- Table 36: Rest of Middle East & Africa Push Pull Control Cables Revenue (million) Forecast, by Application 2020 & 2033
- Table 37: Global Push Pull Control Cables Revenue million Forecast, by Application 2020 & 2033
- Table 38: Global Push Pull Control Cables Revenue million Forecast, by Type 2020 & 2033
- Table 39: Global Push Pull Control Cables Revenue million Forecast, by Country 2020 & 2033
- Table 40: China Push Pull Control Cables Revenue (million) Forecast, by Application 2020 & 2033
- Table 41: India Push Pull Control Cables Revenue (million) Forecast, by Application 2020 & 2033
- Table 42: Japan Push Pull Control Cables Revenue (million) Forecast, by Application 2020 & 2033
- Table 43: South Korea Push Pull Control Cables Revenue (million) Forecast, by Application 2020 & 2033
- Table 44: ASEAN Push Pull Control Cables Revenue (million) Forecast, by Application 2020 & 2033
- Table 45: Oceania Push Pull Control Cables Revenue (million) Forecast, by Application 2020 & 2033
- Table 46: Rest of Asia Pacific Push Pull Control Cables Revenue (million) Forecast, by Application 2020 & 2033
Frequently Asked Questions
1. What is the projected Compound Annual Growth Rate (CAGR) of the Push Pull Control Cables?
The projected CAGR is approximately XXX%.
2. Which companies are prominent players in the Push Pull Control Cables?
Key companies in the market include Küster Holding, Sila Group, Suprajit, Hi-Lex Corporation, Chuo Spring Co, Kongsberg, Cablecraft, Grand Rapids Controls, Wescon Controls, Orscheln Products, Lexco Cable, Bergen Cable Technology, Jersey Strand & Cable, Aero Assemblies, Glendinning, Tyler Madison, Cable-Tec Cables, TGA Cables, Hindle, Saho Group.
3. What are the main segments of the Push Pull Control Cables?
The market segments include Application, Type.
4. Can you provide details about the market size?
The market size is estimated to be USD XXX million as of 2022.
5. What are some drivers contributing to market growth?
N/A
6. What are the notable trends driving market growth?
N/A
7. Are there any restraints impacting market growth?
N/A
8. Can you provide examples of recent developments in the market?
N/A
9. What pricing options are available for accessing the report?
Pricing options include single-user, multi-user, and enterprise licenses priced at USD 2900.00, USD 4350.00, and USD 5800.00 respectively.
10. Is the market size provided in terms of value or volume?
The market size is provided in terms of value, measured in million.
11. Are there any specific market keywords associated with the report?
Yes, the market keyword associated with the report is "Push Pull Control Cables," which aids in identifying and referencing the specific market segment covered.
12. How do I determine which pricing option suits my needs best?
The pricing options vary based on user requirements and access needs. Individual users may opt for single-user licenses, while businesses requiring broader access may choose multi-user or enterprise licenses for cost-effective access to the report.
13. Are there any additional resources or data provided in the Push Pull Control Cables report?
While the report offers comprehensive insights, it's advisable to review the specific contents or supplementary materials provided to ascertain if additional resources or data are available.
14. How can I stay updated on further developments or reports in the Push Pull Control Cables?
To stay informed about further developments, trends, and reports in the Push Pull Control Cables, consider subscribing to industry newsletters, following relevant companies and organizations, or regularly checking reputable industry news sources and publications.
Methodology
Step 1 - Identification of Relevant Samples Size from Population Database


Step 2 - Approaches for Defining Global Market Size (Value, Volume* & Price*)

Note*: In applicable scenarios
Step 3 - Data Sources
Primary Research
- Web Analytics
- Survey Reports
- Research Institute
- Latest Research Reports
- Opinion Leaders
Secondary Research
- Annual Reports
- White Paper
- Latest Press Release
- Industry Association
- Paid Database
- Investor Presentations

Step 4 - Data Triangulation
Involves using different sources of information in order to increase the validity of a study
These sources are likely to be stakeholders in a program - participants, other researchers, program staff, other community members, and so on.
Then we put all data in single framework & apply various statistical tools to find out the dynamic on the market.
During the analysis stage, feedback from the stakeholder groups would be compared to determine areas of agreement as well as areas of divergence