

Key Insights
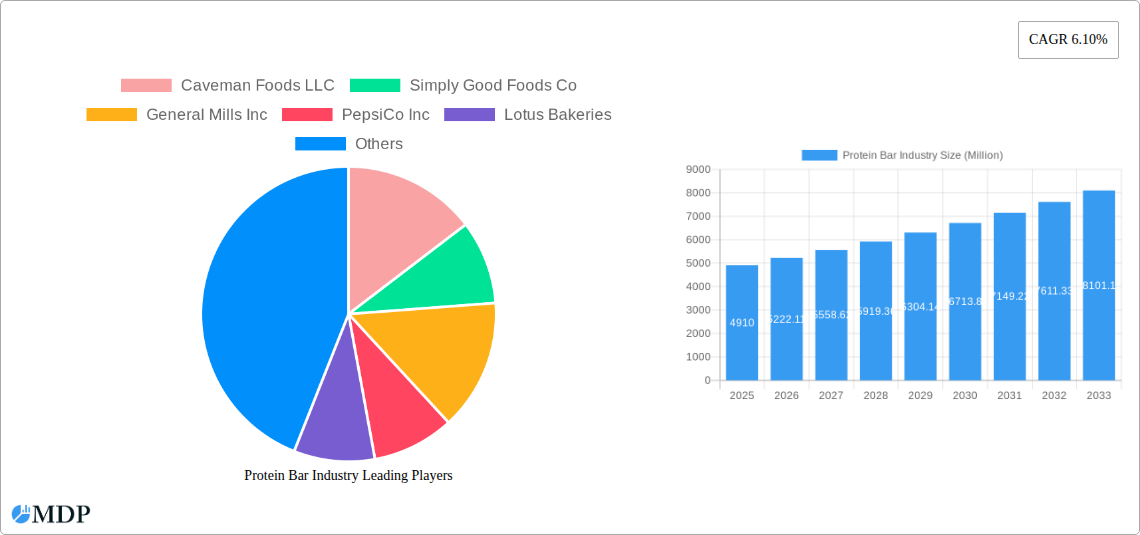
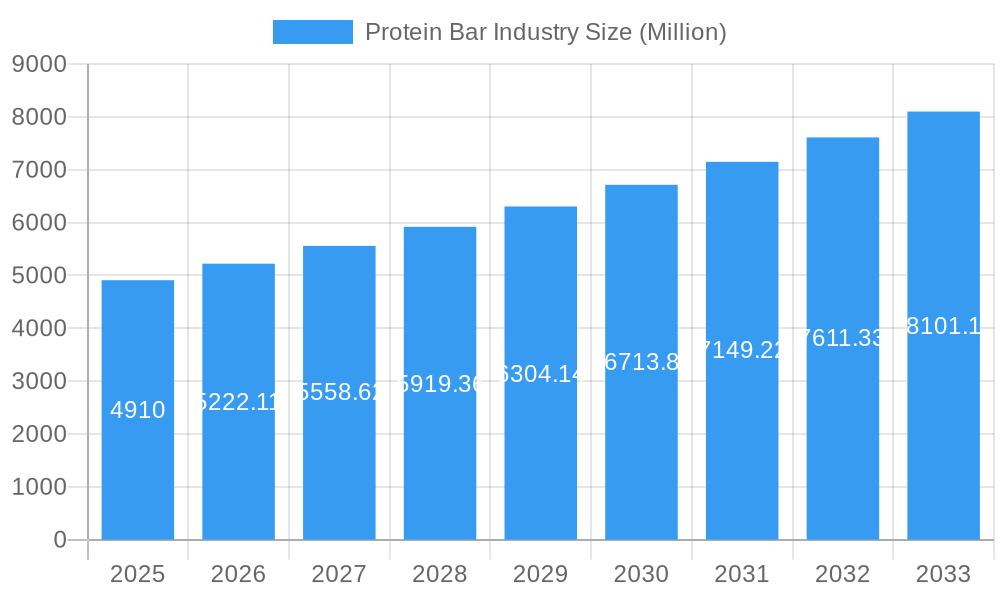
The global protein bar market, valued at $4.91 billion in 2025, is projected to experience robust growth, exhibiting a Compound Annual Growth Rate (CAGR) of 6.10% from 2025 to 2033. This expansion is fueled by several key drivers. The rising prevalence of health-conscious consumers seeking convenient, high-protein snacks is a major catalyst. Increased participation in fitness activities and a growing awareness of the importance of protein for muscle building and overall well-being further bolster market demand. The market is witnessing a notable shift towards healthier ingredients, with a growing preference for organic, gluten-free, and low-sugar options. This trend is prompting manufacturers to innovate and diversify their product offerings to cater to evolving consumer preferences. Furthermore, strategic partnerships and collaborations between protein bar manufacturers and fitness influencers or gym chains are enhancing brand visibility and driving sales. The expansion of e-commerce channels also significantly contributes to market accessibility and growth. However, the market faces some challenges, including concerns about high sugar content in certain products and potential fluctuations in raw material prices, which can affect profitability.
Protein Bar Industry Market Size (In Billion)
Despite these challenges, the market segmentation reveals significant opportunities. The online retail channel is experiencing rapid growth, reflecting the ease and convenience it offers consumers. Supermarkets and hypermarkets remain dominant distribution channels, benefitting from their wide reach and established customer base. Competition within the market is intense, with established players like General Mills, PepsiCo, and Hershey’s competing with smaller, specialized brands focusing on niche markets (e.g., organic, vegan). Geographical analysis suggests that North America and Europe currently hold significant market shares, but the Asia-Pacific region is poised for substantial growth, driven by rising disposable incomes and changing lifestyle patterns. This dynamic landscape presents exciting opportunities for both established players and new entrants seeking to capture a share of this expanding market.
Protein Bar Industry Company Market Share
Protein Bar Industry Market Report: 2019-2033
This comprehensive report provides a detailed analysis of the global protein bar industry, offering invaluable insights for stakeholders, investors, and industry professionals. The study period covers 2019-2033, with a base year of 2025 and a forecast period spanning 2025-2033. The report meticulously examines market dynamics, trends, leading players, and future growth opportunities, with a focus on key segments and geographic markets. The market size is projected to reach xx Million by 2033.
Protein Bar Industry Market Dynamics & Concentration
The global protein bar market is characterized by a moderately consolidated structure, with several key players holding significant market share. Market concentration is expected to remain relatively stable during the forecast period, although M&A activity and the emergence of new entrants could lead to some shifts. Innovation is a crucial driver, with companies continuously developing new flavors, formulations, and functionalities to cater to evolving consumer preferences. Regulatory frameworks concerning labeling, ingredient standards, and health claims significantly impact the market, leading to variations in product offerings across different regions. The market also faces competition from substitute products, including other protein-rich snacks and functional beverages.
End-user trends indicate a growing preference for healthier, more convenient, and functional food options. This drives the demand for protein bars with added ingredients such as vitamins, minerals, and superfoods. M&A activities in the protein bar industry have been moderate over the past five years, with approximately xx deals recorded, primarily focused on expanding product portfolios and market reach. Key players like General Mills and Hershey have demonstrated strong M&A activity, increasing their dominance. The average market share of the top 5 players was estimated at xx% in 2024.
Protein Bar Industry Industry Trends & Analysis
The protein bar market exhibits a strong growth trajectory, driven by several factors. The increasing health consciousness among consumers, coupled with rising disposable incomes in emerging economies, fuels the demand for convenient and nutritious protein sources. Technological advancements in food processing and packaging enhance product shelf life and nutritional value. Consumer preferences are shifting toward natural and organic ingredients, clean labels, and reduced sugar content, prompting manufacturers to innovate and adapt their formulations. The market also witnesses a high degree of competitive intensity, with players vying for market share through product differentiation, branding, and distribution strategies. The Compound Annual Growth Rate (CAGR) during the historical period (2019-2024) is estimated at xx%, and is projected to be xx% during the forecast period (2025-2033). Market penetration has significantly increased in developed countries, while emerging markets present substantial growth opportunities.
Leading Markets & Segments in Protein Bar Industry
The North American region currently dominates the global protein bar market, driven by high consumer awareness of health and fitness, coupled with strong distribution networks. Within this region, the United States holds a leading position. In terms of segments, the supermarket/hypermarket channel commands the largest market share, due to widespread availability and established distribution partnerships.
- Supermarket/Hypermarket: Strong existing infrastructure, wide consumer reach.
- Convenience Stores: Increasing demand for quick and convenient options, but smaller shelf space limits product variety.
- Online Retail Stores: Growing rapidly, driven by e-commerce penetration and convenience, but faces challenges in logistical efficiency.
- Others: Includes specialty stores, gyms, and direct-to-consumer sales channels, with fragmented market share.
Economic policies promoting healthy eating habits, advanced retail infrastructure, and the prevalence of fitness culture all contribute to the dominance of these regions and channels. However, other regions like Asia-Pacific are showing rapid growth, fuelled by rising disposable incomes and increasing health awareness.
Protein Bar Industry Product Developments
Recent product innovations focus on enhancing taste, texture, and nutritional profiles. Manufacturers are increasingly incorporating natural ingredients, functional components (such as probiotics and collagen), and innovative flavors to attract health-conscious consumers. Technological advancements like advanced extrusion techniques and improved coating processes enhance product quality and shelf life. These innovations provide competitive advantages by addressing unmet consumer needs and offering unique value propositions.
Key Drivers of Protein Bar Industry Growth
Several factors contribute to the industry's growth:
- Rising Health Consciousness: Increased awareness of the importance of protein intake for health and fitness.
- Convenience: Protein bars offer a quick and convenient meal or snack replacement.
- Technological Advancements: Innovations in processing and packaging improve product quality and shelf life.
- Favorable Regulatory Environment: Regulations promoting healthier food options drive product innovation.
Challenges in the Protein Bar Industry Market
The industry faces challenges such as:
- Intense Competition: A large number of players vying for market share.
- Fluctuating Raw Material Prices: Impacting production costs and profitability.
- Stringent Regulatory Requirements: Compliance costs and complexities across regions.
- Maintaining Product Quality and Consistency: Meeting consumer expectations for taste and nutritional value.
These factors can affect overall market growth and profitability.
Emerging Opportunities in Protein Bar Industry
Emerging opportunities include:
- Expansion into New Markets: Untapped potential in developing countries.
- Strategic Partnerships: Collaborations to expand product lines and distribution channels.
- Product Diversification: Introduction of novel flavors, formulations, and functionalities.
- Sustainability Initiatives: Meeting the increasing demand for eco-friendly packaging and sourcing.
Leading Players in the Protein Bar Industry Sector
- Caveman Foods LLC
- Simply Good Foods Co
- General Mills Inc
- PepsiCo Inc
- Lotus Bakeries
- GNC Holdings LLC
- Naturell India Pvt Ltd
- Mars Incorporated
- Fitshit Health Solutions Pvt Ltd
- The Hershey Company
- Associated British Foods PLC
- Stayfit Enterprize Private Limited
- Glanbia Plc
- Kellogg Company
Key Milestones in Protein Bar Industry Industry
- January 2023: The Hershey Company launched caffeinated protein bars in vanilla latte and caramel macchiato flavors.
- April 2023: The Hershey Company launched ONE Brands Peanut Butter & Jelly Flavored Protein Bar (20g protein, 1g sugar).
- May 2023: General Mills Inc. announced the expansion of its Nature Valley brand with savory nut crunch bars.
These launches indicate a trend toward innovative flavors and functional ingredients.
Strategic Outlook for Protein Bar Industry Market
The protein bar market presents significant growth potential, driven by evolving consumer preferences and technological advancements. Strategic partnerships, product diversification, and expansion into new markets will be crucial for success. Focusing on sustainable practices and meeting the rising demand for healthier, more convenient options will shape the future of the industry. The market is poised for continued expansion, with opportunities for both established players and new entrants to capitalize on the growing demand for protein-rich snacks.
Protein Bar Industry Segmentation
-
1. Distribution Channel
- 1.1. Convenience Store
- 1.2. Online Retail Store
- 1.3. Supermarket/Hypermarket
- 1.4. Others
Protein Bar Industry Segmentation By Geography
-
1. North America
- 1.1. United States
- 1.2. Canada
- 1.3. Mexico
-
2. South America
- 2.1. Brazil
- 2.2. Argentina
- 2.3. Rest of South America
-
3. Europe
- 3.1. United Kingdom
- 3.2. Germany
- 3.3. France
- 3.4. Italy
- 3.5. Spain
- 3.6. Russia
- 3.7. Benelux
- 3.8. Nordics
- 3.9. Rest of Europe
-
4. Middle East & Africa
- 4.1. Turkey
- 4.2. Israel
- 4.3. GCC
- 4.4. North Africa
- 4.5. South Africa
- 4.6. Rest of Middle East & Africa
-
5. Asia Pacific
- 5.1. China
- 5.2. India
- 5.3. Japan
- 5.4. South Korea
- 5.5. ASEAN
- 5.6. Oceania
- 5.7. Rest of Asia Pacific
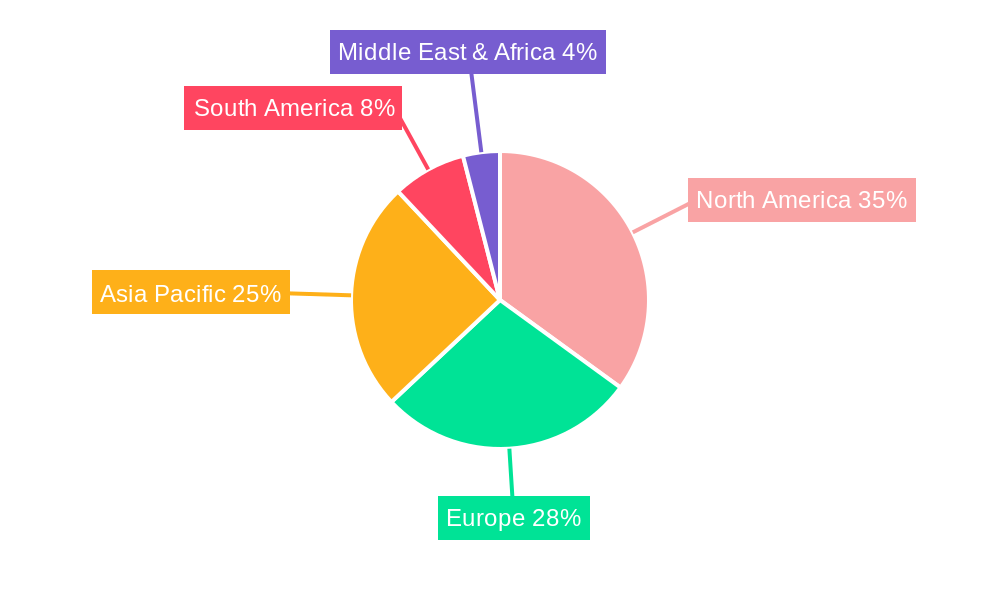
Protein Bar Industry Regional Market Share
Geographic Coverage of Protein Bar Industry
Protein Bar Industry REPORT HIGHLIGHTS
| Aspects | Details |
|---|---|
| Study Period | 2020-2034 |
| Base Year | 2025 |
| Estimated Year | 2026 |
| Forecast Period | 2026-2034 |
| Historical Period | 2020-2025 |
| Growth Rate | CAGR of 6.10% from 2020-2034 |
| Segmentation |
|
Table of Contents
- 1. Introduction
- 1.1. Research Scope
- 1.2. Market Segmentation
- 1.3. Research Methodology
- 1.4. Definitions and Assumptions
- 2. Executive Summary
- 2.1. Introduction
- 3. Market Dynamics
- 3.1. Introduction
- 3.2. Market Drivers
- 3.2.1. Increasing Demand for Low-Fat and Fat-Free Food Products; Expanding Cosmetic and Personal Care Industries Utilize Gelatin for Various Purposes
- 3.3. Market Restrains
- 3.3.1. Fluctuations in Raw Material Proces Affecting Production Costs
- 3.4. Market Trends
- 3.4.1. OTHER KEY INDUSTRY TRENDS COVERED IN THE REPORT
- 4. Market Factor Analysis
- 4.1. Porters Five Forces
- 4.2. Supply/Value Chain
- 4.3. PESTEL analysis
- 4.4. Market Entropy
- 4.5. Patent/Trademark Analysis
- 5. Global Protein Bar Industry Analysis, Insights and Forecast, 2020-2032
- 5.1. Market Analysis, Insights and Forecast - by Distribution Channel
- 5.1.1. Convenience Store
- 5.1.2. Online Retail Store
- 5.1.3. Supermarket/Hypermarket
- 5.1.4. Others
- 5.2. Market Analysis, Insights and Forecast - by Region
- 5.2.1. North America
- 5.2.2. South America
- 5.2.3. Europe
- 5.2.4. Middle East & Africa
- 5.2.5. Asia Pacific
- 5.1. Market Analysis, Insights and Forecast - by Distribution Channel
- 6. North America Protein Bar Industry Analysis, Insights and Forecast, 2020-2032
- 6.1. Market Analysis, Insights and Forecast - by Distribution Channel
- 6.1.1. Convenience Store
- 6.1.2. Online Retail Store
- 6.1.3. Supermarket/Hypermarket
- 6.1.4. Others
- 6.1. Market Analysis, Insights and Forecast - by Distribution Channel
- 7. South America Protein Bar Industry Analysis, Insights and Forecast, 2020-2032
- 7.1. Market Analysis, Insights and Forecast - by Distribution Channel
- 7.1.1. Convenience Store
- 7.1.2. Online Retail Store
- 7.1.3. Supermarket/Hypermarket
- 7.1.4. Others
- 7.1. Market Analysis, Insights and Forecast - by Distribution Channel
- 8. Europe Protein Bar Industry Analysis, Insights and Forecast, 2020-2032
- 8.1. Market Analysis, Insights and Forecast - by Distribution Channel
- 8.1.1. Convenience Store
- 8.1.2. Online Retail Store
- 8.1.3. Supermarket/Hypermarket
- 8.1.4. Others
- 8.1. Market Analysis, Insights and Forecast - by Distribution Channel
- 9. Middle East & Africa Protein Bar Industry Analysis, Insights and Forecast, 2020-2032
- 9.1. Market Analysis, Insights and Forecast - by Distribution Channel
- 9.1.1. Convenience Store
- 9.1.2. Online Retail Store
- 9.1.3. Supermarket/Hypermarket
- 9.1.4. Others
- 9.1. Market Analysis, Insights and Forecast - by Distribution Channel
- 10. Asia Pacific Protein Bar Industry Analysis, Insights and Forecast, 2020-2032
- 10.1. Market Analysis, Insights and Forecast - by Distribution Channel
- 10.1.1. Convenience Store
- 10.1.2. Online Retail Store
- 10.1.3. Supermarket/Hypermarket
- 10.1.4. Others
- 10.1. Market Analysis, Insights and Forecast - by Distribution Channel
- 11. Competitive Analysis
- 11.1. Global Market Share Analysis 2025
- 11.2. Company Profiles
- 11.2.1 Caveman Foods LLC
- 11.2.1.1. Overview
- 11.2.1.2. Products
- 11.2.1.3. SWOT Analysis
- 11.2.1.4. Recent Developments
- 11.2.1.5. Financials (Based on Availability)
- 11.2.2 Simply Good Foods Co
- 11.2.2.1. Overview
- 11.2.2.2. Products
- 11.2.2.3. SWOT Analysis
- 11.2.2.4. Recent Developments
- 11.2.2.5. Financials (Based on Availability)
- 11.2.3 General Mills Inc
- 11.2.3.1. Overview
- 11.2.3.2. Products
- 11.2.3.3. SWOT Analysis
- 11.2.3.4. Recent Developments
- 11.2.3.5. Financials (Based on Availability)
- 11.2.4 PepsiCo Inc
- 11.2.4.1. Overview
- 11.2.4.2. Products
- 11.2.4.3. SWOT Analysis
- 11.2.4.4. Recent Developments
- 11.2.4.5. Financials (Based on Availability)
- 11.2.5 Lotus Bakeries
- 11.2.5.1. Overview
- 11.2.5.2. Products
- 11.2.5.3. SWOT Analysis
- 11.2.5.4. Recent Developments
- 11.2.5.5. Financials (Based on Availability)
- 11.2.6 GNC Holdings LLC
- 11.2.6.1. Overview
- 11.2.6.2. Products
- 11.2.6.3. SWOT Analysis
- 11.2.6.4. Recent Developments
- 11.2.6.5. Financials (Based on Availability)
- 11.2.7 Naturell India Pvt Ltd
- 11.2.7.1. Overview
- 11.2.7.2. Products
- 11.2.7.3. SWOT Analysis
- 11.2.7.4. Recent Developments
- 11.2.7.5. Financials (Based on Availability)
- 11.2.8 Mars Incorporated
- 11.2.8.1. Overview
- 11.2.8.2. Products
- 11.2.8.3. SWOT Analysis
- 11.2.8.4. Recent Developments
- 11.2.8.5. Financials (Based on Availability)
- 11.2.9 Fitshit Health Solutions Pvt Ltd
- 11.2.9.1. Overview
- 11.2.9.2. Products
- 11.2.9.3. SWOT Analysis
- 11.2.9.4. Recent Developments
- 11.2.9.5. Financials (Based on Availability)
- 11.2.10 The Hershey Compan
- 11.2.10.1. Overview
- 11.2.10.2. Products
- 11.2.10.3. SWOT Analysis
- 11.2.10.4. Recent Developments
- 11.2.10.5. Financials (Based on Availability)
- 11.2.11 Associated British Foods PLC
- 11.2.11.1. Overview
- 11.2.11.2. Products
- 11.2.11.3. SWOT Analysis
- 11.2.11.4. Recent Developments
- 11.2.11.5. Financials (Based on Availability)
- 11.2.12 Stayfit Enterprize Private Limited
- 11.2.12.1. Overview
- 11.2.12.2. Products
- 11.2.12.3. SWOT Analysis
- 11.2.12.4. Recent Developments
- 11.2.12.5. Financials (Based on Availability)
- 11.2.13 Glanbia Plc
- 11.2.13.1. Overview
- 11.2.13.2. Products
- 11.2.13.3. SWOT Analysis
- 11.2.13.4. Recent Developments
- 11.2.13.5. Financials (Based on Availability)
- 11.2.14 Kellogg Company
- 11.2.14.1. Overview
- 11.2.14.2. Products
- 11.2.14.3. SWOT Analysis
- 11.2.14.4. Recent Developments
- 11.2.14.5. Financials (Based on Availability)
- 11.2.1 Caveman Foods LLC
List of Figures
- Figure 1: Global Protein Bar Industry Revenue Breakdown (Million, %) by Region 2025 & 2033
- Figure 2: Global Protein Bar Industry Volume Breakdown (K Tons, %) by Region 2025 & 2033
- Figure 3: North America Protein Bar Industry Revenue (Million), by Distribution Channel 2025 & 2033
- Figure 4: North America Protein Bar Industry Volume (K Tons), by Distribution Channel 2025 & 2033
- Figure 5: North America Protein Bar Industry Revenue Share (%), by Distribution Channel 2025 & 2033
- Figure 6: North America Protein Bar Industry Volume Share (%), by Distribution Channel 2025 & 2033
- Figure 7: North America Protein Bar Industry Revenue (Million), by Country 2025 & 2033
- Figure 8: North America Protein Bar Industry Volume (K Tons), by Country 2025 & 2033
- Figure 9: North America Protein Bar Industry Revenue Share (%), by Country 2025 & 2033
- Figure 10: North America Protein Bar Industry Volume Share (%), by Country 2025 & 2033
- Figure 11: South America Protein Bar Industry Revenue (Million), by Distribution Channel 2025 & 2033
- Figure 12: South America Protein Bar Industry Volume (K Tons), by Distribution Channel 2025 & 2033
- Figure 13: South America Protein Bar Industry Revenue Share (%), by Distribution Channel 2025 & 2033
- Figure 14: South America Protein Bar Industry Volume Share (%), by Distribution Channel 2025 & 2033
- Figure 15: South America Protein Bar Industry Revenue (Million), by Country 2025 & 2033
- Figure 16: South America Protein Bar Industry Volume (K Tons), by Country 2025 & 2033
- Figure 17: South America Protein Bar Industry Revenue Share (%), by Country 2025 & 2033
- Figure 18: South America Protein Bar Industry Volume Share (%), by Country 2025 & 2033
- Figure 19: Europe Protein Bar Industry Revenue (Million), by Distribution Channel 2025 & 2033
- Figure 20: Europe Protein Bar Industry Volume (K Tons), by Distribution Channel 2025 & 2033
- Figure 21: Europe Protein Bar Industry Revenue Share (%), by Distribution Channel 2025 & 2033
- Figure 22: Europe Protein Bar Industry Volume Share (%), by Distribution Channel 2025 & 2033
- Figure 23: Europe Protein Bar Industry Revenue (Million), by Country 2025 & 2033
- Figure 24: Europe Protein Bar Industry Volume (K Tons), by Country 2025 & 2033
- Figure 25: Europe Protein Bar Industry Revenue Share (%), by Country 2025 & 2033
- Figure 26: Europe Protein Bar Industry Volume Share (%), by Country 2025 & 2033
- Figure 27: Middle East & Africa Protein Bar Industry Revenue (Million), by Distribution Channel 2025 & 2033
- Figure 28: Middle East & Africa Protein Bar Industry Volume (K Tons), by Distribution Channel 2025 & 2033
- Figure 29: Middle East & Africa Protein Bar Industry Revenue Share (%), by Distribution Channel 2025 & 2033
- Figure 30: Middle East & Africa Protein Bar Industry Volume Share (%), by Distribution Channel 2025 & 2033
- Figure 31: Middle East & Africa Protein Bar Industry Revenue (Million), by Country 2025 & 2033
- Figure 32: Middle East & Africa Protein Bar Industry Volume (K Tons), by Country 2025 & 2033
- Figure 33: Middle East & Africa Protein Bar Industry Revenue Share (%), by Country 2025 & 2033
- Figure 34: Middle East & Africa Protein Bar Industry Volume Share (%), by Country 2025 & 2033
- Figure 35: Asia Pacific Protein Bar Industry Revenue (Million), by Distribution Channel 2025 & 2033
- Figure 36: Asia Pacific Protein Bar Industry Volume (K Tons), by Distribution Channel 2025 & 2033
- Figure 37: Asia Pacific Protein Bar Industry Revenue Share (%), by Distribution Channel 2025 & 2033
- Figure 38: Asia Pacific Protein Bar Industry Volume Share (%), by Distribution Channel 2025 & 2033
- Figure 39: Asia Pacific Protein Bar Industry Revenue (Million), by Country 2025 & 2033
- Figure 40: Asia Pacific Protein Bar Industry Volume (K Tons), by Country 2025 & 2033
- Figure 41: Asia Pacific Protein Bar Industry Revenue Share (%), by Country 2025 & 2033
- Figure 42: Asia Pacific Protein Bar Industry Volume Share (%), by Country 2025 & 2033
List of Tables
- Table 1: Global Protein Bar Industry Revenue Million Forecast, by Distribution Channel 2020 & 2033
- Table 2: Global Protein Bar Industry Volume K Tons Forecast, by Distribution Channel 2020 & 2033
- Table 3: Global Protein Bar Industry Revenue Million Forecast, by Region 2020 & 2033
- Table 4: Global Protein Bar Industry Volume K Tons Forecast, by Region 2020 & 2033
- Table 5: Global Protein Bar Industry Revenue Million Forecast, by Distribution Channel 2020 & 2033
- Table 6: Global Protein Bar Industry Volume K Tons Forecast, by Distribution Channel 2020 & 2033
- Table 7: Global Protein Bar Industry Revenue Million Forecast, by Country 2020 & 2033
- Table 8: Global Protein Bar Industry Volume K Tons Forecast, by Country 2020 & 2033
- Table 9: United States Protein Bar Industry Revenue (Million) Forecast, by Application 2020 & 2033
- Table 10: United States Protein Bar Industry Volume (K Tons) Forecast, by Application 2020 & 2033
- Table 11: Canada Protein Bar Industry Revenue (Million) Forecast, by Application 2020 & 2033
- Table 12: Canada Protein Bar Industry Volume (K Tons) Forecast, by Application 2020 & 2033
- Table 13: Mexico Protein Bar Industry Revenue (Million) Forecast, by Application 2020 & 2033
- Table 14: Mexico Protein Bar Industry Volume (K Tons) Forecast, by Application 2020 & 2033
- Table 15: Global Protein Bar Industry Revenue Million Forecast, by Distribution Channel 2020 & 2033
- Table 16: Global Protein Bar Industry Volume K Tons Forecast, by Distribution Channel 2020 & 2033
- Table 17: Global Protein Bar Industry Revenue Million Forecast, by Country 2020 & 2033
- Table 18: Global Protein Bar Industry Volume K Tons Forecast, by Country 2020 & 2033
- Table 19: Brazil Protein Bar Industry Revenue (Million) Forecast, by Application 2020 & 2033
- Table 20: Brazil Protein Bar Industry Volume (K Tons) Forecast, by Application 2020 & 2033
- Table 21: Argentina Protein Bar Industry Revenue (Million) Forecast, by Application 2020 & 2033
- Table 22: Argentina Protein Bar Industry Volume (K Tons) Forecast, by Application 2020 & 2033
- Table 23: Rest of South America Protein Bar Industry Revenue (Million) Forecast, by Application 2020 & 2033
- Table 24: Rest of South America Protein Bar Industry Volume (K Tons) Forecast, by Application 2020 & 2033
- Table 25: Global Protein Bar Industry Revenue Million Forecast, by Distribution Channel 2020 & 2033
- Table 26: Global Protein Bar Industry Volume K Tons Forecast, by Distribution Channel 2020 & 2033
- Table 27: Global Protein Bar Industry Revenue Million Forecast, by Country 2020 & 2033
- Table 28: Global Protein Bar Industry Volume K Tons Forecast, by Country 2020 & 2033
- Table 29: United Kingdom Protein Bar Industry Revenue (Million) Forecast, by Application 2020 & 2033
- Table 30: United Kingdom Protein Bar Industry Volume (K Tons) Forecast, by Application 2020 & 2033
- Table 31: Germany Protein Bar Industry Revenue (Million) Forecast, by Application 2020 & 2033
- Table 32: Germany Protein Bar Industry Volume (K Tons) Forecast, by Application 2020 & 2033
- Table 33: France Protein Bar Industry Revenue (Million) Forecast, by Application 2020 & 2033
- Table 34: France Protein Bar Industry Volume (K Tons) Forecast, by Application 2020 & 2033
- Table 35: Italy Protein Bar Industry Revenue (Million) Forecast, by Application 2020 & 2033
- Table 36: Italy Protein Bar Industry Volume (K Tons) Forecast, by Application 2020 & 2033
- Table 37: Spain Protein Bar Industry Revenue (Million) Forecast, by Application 2020 & 2033
- Table 38: Spain Protein Bar Industry Volume (K Tons) Forecast, by Application 2020 & 2033
- Table 39: Russia Protein Bar Industry Revenue (Million) Forecast, by Application 2020 & 2033
- Table 40: Russia Protein Bar Industry Volume (K Tons) Forecast, by Application 2020 & 2033
- Table 41: Benelux Protein Bar Industry Revenue (Million) Forecast, by Application 2020 & 2033
- Table 42: Benelux Protein Bar Industry Volume (K Tons) Forecast, by Application 2020 & 2033
- Table 43: Nordics Protein Bar Industry Revenue (Million) Forecast, by Application 2020 & 2033
- Table 44: Nordics Protein Bar Industry Volume (K Tons) Forecast, by Application 2020 & 2033
- Table 45: Rest of Europe Protein Bar Industry Revenue (Million) Forecast, by Application 2020 & 2033
- Table 46: Rest of Europe Protein Bar Industry Volume (K Tons) Forecast, by Application 2020 & 2033
- Table 47: Global Protein Bar Industry Revenue Million Forecast, by Distribution Channel 2020 & 2033
- Table 48: Global Protein Bar Industry Volume K Tons Forecast, by Distribution Channel 2020 & 2033
- Table 49: Global Protein Bar Industry Revenue Million Forecast, by Country 2020 & 2033
- Table 50: Global Protein Bar Industry Volume K Tons Forecast, by Country 2020 & 2033
- Table 51: Turkey Protein Bar Industry Revenue (Million) Forecast, by Application 2020 & 2033
- Table 52: Turkey Protein Bar Industry Volume (K Tons) Forecast, by Application 2020 & 2033
- Table 53: Israel Protein Bar Industry Revenue (Million) Forecast, by Application 2020 & 2033
- Table 54: Israel Protein Bar Industry Volume (K Tons) Forecast, by Application 2020 & 2033
- Table 55: GCC Protein Bar Industry Revenue (Million) Forecast, by Application 2020 & 2033
- Table 56: GCC Protein Bar Industry Volume (K Tons) Forecast, by Application 2020 & 2033
- Table 57: North Africa Protein Bar Industry Revenue (Million) Forecast, by Application 2020 & 2033
- Table 58: North Africa Protein Bar Industry Volume (K Tons) Forecast, by Application 2020 & 2033
- Table 59: South Africa Protein Bar Industry Revenue (Million) Forecast, by Application 2020 & 2033
- Table 60: South Africa Protein Bar Industry Volume (K Tons) Forecast, by Application 2020 & 2033
- Table 61: Rest of Middle East & Africa Protein Bar Industry Revenue (Million) Forecast, by Application 2020 & 2033
- Table 62: Rest of Middle East & Africa Protein Bar Industry Volume (K Tons) Forecast, by Application 2020 & 2033
- Table 63: Global Protein Bar Industry Revenue Million Forecast, by Distribution Channel 2020 & 2033
- Table 64: Global Protein Bar Industry Volume K Tons Forecast, by Distribution Channel 2020 & 2033
- Table 65: Global Protein Bar Industry Revenue Million Forecast, by Country 2020 & 2033
- Table 66: Global Protein Bar Industry Volume K Tons Forecast, by Country 2020 & 2033
- Table 67: China Protein Bar Industry Revenue (Million) Forecast, by Application 2020 & 2033
- Table 68: China Protein Bar Industry Volume (K Tons) Forecast, by Application 2020 & 2033
- Table 69: India Protein Bar Industry Revenue (Million) Forecast, by Application 2020 & 2033
- Table 70: India Protein Bar Industry Volume (K Tons) Forecast, by Application 2020 & 2033
- Table 71: Japan Protein Bar Industry Revenue (Million) Forecast, by Application 2020 & 2033
- Table 72: Japan Protein Bar Industry Volume (K Tons) Forecast, by Application 2020 & 2033
- Table 73: South Korea Protein Bar Industry Revenue (Million) Forecast, by Application 2020 & 2033
- Table 74: South Korea Protein Bar Industry Volume (K Tons) Forecast, by Application 2020 & 2033
- Table 75: ASEAN Protein Bar Industry Revenue (Million) Forecast, by Application 2020 & 2033
- Table 76: ASEAN Protein Bar Industry Volume (K Tons) Forecast, by Application 2020 & 2033
- Table 77: Oceania Protein Bar Industry Revenue (Million) Forecast, by Application 2020 & 2033
- Table 78: Oceania Protein Bar Industry Volume (K Tons) Forecast, by Application 2020 & 2033
- Table 79: Rest of Asia Pacific Protein Bar Industry Revenue (Million) Forecast, by Application 2020 & 2033
- Table 80: Rest of Asia Pacific Protein Bar Industry Volume (K Tons) Forecast, by Application 2020 & 2033
Frequently Asked Questions
1. What is the projected Compound Annual Growth Rate (CAGR) of the Protein Bar Industry?
The projected CAGR is approximately 6.10%.
2. Which companies are prominent players in the Protein Bar Industry?
Key companies in the market include Caveman Foods LLC, Simply Good Foods Co, General Mills Inc, PepsiCo Inc, Lotus Bakeries, GNC Holdings LLC, Naturell India Pvt Ltd, Mars Incorporated, Fitshit Health Solutions Pvt Ltd, The Hershey Compan, Associated British Foods PLC, Stayfit Enterprize Private Limited, Glanbia Plc, Kellogg Company.
3. What are the main segments of the Protein Bar Industry?
The market segments include Distribution Channel.
4. Can you provide details about the market size?
The market size is estimated to be USD 4910 Million as of 2022.
5. What are some drivers contributing to market growth?
Increasing Demand for Low-Fat and Fat-Free Food Products; Expanding Cosmetic and Personal Care Industries Utilize Gelatin for Various Purposes.
6. What are the notable trends driving market growth?
OTHER KEY INDUSTRY TRENDS COVERED IN THE REPORT.
7. Are there any restraints impacting market growth?
Fluctuations in Raw Material Proces Affecting Production Costs.
8. Can you provide examples of recent developments in the market?
May 2023: General Mills Inc. announced that it would be expanding its Nature Valley brand with the introduction of Nature Valley Savory Nut Crunch Bars.April 2023: Under the brand ONE Brands, The Hershey Company launched the Peanut Butter & Jelly Flavored Protein Bar. The ONE Limited Edition Peanut Butter & Jelly flavored bars are packed with 20 grams of protein, 1 gram of sugar, and the taste of peanut butter and strawberry jelly flavors.January 2023: The Hershey Company launched caffeinated protein bars. The range is available in two flavors: vanilla latte and caramel macchiato.
9. What pricing options are available for accessing the report?
Pricing options include single-user, multi-user, and enterprise licenses priced at USD 3800, USD 4500, and USD 5800 respectively.
10. Is the market size provided in terms of value or volume?
The market size is provided in terms of value, measured in Million and volume, measured in K Tons.
11. Are there any specific market keywords associated with the report?
Yes, the market keyword associated with the report is "Protein Bar Industry," which aids in identifying and referencing the specific market segment covered.
12. How do I determine which pricing option suits my needs best?
The pricing options vary based on user requirements and access needs. Individual users may opt for single-user licenses, while businesses requiring broader access may choose multi-user or enterprise licenses for cost-effective access to the report.
13. Are there any additional resources or data provided in the Protein Bar Industry report?
While the report offers comprehensive insights, it's advisable to review the specific contents or supplementary materials provided to ascertain if additional resources or data are available.
14. How can I stay updated on further developments or reports in the Protein Bar Industry?
To stay informed about further developments, trends, and reports in the Protein Bar Industry, consider subscribing to industry newsletters, following relevant companies and organizations, or regularly checking reputable industry news sources and publications.
Methodology
Step 1 - Identification of Relevant Samples Size from Population Database


Step 2 - Approaches for Defining Global Market Size (Value, Volume* & Price*)

Note*: In applicable scenarios
Step 3 - Data Sources
Primary Research
- Web Analytics
- Survey Reports
- Research Institute
- Latest Research Reports
- Opinion Leaders
Secondary Research
- Annual Reports
- White Paper
- Latest Press Release
- Industry Association
- Paid Database
- Investor Presentations

Step 4 - Data Triangulation
Involves using different sources of information in order to increase the validity of a study
These sources are likely to be stakeholders in a program - participants, other researchers, program staff, other community members, and so on.
Then we put all data in single framework & apply various statistical tools to find out the dynamic on the market.
During the analysis stage, feedback from the stakeholder groups would be compared to determine areas of agreement as well as areas of divergence