

Key Insights
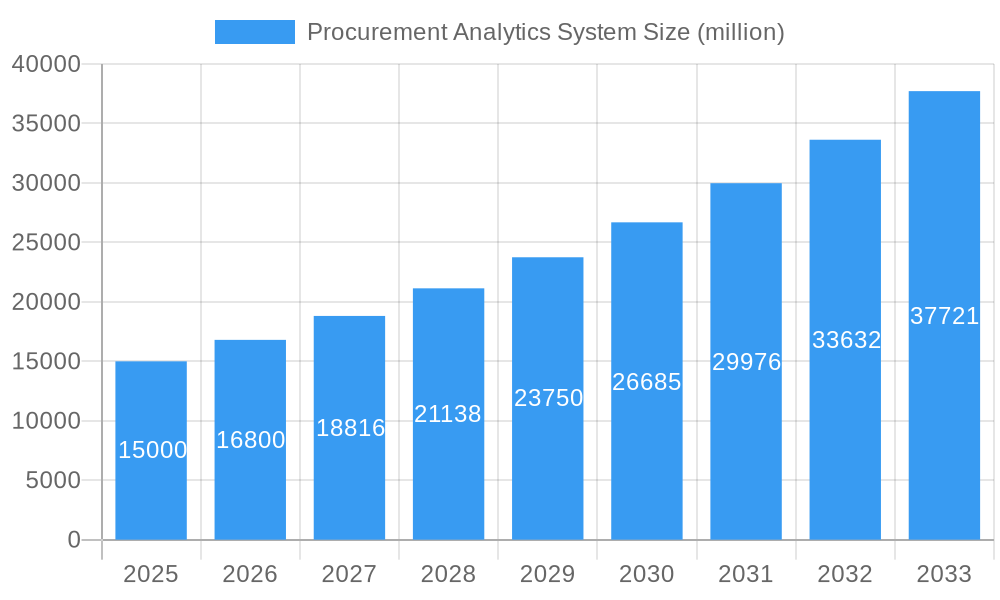
The Procurement Analytics System market is experiencing robust growth, driven by the increasing need for enhanced efficiency and cost optimization within procurement departments across various industries. The market, estimated at $15 billion in 2025, is projected to exhibit a healthy Compound Annual Growth Rate (CAGR) of 12% from 2025 to 2033, reaching approximately $45 billion by 2033. This expansion is fueled by several key factors. The rising adoption of cloud-based solutions offers scalability and accessibility, attracting both small and medium enterprises (SMEs) and large enterprises. Furthermore, the increasing availability of large datasets and advanced analytical tools enables businesses to gain deeper insights into their spending patterns, identify cost-saving opportunities, and improve supplier relationship management. The shift towards digital transformation and the growing adoption of AI and machine learning in procurement processes further accelerate market growth.
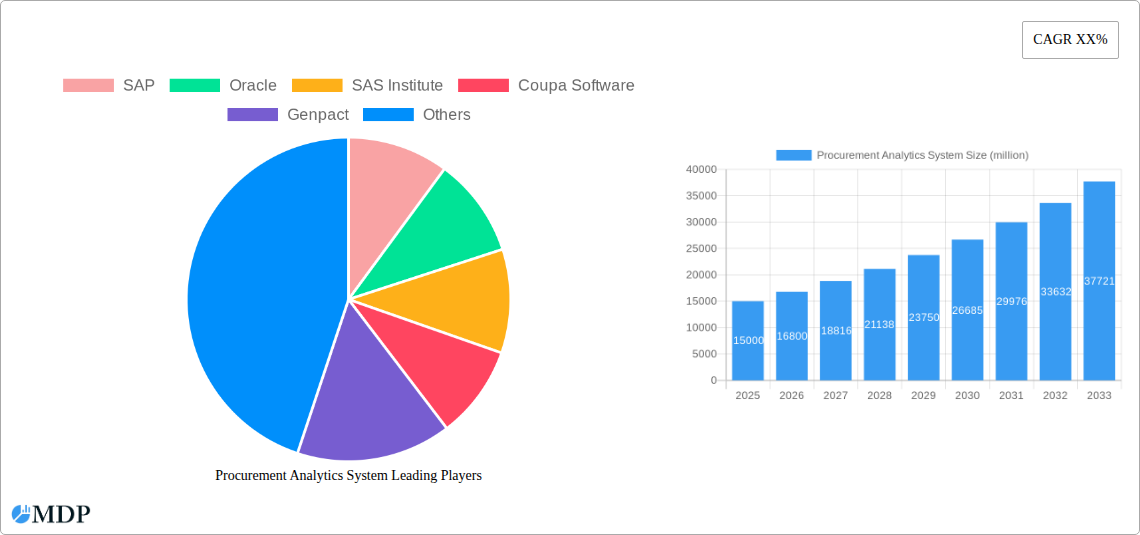
Procurement Analytics System Market Size (In Billion)
However, the market faces certain challenges. High implementation costs, especially for on-premise solutions, and the need for specialized expertise to effectively utilize these systems can act as restraints. Data security and privacy concerns also play a significant role, as procurement analytics systems often handle sensitive financial and supplier information. Despite these constraints, the long-term outlook remains positive, driven by continuous technological advancements, increasing data volumes, and growing awareness of the benefits of data-driven procurement decision-making. The market segmentation reveals a strong preference for cloud-based solutions due to their flexibility and cost-effectiveness, with large enterprises leading the adoption curve due to their greater resources and complex procurement needs. Geographic distribution shows North America and Europe as the dominant regions, while Asia-Pacific is expected to witness substantial growth in the coming years, fueled by rapid economic development and digitalization initiatives.
Procurement Analytics System Company Market Share
Procurement Analytics System Market Report: 2019-2033
Unlocking Billions in Procurement Efficiency: A Comprehensive Market Analysis
This comprehensive report provides an in-depth analysis of the Procurement Analytics System market, projecting a multi-billion-dollar valuation by 2033. It meticulously examines market dynamics, leading players, technological advancements, and key growth drivers, offering invaluable insights for stakeholders across the procurement landscape. From small and medium enterprises (SMEs) to large enterprises, and across on-premise and cloud-based solutions, this report delivers actionable intelligence to navigate this rapidly evolving sector. The study period spans 2019-2033, with 2025 serving as the base and estimated year. The forecast period covers 2025-2033, while the historical period encompasses 2019-2024.
Procurement Analytics System Market Dynamics & Concentration
The global procurement analytics system market is experiencing robust growth, driven by the increasing need for enhanced efficiency, cost optimization, and risk mitigation within procurement processes. Market concentration is moderate, with several key players holding significant market share, but also allowing for the emergence of niche players and innovative solutions. The market is characterized by continuous innovation, with companies investing heavily in AI, machine learning, and advanced data analytics capabilities to improve their offerings. Regulatory frameworks, particularly concerning data privacy and security, play a significant role in shaping market dynamics. Product substitutes, such as traditional manual procurement processes and less sophisticated analytics tools, are gradually losing ground to comprehensive procurement analytics systems. End-user trends indicate a strong preference for cloud-based solutions due to their scalability and cost-effectiveness. The market has witnessed significant M&A activity in recent years, with an estimated xx million deals closed between 2019 and 2024, contributing to market consolidation. Key players like SAP and Oracle maintain a substantial market share, estimated at xx% and xx% respectively in 2025, driving the market's trajectory.
- Market Share (2025): SAP - xx%, Oracle - xx%, Others - xx%
- M&A Deal Count (2019-2024): xx million
Procurement Analytics System Industry Trends & Analysis
The Procurement Analytics System market demonstrates a robust Compound Annual Growth Rate (CAGR) of xx% during the forecast period (2025-2033), propelled by several key factors. The increasing adoption of cloud-based solutions, coupled with the rising demand for real-time data insights and predictive analytics, significantly contributes to market expansion. Technological disruptions, such as the integration of AI and machine learning, are revolutionizing procurement operations, enhancing efficiency and transparency. Consumer preferences are shifting towards user-friendly, integrated platforms that offer seamless data visualization and actionable insights. Competitive dynamics are fierce, with established players and innovative startups vying for market dominance through product differentiation, strategic partnerships, and technological advancements. Market penetration is expected to reach xx% by 2033, driven by widespread adoption across various industries.
Leading Markets & Segments in Procurement Analytics System
The North American region currently holds the dominant position in the Procurement Analytics System market, driven by high technological adoption, robust digital infrastructure, and a large number of enterprises embracing advanced procurement solutions. Within the application segments, large enterprises represent the largest market share due to their higher budgets and greater need for comprehensive analytics capabilities. Cloud-based solutions are witnessing accelerated growth, surpassing on-premise deployments due to their scalability, flexibility, and reduced infrastructure costs.
- Key Drivers for North American Dominance:
- Advanced technological infrastructure
- High digital literacy and adoption rates
- Strong emphasis on operational efficiency and cost reduction among large enterprises
- Favorable regulatory environment
- Large Enterprise Segment Dominance:
- High spending power and budgets allocated to technology solutions
- Need for complex analytics to manage extensive procurement operations
- Potential for significant ROI through improved efficiency and cost savings.
- Cloud-based Solutions Growth:
- Scalability and flexibility to adapt to changing business needs
- Reduced upfront investment and ongoing maintenance costs
- Easier access to advanced analytics capabilities.
Procurement Analytics System Product Developments
Recent product developments focus on integrating advanced analytics capabilities, including AI and machine learning, into procurement platforms. This allows for predictive analytics, risk mitigation, and automated decision-making, leading to significant improvements in efficiency and cost savings. Emphasis is placed on creating user-friendly interfaces with intuitive dashboards for real-time data visualization and insightful reporting. The market is witnessing a trend towards integrated solutions that seamlessly connect with existing ERP and supply chain management systems. This enhances data accessibility and reduces the complexity of data integration, allowing for a holistic view of procurement operations.
Key Drivers of Procurement Analytics System Growth
Several factors propel the growth of the Procurement Analytics System market. Technological advancements, particularly in AI and machine learning, are driving the development of more sophisticated and effective analytics solutions. The increasing focus on cost optimization and efficiency improvements across various industries is fueling demand. Favorable regulatory frameworks, encouraging the adoption of digital technologies, and government initiatives supporting digital transformation further contribute to market expansion. Examples include the increasing adoption of e-procurement and the growing demand for data-driven decision-making within procurement departments.
Challenges in the Procurement Analytics System Market
The market faces several challenges. Data security and privacy concerns can hinder the adoption of cloud-based solutions. The integration of disparate data sources from various systems can be complex and costly. The high initial investment required for implementing procurement analytics systems can be a barrier for some SMEs. Furthermore, the competitive landscape, with several established players and emerging startups, can make it challenging to stand out. These factors can collectively impact market growth by reducing the rate of adoption and penetration, potentially impacting the overall market value by an estimated xx million annually.
Emerging Opportunities in Procurement Analytics System
The integration of blockchain technology promises to enhance transparency and traceability within supply chains. Strategic partnerships between analytics providers and procurement software vendors offer opportunities for creating comprehensive, integrated solutions. Market expansion into emerging economies with rapidly growing procurement sectors represents substantial potential. These factors are expected to accelerate market growth and contribute to a significantly larger market size by the end of the forecast period.
Leading Players in the Procurement Analytics System Sector
- SAP
- Oracle
- SAS Institute
- Coupa Software
- Genpact
- Rosslyn Data Technologies
- Microsoft
- IBM
- Cisco
- GEP
Key Milestones in Procurement Analytics System Industry
- 2020: Increased adoption of cloud-based procurement analytics systems.
- 2021: Significant investments in AI and machine learning for procurement analytics.
- 2022: Launch of several integrated procurement platforms with enhanced analytics capabilities.
- 2023: Growing focus on data security and privacy in procurement analytics solutions.
- 2024: Several strategic partnerships formed between procurement analytics providers and other technology vendors.
Strategic Outlook for Procurement Analytics System Market
The future of the Procurement Analytics System market is bright, with substantial growth potential driven by technological advancements, increased adoption across various industries, and the growing emphasis on data-driven decision-making. Strategic opportunities abound for companies that can deliver innovative, user-friendly, and secure solutions. Continued focus on integrating AI, machine learning, and blockchain technology will be critical for maintaining a competitive edge. Expanding into new markets and forming strategic partnerships will further enhance growth prospects. The market is poised for significant expansion, potentially reaching a valuation of xx million by 2033.
Procurement Analytics System Segmentation
-
1. Application
- 1.1. Small and Medium Enterprise
- 1.2. Large Enterprise
-
2. Types
- 2.1. On-premise
- 2.2. Cloud-based
Procurement Analytics System Segmentation By Geography
-
1. North America
- 1.1. United States
- 1.2. Canada
- 1.3. Mexico
-
2. South America
- 2.1. Brazil
- 2.2. Argentina
- 2.3. Rest of South America
-
3. Europe
- 3.1. United Kingdom
- 3.2. Germany
- 3.3. France
- 3.4. Italy
- 3.5. Spain
- 3.6. Russia
- 3.7. Benelux
- 3.8. Nordics
- 3.9. Rest of Europe
-
4. Middle East & Africa
- 4.1. Turkey
- 4.2. Israel
- 4.3. GCC
- 4.4. North Africa
- 4.5. South Africa
- 4.6. Rest of Middle East & Africa
-
5. Asia Pacific
- 5.1. China
- 5.2. India
- 5.3. Japan
- 5.4. South Korea
- 5.5. ASEAN
- 5.6. Oceania
- 5.7. Rest of Asia Pacific
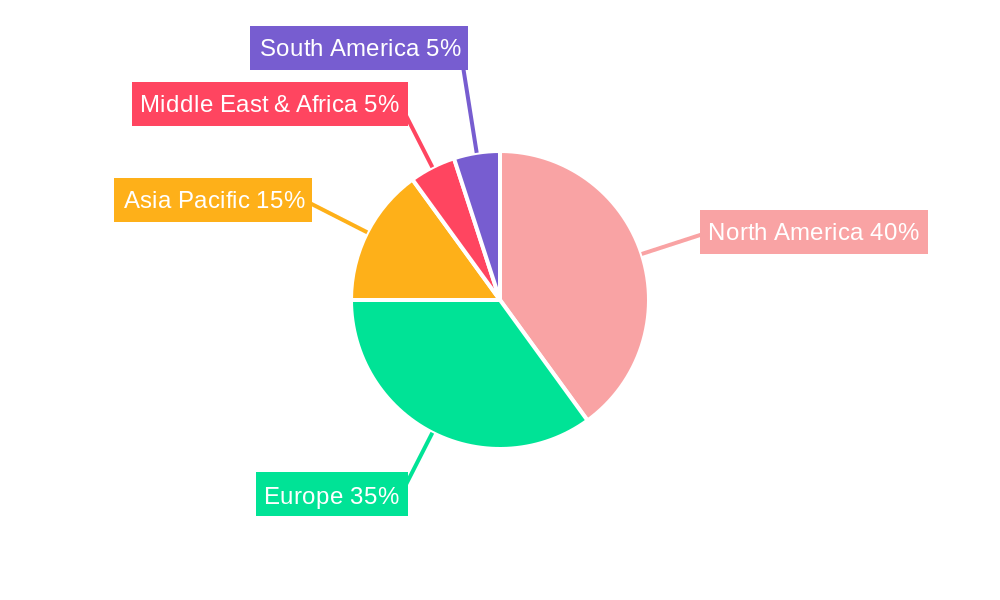
Procurement Analytics System Regional Market Share
Geographic Coverage of Procurement Analytics System
Procurement Analytics System REPORT HIGHLIGHTS
| Aspects | Details |
|---|---|
| Study Period | 2020-2034 |
| Base Year | 2025 |
| Estimated Year | 2026 |
| Forecast Period | 2026-2034 |
| Historical Period | 2020-2025 |
| Growth Rate | CAGR of 9.2% from 2020-2034 |
| Segmentation |
|
Table of Contents
- 1. Introduction
- 1.1. Research Scope
- 1.2. Market Segmentation
- 1.3. Research Methodology
- 1.4. Definitions and Assumptions
- 2. Executive Summary
- 2.1. Introduction
- 3. Market Dynamics
- 3.1. Introduction
- 3.2. Market Drivers
- 3.3. Market Restrains
- 3.4. Market Trends
- 4. Market Factor Analysis
- 4.1. Porters Five Forces
- 4.2. Supply/Value Chain
- 4.3. PESTEL analysis
- 4.4. Market Entropy
- 4.5. Patent/Trademark Analysis
- 5. Global Procurement Analytics System Analysis, Insights and Forecast, 2020-2032
- 5.1. Market Analysis, Insights and Forecast - by Application
- 5.1.1. Small and Medium Enterprise
- 5.1.2. Large Enterprise
- 5.2. Market Analysis, Insights and Forecast - by Types
- 5.2.1. On-premise
- 5.2.2. Cloud-based
- 5.3. Market Analysis, Insights and Forecast - by Region
- 5.3.1. North America
- 5.3.2. South America
- 5.3.3. Europe
- 5.3.4. Middle East & Africa
- 5.3.5. Asia Pacific
- 5.1. Market Analysis, Insights and Forecast - by Application
- 6. North America Procurement Analytics System Analysis, Insights and Forecast, 2020-2032
- 6.1. Market Analysis, Insights and Forecast - by Application
- 6.1.1. Small and Medium Enterprise
- 6.1.2. Large Enterprise
- 6.2. Market Analysis, Insights and Forecast - by Types
- 6.2.1. On-premise
- 6.2.2. Cloud-based
- 6.1. Market Analysis, Insights and Forecast - by Application
- 7. South America Procurement Analytics System Analysis, Insights and Forecast, 2020-2032
- 7.1. Market Analysis, Insights and Forecast - by Application
- 7.1.1. Small and Medium Enterprise
- 7.1.2. Large Enterprise
- 7.2. Market Analysis, Insights and Forecast - by Types
- 7.2.1. On-premise
- 7.2.2. Cloud-based
- 7.1. Market Analysis, Insights and Forecast - by Application
- 8. Europe Procurement Analytics System Analysis, Insights and Forecast, 2020-2032
- 8.1. Market Analysis, Insights and Forecast - by Application
- 8.1.1. Small and Medium Enterprise
- 8.1.2. Large Enterprise
- 8.2. Market Analysis, Insights and Forecast - by Types
- 8.2.1. On-premise
- 8.2.2. Cloud-based
- 8.1. Market Analysis, Insights and Forecast - by Application
- 9. Middle East & Africa Procurement Analytics System Analysis, Insights and Forecast, 2020-2032
- 9.1. Market Analysis, Insights and Forecast - by Application
- 9.1.1. Small and Medium Enterprise
- 9.1.2. Large Enterprise
- 9.2. Market Analysis, Insights and Forecast - by Types
- 9.2.1. On-premise
- 9.2.2. Cloud-based
- 9.1. Market Analysis, Insights and Forecast - by Application
- 10. Asia Pacific Procurement Analytics System Analysis, Insights and Forecast, 2020-2032
- 10.1. Market Analysis, Insights and Forecast - by Application
- 10.1.1. Small and Medium Enterprise
- 10.1.2. Large Enterprise
- 10.2. Market Analysis, Insights and Forecast - by Types
- 10.2.1. On-premise
- 10.2.2. Cloud-based
- 10.1. Market Analysis, Insights and Forecast - by Application
- 11. Competitive Analysis
- 11.1. Global Market Share Analysis 2025
- 11.2. Company Profiles
- 11.2.1 SAP
- 11.2.1.1. Overview
- 11.2.1.2. Products
- 11.2.1.3. SWOT Analysis
- 11.2.1.4. Recent Developments
- 11.2.1.5. Financials (Based on Availability)
- 11.2.2 Oracle
- 11.2.2.1. Overview
- 11.2.2.2. Products
- 11.2.2.3. SWOT Analysis
- 11.2.2.4. Recent Developments
- 11.2.2.5. Financials (Based on Availability)
- 11.2.3 SAS Institute
- 11.2.3.1. Overview
- 11.2.3.2. Products
- 11.2.3.3. SWOT Analysis
- 11.2.3.4. Recent Developments
- 11.2.3.5. Financials (Based on Availability)
- 11.2.4 Coupa Software
- 11.2.4.1. Overview
- 11.2.4.2. Products
- 11.2.4.3. SWOT Analysis
- 11.2.4.4. Recent Developments
- 11.2.4.5. Financials (Based on Availability)
- 11.2.5 Genpact
- 11.2.5.1. Overview
- 11.2.5.2. Products
- 11.2.5.3. SWOT Analysis
- 11.2.5.4. Recent Developments
- 11.2.5.5. Financials (Based on Availability)
- 11.2.6 Rosslyn Data Technologies
- 11.2.6.1. Overview
- 11.2.6.2. Products
- 11.2.6.3. SWOT Analysis
- 11.2.6.4. Recent Developments
- 11.2.6.5. Financials (Based on Availability)
- 11.2.7 Microsoft
- 11.2.7.1. Overview
- 11.2.7.2. Products
- 11.2.7.3. SWOT Analysis
- 11.2.7.4. Recent Developments
- 11.2.7.5. Financials (Based on Availability)
- 11.2.8 IBM
- 11.2.8.1. Overview
- 11.2.8.2. Products
- 11.2.8.3. SWOT Analysis
- 11.2.8.4. Recent Developments
- 11.2.8.5. Financials (Based on Availability)
- 11.2.9 Cisco
- 11.2.9.1. Overview
- 11.2.9.2. Products
- 11.2.9.3. SWOT Analysis
- 11.2.9.4. Recent Developments
- 11.2.9.5. Financials (Based on Availability)
- 11.2.10 GEP
- 11.2.10.1. Overview
- 11.2.10.2. Products
- 11.2.10.3. SWOT Analysis
- 11.2.10.4. Recent Developments
- 11.2.10.5. Financials (Based on Availability)
- 11.2.1 SAP
List of Figures
- Figure 1: Global Procurement Analytics System Revenue Breakdown (undefined, %) by Region 2025 & 2033
- Figure 2: North America Procurement Analytics System Revenue (undefined), by Application 2025 & 2033
- Figure 3: North America Procurement Analytics System Revenue Share (%), by Application 2025 & 2033
- Figure 4: North America Procurement Analytics System Revenue (undefined), by Types 2025 & 2033
- Figure 5: North America Procurement Analytics System Revenue Share (%), by Types 2025 & 2033
- Figure 6: North America Procurement Analytics System Revenue (undefined), by Country 2025 & 2033
- Figure 7: North America Procurement Analytics System Revenue Share (%), by Country 2025 & 2033
- Figure 8: South America Procurement Analytics System Revenue (undefined), by Application 2025 & 2033
- Figure 9: South America Procurement Analytics System Revenue Share (%), by Application 2025 & 2033
- Figure 10: South America Procurement Analytics System Revenue (undefined), by Types 2025 & 2033
- Figure 11: South America Procurement Analytics System Revenue Share (%), by Types 2025 & 2033
- Figure 12: South America Procurement Analytics System Revenue (undefined), by Country 2025 & 2033
- Figure 13: South America Procurement Analytics System Revenue Share (%), by Country 2025 & 2033
- Figure 14: Europe Procurement Analytics System Revenue (undefined), by Application 2025 & 2033
- Figure 15: Europe Procurement Analytics System Revenue Share (%), by Application 2025 & 2033
- Figure 16: Europe Procurement Analytics System Revenue (undefined), by Types 2025 & 2033
- Figure 17: Europe Procurement Analytics System Revenue Share (%), by Types 2025 & 2033
- Figure 18: Europe Procurement Analytics System Revenue (undefined), by Country 2025 & 2033
- Figure 19: Europe Procurement Analytics System Revenue Share (%), by Country 2025 & 2033
- Figure 20: Middle East & Africa Procurement Analytics System Revenue (undefined), by Application 2025 & 2033
- Figure 21: Middle East & Africa Procurement Analytics System Revenue Share (%), by Application 2025 & 2033
- Figure 22: Middle East & Africa Procurement Analytics System Revenue (undefined), by Types 2025 & 2033
- Figure 23: Middle East & Africa Procurement Analytics System Revenue Share (%), by Types 2025 & 2033
- Figure 24: Middle East & Africa Procurement Analytics System Revenue (undefined), by Country 2025 & 2033
- Figure 25: Middle East & Africa Procurement Analytics System Revenue Share (%), by Country 2025 & 2033
- Figure 26: Asia Pacific Procurement Analytics System Revenue (undefined), by Application 2025 & 2033
- Figure 27: Asia Pacific Procurement Analytics System Revenue Share (%), by Application 2025 & 2033
- Figure 28: Asia Pacific Procurement Analytics System Revenue (undefined), by Types 2025 & 2033
- Figure 29: Asia Pacific Procurement Analytics System Revenue Share (%), by Types 2025 & 2033
- Figure 30: Asia Pacific Procurement Analytics System Revenue (undefined), by Country 2025 & 2033
- Figure 31: Asia Pacific Procurement Analytics System Revenue Share (%), by Country 2025 & 2033
List of Tables
- Table 1: Global Procurement Analytics System Revenue undefined Forecast, by Application 2020 & 2033
- Table 2: Global Procurement Analytics System Revenue undefined Forecast, by Types 2020 & 2033
- Table 3: Global Procurement Analytics System Revenue undefined Forecast, by Region 2020 & 2033
- Table 4: Global Procurement Analytics System Revenue undefined Forecast, by Application 2020 & 2033
- Table 5: Global Procurement Analytics System Revenue undefined Forecast, by Types 2020 & 2033
- Table 6: Global Procurement Analytics System Revenue undefined Forecast, by Country 2020 & 2033
- Table 7: United States Procurement Analytics System Revenue (undefined) Forecast, by Application 2020 & 2033
- Table 8: Canada Procurement Analytics System Revenue (undefined) Forecast, by Application 2020 & 2033
- Table 9: Mexico Procurement Analytics System Revenue (undefined) Forecast, by Application 2020 & 2033
- Table 10: Global Procurement Analytics System Revenue undefined Forecast, by Application 2020 & 2033
- Table 11: Global Procurement Analytics System Revenue undefined Forecast, by Types 2020 & 2033
- Table 12: Global Procurement Analytics System Revenue undefined Forecast, by Country 2020 & 2033
- Table 13: Brazil Procurement Analytics System Revenue (undefined) Forecast, by Application 2020 & 2033
- Table 14: Argentina Procurement Analytics System Revenue (undefined) Forecast, by Application 2020 & 2033
- Table 15: Rest of South America Procurement Analytics System Revenue (undefined) Forecast, by Application 2020 & 2033
- Table 16: Global Procurement Analytics System Revenue undefined Forecast, by Application 2020 & 2033
- Table 17: Global Procurement Analytics System Revenue undefined Forecast, by Types 2020 & 2033
- Table 18: Global Procurement Analytics System Revenue undefined Forecast, by Country 2020 & 2033
- Table 19: United Kingdom Procurement Analytics System Revenue (undefined) Forecast, by Application 2020 & 2033
- Table 20: Germany Procurement Analytics System Revenue (undefined) Forecast, by Application 2020 & 2033
- Table 21: France Procurement Analytics System Revenue (undefined) Forecast, by Application 2020 & 2033
- Table 22: Italy Procurement Analytics System Revenue (undefined) Forecast, by Application 2020 & 2033
- Table 23: Spain Procurement Analytics System Revenue (undefined) Forecast, by Application 2020 & 2033
- Table 24: Russia Procurement Analytics System Revenue (undefined) Forecast, by Application 2020 & 2033
- Table 25: Benelux Procurement Analytics System Revenue (undefined) Forecast, by Application 2020 & 2033
- Table 26: Nordics Procurement Analytics System Revenue (undefined) Forecast, by Application 2020 & 2033
- Table 27: Rest of Europe Procurement Analytics System Revenue (undefined) Forecast, by Application 2020 & 2033
- Table 28: Global Procurement Analytics System Revenue undefined Forecast, by Application 2020 & 2033
- Table 29: Global Procurement Analytics System Revenue undefined Forecast, by Types 2020 & 2033
- Table 30: Global Procurement Analytics System Revenue undefined Forecast, by Country 2020 & 2033
- Table 31: Turkey Procurement Analytics System Revenue (undefined) Forecast, by Application 2020 & 2033
- Table 32: Israel Procurement Analytics System Revenue (undefined) Forecast, by Application 2020 & 2033
- Table 33: GCC Procurement Analytics System Revenue (undefined) Forecast, by Application 2020 & 2033
- Table 34: North Africa Procurement Analytics System Revenue (undefined) Forecast, by Application 2020 & 2033
- Table 35: South Africa Procurement Analytics System Revenue (undefined) Forecast, by Application 2020 & 2033
- Table 36: Rest of Middle East & Africa Procurement Analytics System Revenue (undefined) Forecast, by Application 2020 & 2033
- Table 37: Global Procurement Analytics System Revenue undefined Forecast, by Application 2020 & 2033
- Table 38: Global Procurement Analytics System Revenue undefined Forecast, by Types 2020 & 2033
- Table 39: Global Procurement Analytics System Revenue undefined Forecast, by Country 2020 & 2033
- Table 40: China Procurement Analytics System Revenue (undefined) Forecast, by Application 2020 & 2033
- Table 41: India Procurement Analytics System Revenue (undefined) Forecast, by Application 2020 & 2033
- Table 42: Japan Procurement Analytics System Revenue (undefined) Forecast, by Application 2020 & 2033
- Table 43: South Korea Procurement Analytics System Revenue (undefined) Forecast, by Application 2020 & 2033
- Table 44: ASEAN Procurement Analytics System Revenue (undefined) Forecast, by Application 2020 & 2033
- Table 45: Oceania Procurement Analytics System Revenue (undefined) Forecast, by Application 2020 & 2033
- Table 46: Rest of Asia Pacific Procurement Analytics System Revenue (undefined) Forecast, by Application 2020 & 2033
Frequently Asked Questions
1. What is the projected Compound Annual Growth Rate (CAGR) of the Procurement Analytics System?
The projected CAGR is approximately 9.2%.
2. Which companies are prominent players in the Procurement Analytics System?
Key companies in the market include SAP, Oracle, SAS Institute, Coupa Software, Genpact, Rosslyn Data Technologies, Microsoft, IBM, Cisco, GEP.
3. What are the main segments of the Procurement Analytics System?
The market segments include Application, Types.
4. Can you provide details about the market size?
The market size is estimated to be USD XXX N/A as of 2022.
5. What are some drivers contributing to market growth?
N/A
6. What are the notable trends driving market growth?
N/A
7. Are there any restraints impacting market growth?
N/A
8. Can you provide examples of recent developments in the market?
N/A
9. What pricing options are available for accessing the report?
Pricing options include single-user, multi-user, and enterprise licenses priced at USD 3350.00, USD 5025.00, and USD 6700.00 respectively.
10. Is the market size provided in terms of value or volume?
The market size is provided in terms of value, measured in N/A.
11. Are there any specific market keywords associated with the report?
Yes, the market keyword associated with the report is "Procurement Analytics System," which aids in identifying and referencing the specific market segment covered.
12. How do I determine which pricing option suits my needs best?
The pricing options vary based on user requirements and access needs. Individual users may opt for single-user licenses, while businesses requiring broader access may choose multi-user or enterprise licenses for cost-effective access to the report.
13. Are there any additional resources or data provided in the Procurement Analytics System report?
While the report offers comprehensive insights, it's advisable to review the specific contents or supplementary materials provided to ascertain if additional resources or data are available.
14. How can I stay updated on further developments or reports in the Procurement Analytics System?
To stay informed about further developments, trends, and reports in the Procurement Analytics System, consider subscribing to industry newsletters, following relevant companies and organizations, or regularly checking reputable industry news sources and publications.
Methodology
Step 1 - Identification of Relevant Samples Size from Population Database


Step 2 - Approaches for Defining Global Market Size (Value, Volume* & Price*)

Note*: In applicable scenarios
Step 3 - Data Sources
Primary Research
- Web Analytics
- Survey Reports
- Research Institute
- Latest Research Reports
- Opinion Leaders
Secondary Research
- Annual Reports
- White Paper
- Latest Press Release
- Industry Association
- Paid Database
- Investor Presentations

Step 4 - Data Triangulation
Involves using different sources of information in order to increase the validity of a study
These sources are likely to be stakeholders in a program - participants, other researchers, program staff, other community members, and so on.
Then we put all data in single framework & apply various statistical tools to find out the dynamic on the market.
During the analysis stage, feedback from the stakeholder groups would be compared to determine areas of agreement as well as areas of divergence