

Key Insights
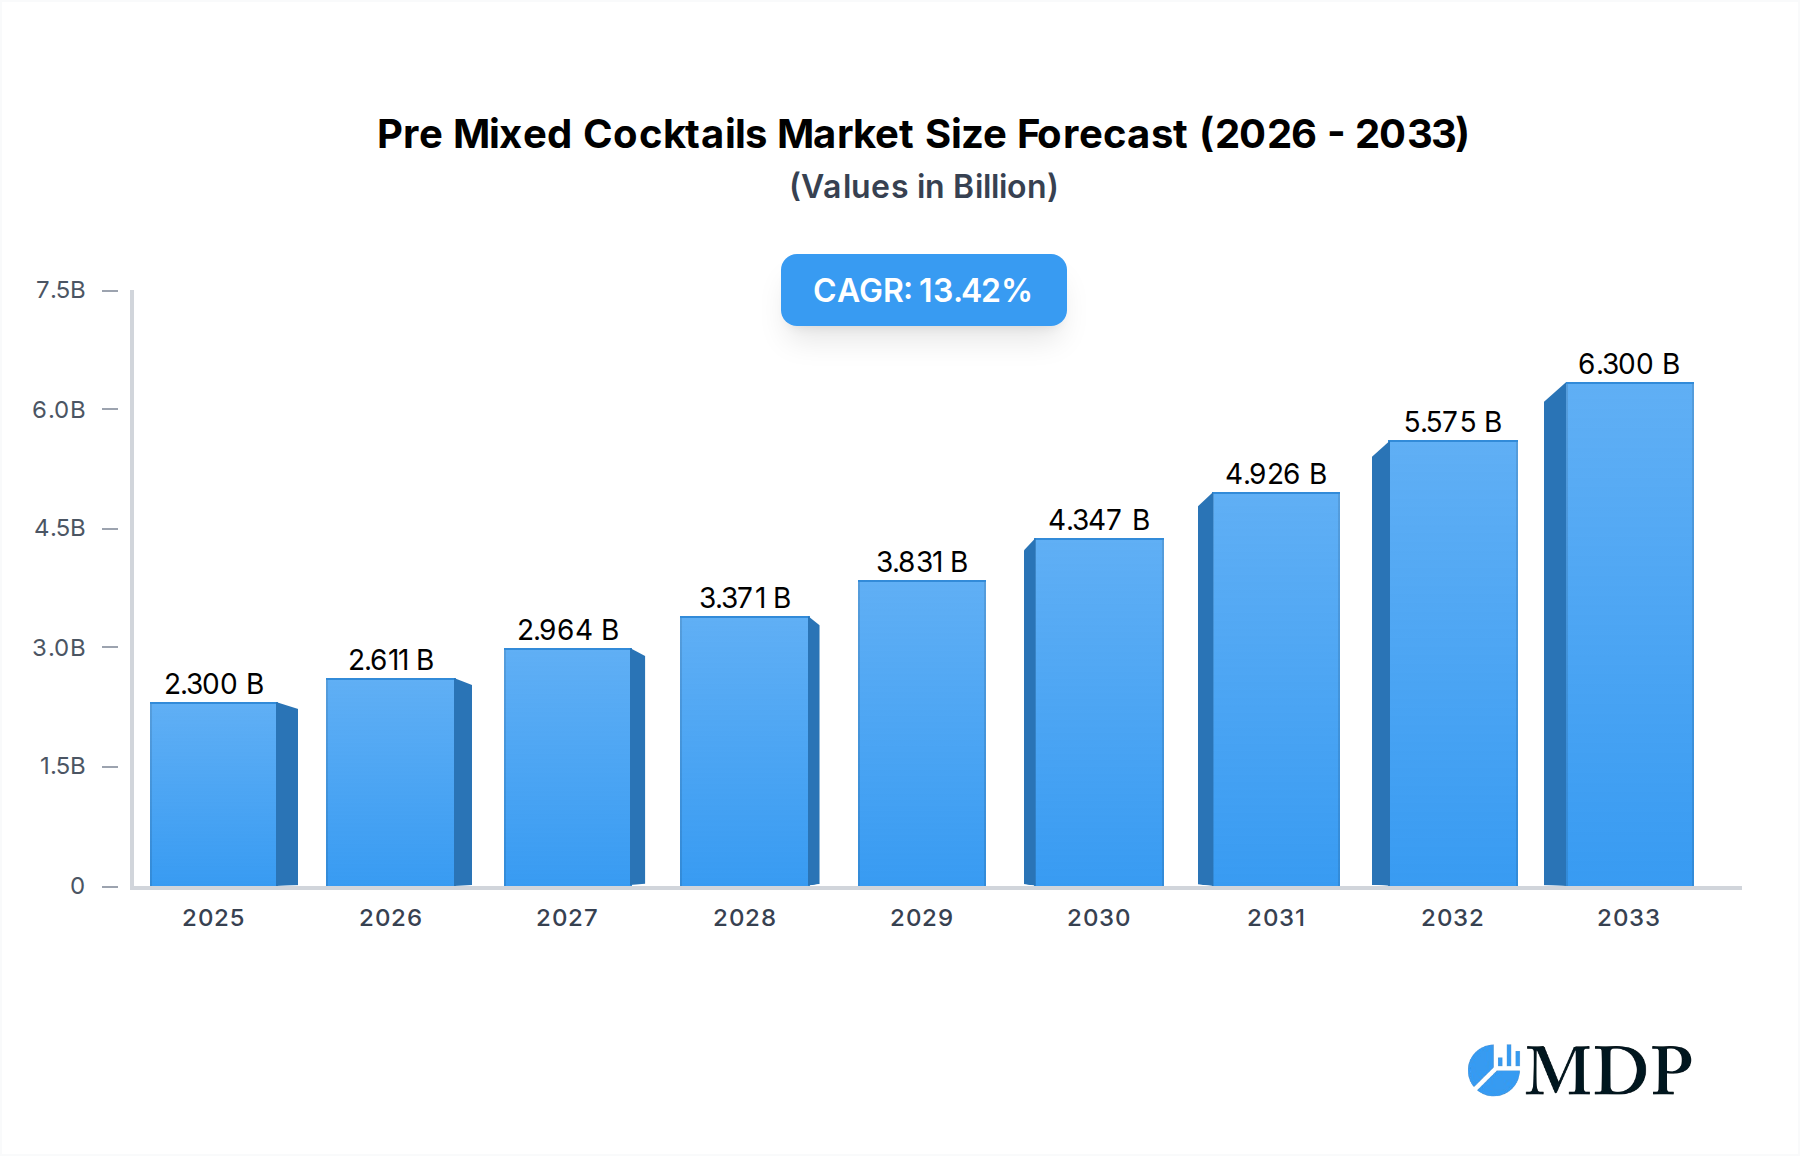
The global Pre-Mixed Cocktails market is poised for significant expansion, with an estimated market size of $2.3 billion in 2025. This robust growth is fueled by a projected Compound Annual Growth Rate (CAGR) of 13.7% through 2033. Consumers are increasingly seeking convenience and sophisticated drinking experiences at home, driving demand for expertly crafted pre-mixed beverages. The market is witnessing a strong preference for ready-to-drink (RTD) options across various formats, including cans and bottles, catering to both single servings and larger social gatherings. Key growth segments within this market include premixed cocktails for wine, spirits, and malt-based beverages, reflecting a diverse consumer palate. Major industry players like Bacardi Limited, Diageo Plc, and Anheuser-Busch InBev are actively innovating and expanding their product portfolios to capture this burgeoning market share.

Pre Mixed Cocktails Market Size (In Billion)
The expansion of the pre-mixed cocktail market is further propelled by evolving consumer lifestyles, particularly among millennials and Gen Z, who prioritize convenience and readily accessible premium beverages. The proliferation of online retail channels and the growing popularity of at-home entertaining have created a fertile ground for RTD cocktails. While market growth is strong, potential restraints could include evolving regulatory landscapes concerning alcohol sales and marketing, as well as the potential for intense price competition as more brands enter the market. However, the overarching trend of premiumization, coupled with innovative flavor profiles and sustainable packaging, is expected to outweigh these challenges, ensuring continued robust growth across North America, Europe, and the rapidly expanding Asia Pacific region.
Pre Mixed Cocktails Company Market Share
Unleash the Future of Convenient Indulgence: The Pre Mixed Cocktails Market Report
This comprehensive report provides an in-depth analysis of the global pre-mixed cocktails market, a rapidly expanding sector driven by evolving consumer lifestyles and demand for convenience. Covering the study period of 2019–2033, with a base year of 2025 and a forecast period of 2025–2033, this report offers unparalleled insights into market dynamics, growth drivers, leading segments, and key players. Dive into actionable intelligence crucial for industry stakeholders, including beverage manufacturers, retailers, investors, and market analysts. This report is poised to become your definitive guide to navigating and capitalizing on the burgeoning pre-mixed cocktails industry.
Pre Mixed Cocktails Market Dynamics & Concentration
The global pre-mixed cocktails market exhibits a dynamic and evolving concentration landscape. Innovation remains a primary driver, with manufacturers consistently introducing novel flavor profiles and healthier formulations to cater to diverse consumer preferences. Regulatory frameworks, while generally supportive, vary by region, influencing product development and distribution strategies. Product substitutes, such as traditional ready-to-drink (RTD) beverages and DIY cocktail ingredients, present a competitive challenge, yet the inherent convenience and consistent quality of pre-mixed options continue to drive their appeal. End-user trends strongly favor on-the-go consumption, social gatherings, and at-home entertaining, with a growing demand for premium and craft-style offerings. Mergers and acquisitions (M&A) activity is a significant indicator of market consolidation and strategic expansion. While specific M&A deal counts are not provided, the presence of major global players suggests ongoing strategic alliances and acquisitions aimed at expanding market share and product portfolios. The market share distribution reflects a blend of established beverage giants and agile, niche brands.
Pre Mixed Cocktails Industry Trends & Analysis
The pre-mixed cocktails industry is experiencing robust growth, fueled by a confluence of powerful market growth drivers. A significant CAGR of approximately 7.5% is projected over the forecast period, indicating sustained expansion. Market penetration is steadily increasing, driven by a growing consumer preference for convenience, sophisticated taste profiles, and reduced preparation time. Technological disruptions are playing a crucial role, with advancements in packaging ensuring product freshness and extending shelf life, while innovative formulation techniques allow for a wider array of complex and appealing flavors. Consumer preferences are increasingly shifting towards premiumization, with demand for craft-quality ingredients, unique flavor combinations, and visually appealing packaging. Health and wellness trends are also influencing product development, leading to a rise in lower-sugar, lower-calorie, and natural ingredient-based pre-mixed cocktails. Competitive dynamics are intensifying, characterized by product differentiation, aggressive marketing campaigns, and strategic partnerships. The accessibility and affordability of pre-mixed cocktails, especially for consumers seeking bar-quality experiences at home, are also significant contributors to market growth. The rise of e-commerce and direct-to-consumer (DTC) sales channels further amplifies market reach and consumer engagement.
Leading Markets & Segments in Pre Mixed Cocktails
North America currently stands as the dominant region for pre-mixed cocktails, propelled by a high disposable income, a well-established culture of social drinking, and a strong consumer inclination towards convenience. Within North America, the United States leads in market penetration due to a vast consumer base and a highly receptive market for innovative beverage products.
Application Segment Dominance:
- Cans: The cans segment is experiencing exceptional growth, driven by their portability, sustainability, and superior preservation qualities. Key drivers include their suitability for outdoor events, festivals, and on-the-go consumption. Economic policies promoting single-use packaging convenience and infrastructure supporting widespread distribution of canned beverages further bolster this segment's dominance.
- Bottles: While cans are gaining rapid traction, bottles continue to hold a significant market share, particularly for premium and larger format offerings. Consumer preference for the aesthetic appeal and perceived quality associated with glass bottles, coupled with their suitability for gifting and home entertaining, contribute to their sustained presence.
Type Segment Dominance:
- Spirit-Based: Spirit-based pre-mixed cocktails are leading the market. This dominance is attributed to the broad appeal of popular spirits like vodka, gin, rum, and whiskey, which form the foundation for a wide array of classic and contemporary cocktails. The ability to replicate complex spirit-forward drinks with consistent quality in a pre-mixed format is a key driver.
- Wine-Based: Wine-based pre-mixed cocktails are also carving out a substantial niche, particularly in regions with strong wine consumption traditions. Their appeal lies in their refreshing nature and suitability for lighter occasions.
- Malt-Based: Malt-based pre-mixed cocktails, often flavored and positioned as alternatives to traditional beers, are gaining traction among younger demographics seeking novel taste experiences.
The growth of these leading segments is further influenced by favorable tax regulations on certain alcohol types, robust retail infrastructure, and effective marketing strategies that highlight the convenience and quality of these offerings.
Pre Mixed Cocktails Product Developments
Product innovation in the pre-mixed cocktails market is characterized by a relentless pursuit of novel flavor profiles and ingredient quality. Manufacturers are increasingly focusing on craft-inspired recipes, premium spirits, and natural ingredients to meet evolving consumer demands. Technological advancements in preservation and packaging ensure optimal taste and extended shelf life, enhancing the consumer experience. Competitive advantages are being gained through unique flavor combinations, limited-edition releases, and the development of healthier options, such as lower-sugar and lower-alcohol variants. The market is witnessing a rise in RTD versions of popular classic cocktails and the introduction of entirely new, imaginative concoctions, catering to a sophisticated palate seeking convenience without compromise.
Key Drivers of Pre Mixed Cocktails Growth
The pre-mixed cocktails market is propelled by several key drivers. Technological advancements in formulation and packaging ensure consistent quality and extended shelf life. Economic factors, including rising disposable incomes and a preference for value-for-money, make pre-mixed options an attractive alternative to bar purchases. Regulatory frameworks that permit easier market entry and distribution for alcoholic beverages contribute to growth. Furthermore, evolving consumer lifestyles emphasizing convenience, social gatherings, and at-home entertaining are paramount. For instance, the widespread adoption of ready-to-drink (RTD) formats for other beverages has paved the way for pre-mixed cocktails to gain significant traction.
Challenges in the Pre Mixed Cocktails Market
Despite its strong growth, the pre-mixed cocktails market faces several challenges. Regulatory hurdles, including strict licensing laws and advertising restrictions across different jurisdictions, can impede market expansion. Supply chain complexities, particularly concerning the sourcing of premium ingredients and ensuring product integrity during transit, present ongoing concerns. Intense competitive pressures from established beverage giants and emerging craft brands necessitate continuous innovation and effective marketing strategies. Quantifiable impacts include potential delays in product launches and increased operational costs due to compliance and logistical challenges.
Emerging Opportunities in Pre Mixed Cocktails
Catalysts driving long-term growth in the pre-mixed cocktails market are abundant. Technological breakthroughs in sustainable packaging and advanced flavor encapsulation are set to enhance product appeal and reduce environmental impact. Strategic partnerships between spirit producers and beverage manufacturers can lead to innovative co-branded offerings and expanded distribution networks. Market expansion strategies, particularly targeting emerging economies with growing middle classes and increasing disposable incomes, present significant untapped potential. Furthermore, the growing consumer interest in low-alcohol and no-alcohol (NA) options opens avenues for developing sophisticated NA pre-mixed cocktails.
Leading Players in the Pre Mixed Cocktails Sector
- Bacardi Limited
- Diageo Plc
- Brown –Forman
- Halewood Wines & Spirits
- Asahi Group Holdings, Ltd.
- Anheuser-Busch InBev
- Pernod Richard
- Manchester Drinks Company Ltd.
- Shanghai Bacchus Liquor Co.,Ltd.
Key Milestones in Pre Mixed Cocktails Industry
- 2019: Increased consumer adoption of RTD beverages, laying groundwork for pre-mixed cocktail growth.
- 2020: Surge in at-home consumption during global lockdowns, significantly boosting sales of convenient alcoholic beverages.
- 2021: Introduction of more premium and craft-inspired pre-mixed cocktail lines by major players.
- 2022: Growing consumer demand for healthier options, leading to the launch of lower-sugar and lower-calorie pre-mixed cocktails.
- 2023: Expansion of e-commerce and DTC sales channels, enhancing accessibility for consumers.
- 2024: Increased focus on sustainable packaging and eco-friendly production methods within the industry.
Strategic Outlook for Pre Mixed Cocktails Market
The strategic outlook for the pre-mixed cocktails market is exceptionally positive, with continued growth anticipated. Key accelerators include further product innovation focused on health-conscious consumers and unique flavor profiles, alongside the expansion of distribution into untapped geographical markets. The increasing acceptance of RTD formats across demographics and the ongoing trend towards convenience-driven consumption will fuel market expansion. Strategic opportunities lie in developing advanced e-commerce capabilities, forming partnerships with hospitality sectors, and capitalizing on the burgeoning demand for premium, ready-to-enjoy cocktail experiences. The future of this market is bright, offering substantial potential for both established and emerging brands.
Pre Mixed Cocktails Segmentation
-
1. Application
- 1.1. Cans
- 1.2. Bottles
-
2. Type
- 2.1. Wine
- 2.2. Spirit
- 2.3. Malt-Based
Pre Mixed Cocktails Segmentation By Geography
-
1. North America
- 1.1. United States
- 1.2. Canada
- 1.3. Mexico
-
2. South America
- 2.1. Brazil
- 2.2. Argentina
- 2.3. Rest of South America
-
3. Europe
- 3.1. United Kingdom
- 3.2. Germany
- 3.3. France
- 3.4. Italy
- 3.5. Spain
- 3.6. Russia
- 3.7. Benelux
- 3.8. Nordics
- 3.9. Rest of Europe
-
4. Middle East & Africa
- 4.1. Turkey
- 4.2. Israel
- 4.3. GCC
- 4.4. North Africa
- 4.5. South Africa
- 4.6. Rest of Middle East & Africa
-
5. Asia Pacific
- 5.1. China
- 5.2. India
- 5.3. Japan
- 5.4. South Korea
- 5.5. ASEAN
- 5.6. Oceania
- 5.7. Rest of Asia Pacific
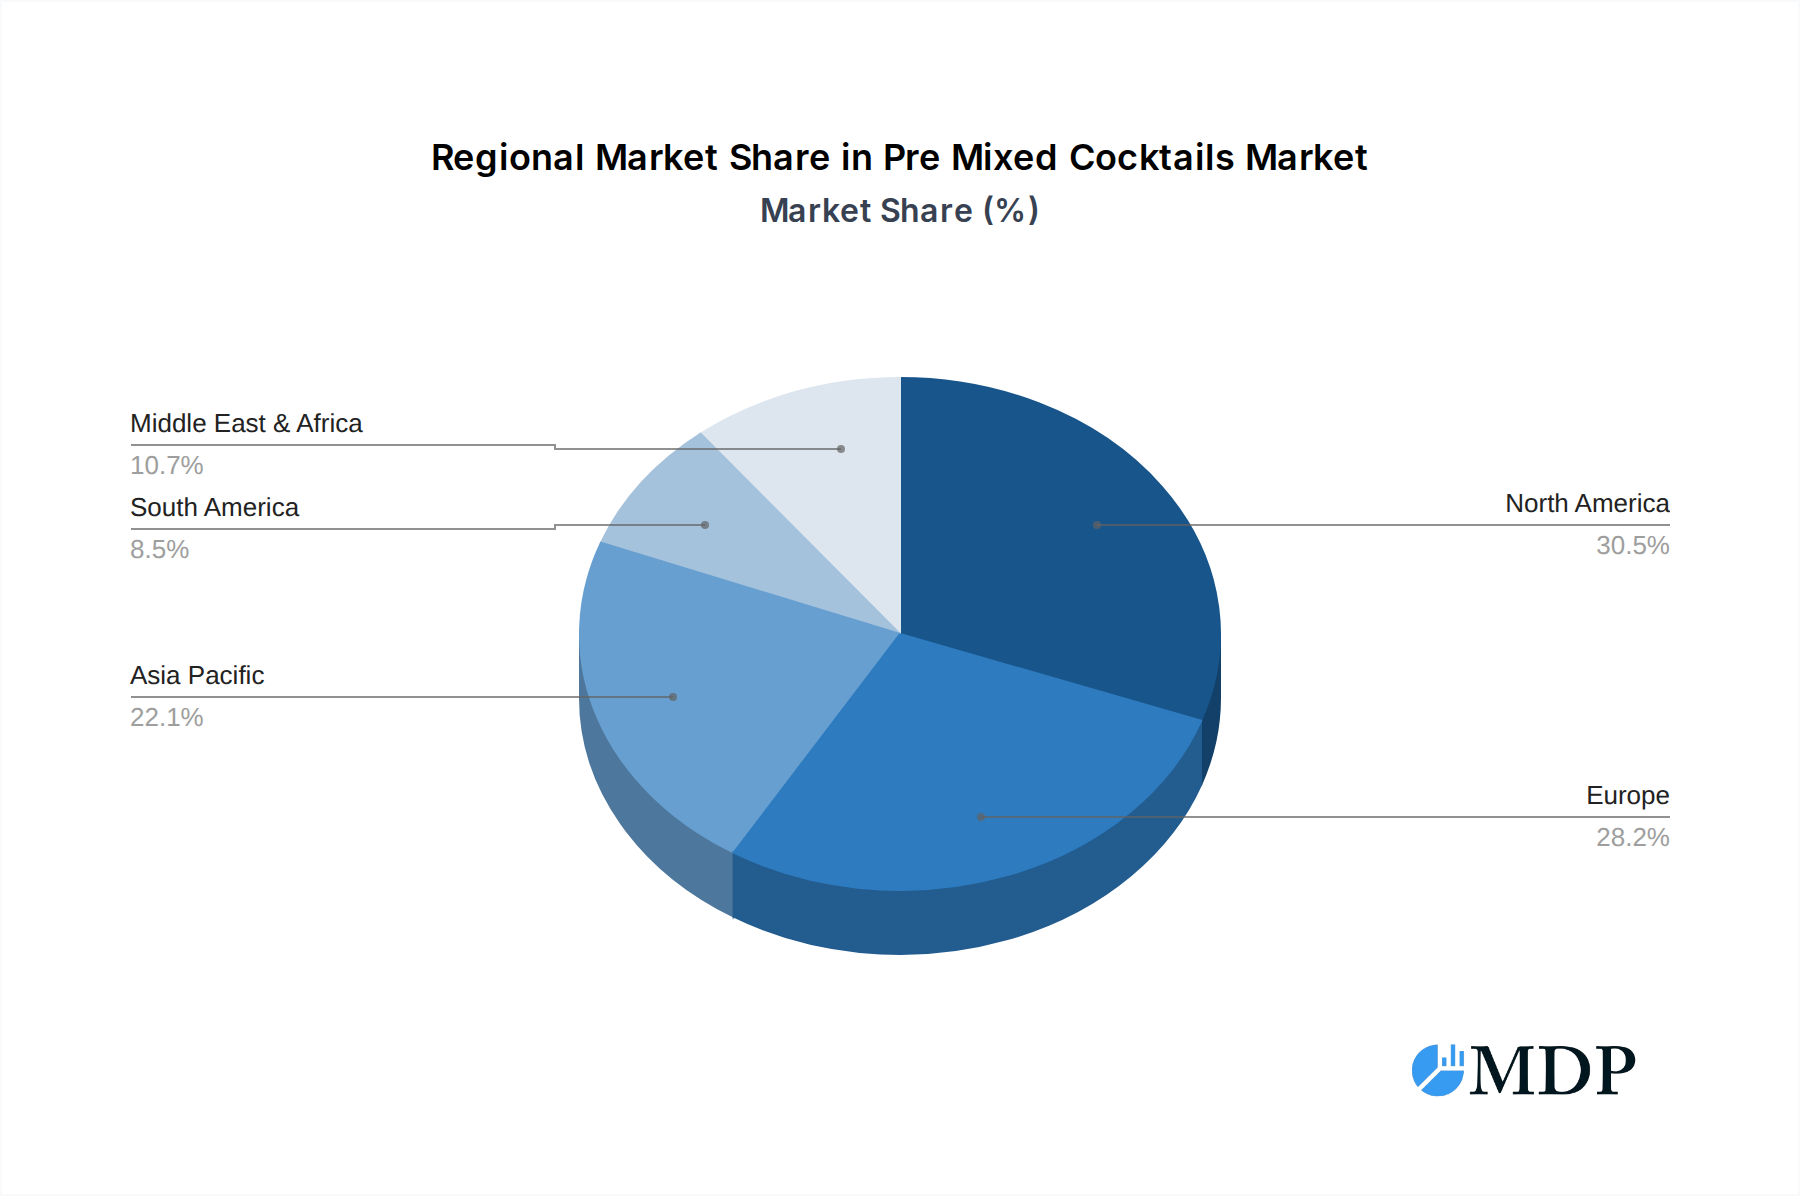
Pre Mixed Cocktails Regional Market Share
Geographic Coverage of Pre Mixed Cocktails
Pre Mixed Cocktails REPORT HIGHLIGHTS
| Aspects | Details |
|---|---|
| Study Period | 2020-2034 |
| Base Year | 2025 |
| Estimated Year | 2026 |
| Forecast Period | 2026-2034 |
| Historical Period | 2020-2025 |
| Growth Rate | CAGR of 13.7% from 2020-2034 |
| Segmentation |
|
Table of Contents
- 1. Introduction
- 1.1. Research Scope
- 1.2. Market Segmentation
- 1.3. Research Methodology
- 1.4. Definitions and Assumptions
- 2. Executive Summary
- 2.1. Introduction
- 3. Market Dynamics
- 3.1. Introduction
- 3.2. Market Drivers
- 3.3. Market Restrains
- 3.4. Market Trends
- 4. Market Factor Analysis
- 4.1. Porters Five Forces
- 4.2. Supply/Value Chain
- 4.3. PESTEL analysis
- 4.4. Market Entropy
- 4.5. Patent/Trademark Analysis
- 5. Global Pre Mixed Cocktails Analysis, Insights and Forecast, 2020-2032
- 5.1. Market Analysis, Insights and Forecast - by Application
- 5.1.1. Cans
- 5.1.2. Bottles
- 5.2. Market Analysis, Insights and Forecast - by Type
- 5.2.1. Wine
- 5.2.2. Spirit
- 5.2.3. Malt-Based
- 5.3. Market Analysis, Insights and Forecast - by Region
- 5.3.1. North America
- 5.3.2. South America
- 5.3.3. Europe
- 5.3.4. Middle East & Africa
- 5.3.5. Asia Pacific
- 5.1. Market Analysis, Insights and Forecast - by Application
- 6. North America Pre Mixed Cocktails Analysis, Insights and Forecast, 2020-2032
- 6.1. Market Analysis, Insights and Forecast - by Application
- 6.1.1. Cans
- 6.1.2. Bottles
- 6.2. Market Analysis, Insights and Forecast - by Type
- 6.2.1. Wine
- 6.2.2. Spirit
- 6.2.3. Malt-Based
- 6.1. Market Analysis, Insights and Forecast - by Application
- 7. South America Pre Mixed Cocktails Analysis, Insights and Forecast, 2020-2032
- 7.1. Market Analysis, Insights and Forecast - by Application
- 7.1.1. Cans
- 7.1.2. Bottles
- 7.2. Market Analysis, Insights and Forecast - by Type
- 7.2.1. Wine
- 7.2.2. Spirit
- 7.2.3. Malt-Based
- 7.1. Market Analysis, Insights and Forecast - by Application
- 8. Europe Pre Mixed Cocktails Analysis, Insights and Forecast, 2020-2032
- 8.1. Market Analysis, Insights and Forecast - by Application
- 8.1.1. Cans
- 8.1.2. Bottles
- 8.2. Market Analysis, Insights and Forecast - by Type
- 8.2.1. Wine
- 8.2.2. Spirit
- 8.2.3. Malt-Based
- 8.1. Market Analysis, Insights and Forecast - by Application
- 9. Middle East & Africa Pre Mixed Cocktails Analysis, Insights and Forecast, 2020-2032
- 9.1. Market Analysis, Insights and Forecast - by Application
- 9.1.1. Cans
- 9.1.2. Bottles
- 9.2. Market Analysis, Insights and Forecast - by Type
- 9.2.1. Wine
- 9.2.2. Spirit
- 9.2.3. Malt-Based
- 9.1. Market Analysis, Insights and Forecast - by Application
- 10. Asia Pacific Pre Mixed Cocktails Analysis, Insights and Forecast, 2020-2032
- 10.1. Market Analysis, Insights and Forecast - by Application
- 10.1.1. Cans
- 10.1.2. Bottles
- 10.2. Market Analysis, Insights and Forecast - by Type
- 10.2.1. Wine
- 10.2.2. Spirit
- 10.2.3. Malt-Based
- 10.1. Market Analysis, Insights and Forecast - by Application
- 11. Competitive Analysis
- 11.1. Global Market Share Analysis 2025
- 11.2. Company Profiles
- 11.2.1 Bacardi Limited
- 11.2.1.1. Overview
- 11.2.1.2. Products
- 11.2.1.3. SWOT Analysis
- 11.2.1.4. Recent Developments
- 11.2.1.5. Financials (Based on Availability)
- 11.2.2 Diageo Plc
- 11.2.2.1. Overview
- 11.2.2.2. Products
- 11.2.2.3. SWOT Analysis
- 11.2.2.4. Recent Developments
- 11.2.2.5. Financials (Based on Availability)
- 11.2.3 Brown –Forman
- 11.2.3.1. Overview
- 11.2.3.2. Products
- 11.2.3.3. SWOT Analysis
- 11.2.3.4. Recent Developments
- 11.2.3.5. Financials (Based on Availability)
- 11.2.4 Halewood Wines & Spirits
- 11.2.4.1. Overview
- 11.2.4.2. Products
- 11.2.4.3. SWOT Analysis
- 11.2.4.4. Recent Developments
- 11.2.4.5. Financials (Based on Availability)
- 11.2.5 Asahi Group Holdings
- 11.2.5.1. Overview
- 11.2.5.2. Products
- 11.2.5.3. SWOT Analysis
- 11.2.5.4. Recent Developments
- 11.2.5.5. Financials (Based on Availability)
- 11.2.6 Ltd.
- 11.2.6.1. Overview
- 11.2.6.2. Products
- 11.2.6.3. SWOT Analysis
- 11.2.6.4. Recent Developments
- 11.2.6.5. Financials (Based on Availability)
- 11.2.7 Anheuser-Busch InBev
- 11.2.7.1. Overview
- 11.2.7.2. Products
- 11.2.7.3. SWOT Analysis
- 11.2.7.4. Recent Developments
- 11.2.7.5. Financials (Based on Availability)
- 11.2.8 Pernod Richard
- 11.2.8.1. Overview
- 11.2.8.2. Products
- 11.2.8.3. SWOT Analysis
- 11.2.8.4. Recent Developments
- 11.2.8.5. Financials (Based on Availability)
- 11.2.9 Manchester Drinks Company Ltd.
- 11.2.9.1. Overview
- 11.2.9.2. Products
- 11.2.9.3. SWOT Analysis
- 11.2.9.4. Recent Developments
- 11.2.9.5. Financials (Based on Availability)
- 11.2.10 Shanghai Bacchus Liquor Co.
- 11.2.10.1. Overview
- 11.2.10.2. Products
- 11.2.10.3. SWOT Analysis
- 11.2.10.4. Recent Developments
- 11.2.10.5. Financials (Based on Availability)
- 11.2.11 Ltd.
- 11.2.11.1. Overview
- 11.2.11.2. Products
- 11.2.11.3. SWOT Analysis
- 11.2.11.4. Recent Developments
- 11.2.11.5. Financials (Based on Availability)
- 11.2.1 Bacardi Limited
List of Figures
- Figure 1: Global Pre Mixed Cocktails Revenue Breakdown (undefined, %) by Region 2025 & 2033
- Figure 2: Global Pre Mixed Cocktails Volume Breakdown (K, %) by Region 2025 & 2033
- Figure 3: North America Pre Mixed Cocktails Revenue (undefined), by Application 2025 & 2033
- Figure 4: North America Pre Mixed Cocktails Volume (K), by Application 2025 & 2033
- Figure 5: North America Pre Mixed Cocktails Revenue Share (%), by Application 2025 & 2033
- Figure 6: North America Pre Mixed Cocktails Volume Share (%), by Application 2025 & 2033
- Figure 7: North America Pre Mixed Cocktails Revenue (undefined), by Type 2025 & 2033
- Figure 8: North America Pre Mixed Cocktails Volume (K), by Type 2025 & 2033
- Figure 9: North America Pre Mixed Cocktails Revenue Share (%), by Type 2025 & 2033
- Figure 10: North America Pre Mixed Cocktails Volume Share (%), by Type 2025 & 2033
- Figure 11: North America Pre Mixed Cocktails Revenue (undefined), by Country 2025 & 2033
- Figure 12: North America Pre Mixed Cocktails Volume (K), by Country 2025 & 2033
- Figure 13: North America Pre Mixed Cocktails Revenue Share (%), by Country 2025 & 2033
- Figure 14: North America Pre Mixed Cocktails Volume Share (%), by Country 2025 & 2033
- Figure 15: South America Pre Mixed Cocktails Revenue (undefined), by Application 2025 & 2033
- Figure 16: South America Pre Mixed Cocktails Volume (K), by Application 2025 & 2033
- Figure 17: South America Pre Mixed Cocktails Revenue Share (%), by Application 2025 & 2033
- Figure 18: South America Pre Mixed Cocktails Volume Share (%), by Application 2025 & 2033
- Figure 19: South America Pre Mixed Cocktails Revenue (undefined), by Type 2025 & 2033
- Figure 20: South America Pre Mixed Cocktails Volume (K), by Type 2025 & 2033
- Figure 21: South America Pre Mixed Cocktails Revenue Share (%), by Type 2025 & 2033
- Figure 22: South America Pre Mixed Cocktails Volume Share (%), by Type 2025 & 2033
- Figure 23: South America Pre Mixed Cocktails Revenue (undefined), by Country 2025 & 2033
- Figure 24: South America Pre Mixed Cocktails Volume (K), by Country 2025 & 2033
- Figure 25: South America Pre Mixed Cocktails Revenue Share (%), by Country 2025 & 2033
- Figure 26: South America Pre Mixed Cocktails Volume Share (%), by Country 2025 & 2033
- Figure 27: Europe Pre Mixed Cocktails Revenue (undefined), by Application 2025 & 2033
- Figure 28: Europe Pre Mixed Cocktails Volume (K), by Application 2025 & 2033
- Figure 29: Europe Pre Mixed Cocktails Revenue Share (%), by Application 2025 & 2033
- Figure 30: Europe Pre Mixed Cocktails Volume Share (%), by Application 2025 & 2033
- Figure 31: Europe Pre Mixed Cocktails Revenue (undefined), by Type 2025 & 2033
- Figure 32: Europe Pre Mixed Cocktails Volume (K), by Type 2025 & 2033
- Figure 33: Europe Pre Mixed Cocktails Revenue Share (%), by Type 2025 & 2033
- Figure 34: Europe Pre Mixed Cocktails Volume Share (%), by Type 2025 & 2033
- Figure 35: Europe Pre Mixed Cocktails Revenue (undefined), by Country 2025 & 2033
- Figure 36: Europe Pre Mixed Cocktails Volume (K), by Country 2025 & 2033
- Figure 37: Europe Pre Mixed Cocktails Revenue Share (%), by Country 2025 & 2033
- Figure 38: Europe Pre Mixed Cocktails Volume Share (%), by Country 2025 & 2033
- Figure 39: Middle East & Africa Pre Mixed Cocktails Revenue (undefined), by Application 2025 & 2033
- Figure 40: Middle East & Africa Pre Mixed Cocktails Volume (K), by Application 2025 & 2033
- Figure 41: Middle East & Africa Pre Mixed Cocktails Revenue Share (%), by Application 2025 & 2033
- Figure 42: Middle East & Africa Pre Mixed Cocktails Volume Share (%), by Application 2025 & 2033
- Figure 43: Middle East & Africa Pre Mixed Cocktails Revenue (undefined), by Type 2025 & 2033
- Figure 44: Middle East & Africa Pre Mixed Cocktails Volume (K), by Type 2025 & 2033
- Figure 45: Middle East & Africa Pre Mixed Cocktails Revenue Share (%), by Type 2025 & 2033
- Figure 46: Middle East & Africa Pre Mixed Cocktails Volume Share (%), by Type 2025 & 2033
- Figure 47: Middle East & Africa Pre Mixed Cocktails Revenue (undefined), by Country 2025 & 2033
- Figure 48: Middle East & Africa Pre Mixed Cocktails Volume (K), by Country 2025 & 2033
- Figure 49: Middle East & Africa Pre Mixed Cocktails Revenue Share (%), by Country 2025 & 2033
- Figure 50: Middle East & Africa Pre Mixed Cocktails Volume Share (%), by Country 2025 & 2033
- Figure 51: Asia Pacific Pre Mixed Cocktails Revenue (undefined), by Application 2025 & 2033
- Figure 52: Asia Pacific Pre Mixed Cocktails Volume (K), by Application 2025 & 2033
- Figure 53: Asia Pacific Pre Mixed Cocktails Revenue Share (%), by Application 2025 & 2033
- Figure 54: Asia Pacific Pre Mixed Cocktails Volume Share (%), by Application 2025 & 2033
- Figure 55: Asia Pacific Pre Mixed Cocktails Revenue (undefined), by Type 2025 & 2033
- Figure 56: Asia Pacific Pre Mixed Cocktails Volume (K), by Type 2025 & 2033
- Figure 57: Asia Pacific Pre Mixed Cocktails Revenue Share (%), by Type 2025 & 2033
- Figure 58: Asia Pacific Pre Mixed Cocktails Volume Share (%), by Type 2025 & 2033
- Figure 59: Asia Pacific Pre Mixed Cocktails Revenue (undefined), by Country 2025 & 2033
- Figure 60: Asia Pacific Pre Mixed Cocktails Volume (K), by Country 2025 & 2033
- Figure 61: Asia Pacific Pre Mixed Cocktails Revenue Share (%), by Country 2025 & 2033
- Figure 62: Asia Pacific Pre Mixed Cocktails Volume Share (%), by Country 2025 & 2033
List of Tables
- Table 1: Global Pre Mixed Cocktails Revenue undefined Forecast, by Application 2020 & 2033
- Table 2: Global Pre Mixed Cocktails Volume K Forecast, by Application 2020 & 2033
- Table 3: Global Pre Mixed Cocktails Revenue undefined Forecast, by Type 2020 & 2033
- Table 4: Global Pre Mixed Cocktails Volume K Forecast, by Type 2020 & 2033
- Table 5: Global Pre Mixed Cocktails Revenue undefined Forecast, by Region 2020 & 2033
- Table 6: Global Pre Mixed Cocktails Volume K Forecast, by Region 2020 & 2033
- Table 7: Global Pre Mixed Cocktails Revenue undefined Forecast, by Application 2020 & 2033
- Table 8: Global Pre Mixed Cocktails Volume K Forecast, by Application 2020 & 2033
- Table 9: Global Pre Mixed Cocktails Revenue undefined Forecast, by Type 2020 & 2033
- Table 10: Global Pre Mixed Cocktails Volume K Forecast, by Type 2020 & 2033
- Table 11: Global Pre Mixed Cocktails Revenue undefined Forecast, by Country 2020 & 2033
- Table 12: Global Pre Mixed Cocktails Volume K Forecast, by Country 2020 & 2033
- Table 13: United States Pre Mixed Cocktails Revenue (undefined) Forecast, by Application 2020 & 2033
- Table 14: United States Pre Mixed Cocktails Volume (K) Forecast, by Application 2020 & 2033
- Table 15: Canada Pre Mixed Cocktails Revenue (undefined) Forecast, by Application 2020 & 2033
- Table 16: Canada Pre Mixed Cocktails Volume (K) Forecast, by Application 2020 & 2033
- Table 17: Mexico Pre Mixed Cocktails Revenue (undefined) Forecast, by Application 2020 & 2033
- Table 18: Mexico Pre Mixed Cocktails Volume (K) Forecast, by Application 2020 & 2033
- Table 19: Global Pre Mixed Cocktails Revenue undefined Forecast, by Application 2020 & 2033
- Table 20: Global Pre Mixed Cocktails Volume K Forecast, by Application 2020 & 2033
- Table 21: Global Pre Mixed Cocktails Revenue undefined Forecast, by Type 2020 & 2033
- Table 22: Global Pre Mixed Cocktails Volume K Forecast, by Type 2020 & 2033
- Table 23: Global Pre Mixed Cocktails Revenue undefined Forecast, by Country 2020 & 2033
- Table 24: Global Pre Mixed Cocktails Volume K Forecast, by Country 2020 & 2033
- Table 25: Brazil Pre Mixed Cocktails Revenue (undefined) Forecast, by Application 2020 & 2033
- Table 26: Brazil Pre Mixed Cocktails Volume (K) Forecast, by Application 2020 & 2033
- Table 27: Argentina Pre Mixed Cocktails Revenue (undefined) Forecast, by Application 2020 & 2033
- Table 28: Argentina Pre Mixed Cocktails Volume (K) Forecast, by Application 2020 & 2033
- Table 29: Rest of South America Pre Mixed Cocktails Revenue (undefined) Forecast, by Application 2020 & 2033
- Table 30: Rest of South America Pre Mixed Cocktails Volume (K) Forecast, by Application 2020 & 2033
- Table 31: Global Pre Mixed Cocktails Revenue undefined Forecast, by Application 2020 & 2033
- Table 32: Global Pre Mixed Cocktails Volume K Forecast, by Application 2020 & 2033
- Table 33: Global Pre Mixed Cocktails Revenue undefined Forecast, by Type 2020 & 2033
- Table 34: Global Pre Mixed Cocktails Volume K Forecast, by Type 2020 & 2033
- Table 35: Global Pre Mixed Cocktails Revenue undefined Forecast, by Country 2020 & 2033
- Table 36: Global Pre Mixed Cocktails Volume K Forecast, by Country 2020 & 2033
- Table 37: United Kingdom Pre Mixed Cocktails Revenue (undefined) Forecast, by Application 2020 & 2033
- Table 38: United Kingdom Pre Mixed Cocktails Volume (K) Forecast, by Application 2020 & 2033
- Table 39: Germany Pre Mixed Cocktails Revenue (undefined) Forecast, by Application 2020 & 2033
- Table 40: Germany Pre Mixed Cocktails Volume (K) Forecast, by Application 2020 & 2033
- Table 41: France Pre Mixed Cocktails Revenue (undefined) Forecast, by Application 2020 & 2033
- Table 42: France Pre Mixed Cocktails Volume (K) Forecast, by Application 2020 & 2033
- Table 43: Italy Pre Mixed Cocktails Revenue (undefined) Forecast, by Application 2020 & 2033
- Table 44: Italy Pre Mixed Cocktails Volume (K) Forecast, by Application 2020 & 2033
- Table 45: Spain Pre Mixed Cocktails Revenue (undefined) Forecast, by Application 2020 & 2033
- Table 46: Spain Pre Mixed Cocktails Volume (K) Forecast, by Application 2020 & 2033
- Table 47: Russia Pre Mixed Cocktails Revenue (undefined) Forecast, by Application 2020 & 2033
- Table 48: Russia Pre Mixed Cocktails Volume (K) Forecast, by Application 2020 & 2033
- Table 49: Benelux Pre Mixed Cocktails Revenue (undefined) Forecast, by Application 2020 & 2033
- Table 50: Benelux Pre Mixed Cocktails Volume (K) Forecast, by Application 2020 & 2033
- Table 51: Nordics Pre Mixed Cocktails Revenue (undefined) Forecast, by Application 2020 & 2033
- Table 52: Nordics Pre Mixed Cocktails Volume (K) Forecast, by Application 2020 & 2033
- Table 53: Rest of Europe Pre Mixed Cocktails Revenue (undefined) Forecast, by Application 2020 & 2033
- Table 54: Rest of Europe Pre Mixed Cocktails Volume (K) Forecast, by Application 2020 & 2033
- Table 55: Global Pre Mixed Cocktails Revenue undefined Forecast, by Application 2020 & 2033
- Table 56: Global Pre Mixed Cocktails Volume K Forecast, by Application 2020 & 2033
- Table 57: Global Pre Mixed Cocktails Revenue undefined Forecast, by Type 2020 & 2033
- Table 58: Global Pre Mixed Cocktails Volume K Forecast, by Type 2020 & 2033
- Table 59: Global Pre Mixed Cocktails Revenue undefined Forecast, by Country 2020 & 2033
- Table 60: Global Pre Mixed Cocktails Volume K Forecast, by Country 2020 & 2033
- Table 61: Turkey Pre Mixed Cocktails Revenue (undefined) Forecast, by Application 2020 & 2033
- Table 62: Turkey Pre Mixed Cocktails Volume (K) Forecast, by Application 2020 & 2033
- Table 63: Israel Pre Mixed Cocktails Revenue (undefined) Forecast, by Application 2020 & 2033
- Table 64: Israel Pre Mixed Cocktails Volume (K) Forecast, by Application 2020 & 2033
- Table 65: GCC Pre Mixed Cocktails Revenue (undefined) Forecast, by Application 2020 & 2033
- Table 66: GCC Pre Mixed Cocktails Volume (K) Forecast, by Application 2020 & 2033
- Table 67: North Africa Pre Mixed Cocktails Revenue (undefined) Forecast, by Application 2020 & 2033
- Table 68: North Africa Pre Mixed Cocktails Volume (K) Forecast, by Application 2020 & 2033
- Table 69: South Africa Pre Mixed Cocktails Revenue (undefined) Forecast, by Application 2020 & 2033
- Table 70: South Africa Pre Mixed Cocktails Volume (K) Forecast, by Application 2020 & 2033
- Table 71: Rest of Middle East & Africa Pre Mixed Cocktails Revenue (undefined) Forecast, by Application 2020 & 2033
- Table 72: Rest of Middle East & Africa Pre Mixed Cocktails Volume (K) Forecast, by Application 2020 & 2033
- Table 73: Global Pre Mixed Cocktails Revenue undefined Forecast, by Application 2020 & 2033
- Table 74: Global Pre Mixed Cocktails Volume K Forecast, by Application 2020 & 2033
- Table 75: Global Pre Mixed Cocktails Revenue undefined Forecast, by Type 2020 & 2033
- Table 76: Global Pre Mixed Cocktails Volume K Forecast, by Type 2020 & 2033
- Table 77: Global Pre Mixed Cocktails Revenue undefined Forecast, by Country 2020 & 2033
- Table 78: Global Pre Mixed Cocktails Volume K Forecast, by Country 2020 & 2033
- Table 79: China Pre Mixed Cocktails Revenue (undefined) Forecast, by Application 2020 & 2033
- Table 80: China Pre Mixed Cocktails Volume (K) Forecast, by Application 2020 & 2033
- Table 81: India Pre Mixed Cocktails Revenue (undefined) Forecast, by Application 2020 & 2033
- Table 82: India Pre Mixed Cocktails Volume (K) Forecast, by Application 2020 & 2033
- Table 83: Japan Pre Mixed Cocktails Revenue (undefined) Forecast, by Application 2020 & 2033
- Table 84: Japan Pre Mixed Cocktails Volume (K) Forecast, by Application 2020 & 2033
- Table 85: South Korea Pre Mixed Cocktails Revenue (undefined) Forecast, by Application 2020 & 2033
- Table 86: South Korea Pre Mixed Cocktails Volume (K) Forecast, by Application 2020 & 2033
- Table 87: ASEAN Pre Mixed Cocktails Revenue (undefined) Forecast, by Application 2020 & 2033
- Table 88: ASEAN Pre Mixed Cocktails Volume (K) Forecast, by Application 2020 & 2033
- Table 89: Oceania Pre Mixed Cocktails Revenue (undefined) Forecast, by Application 2020 & 2033
- Table 90: Oceania Pre Mixed Cocktails Volume (K) Forecast, by Application 2020 & 2033
- Table 91: Rest of Asia Pacific Pre Mixed Cocktails Revenue (undefined) Forecast, by Application 2020 & 2033
- Table 92: Rest of Asia Pacific Pre Mixed Cocktails Volume (K) Forecast, by Application 2020 & 2033
Frequently Asked Questions
1. What is the projected Compound Annual Growth Rate (CAGR) of the Pre Mixed Cocktails?
The projected CAGR is approximately 13.7%.
2. Which companies are prominent players in the Pre Mixed Cocktails?
Key companies in the market include Bacardi Limited, Diageo Plc, Brown –Forman, Halewood Wines & Spirits, Asahi Group Holdings, Ltd., Anheuser-Busch InBev, Pernod Richard, Manchester Drinks Company Ltd., Shanghai Bacchus Liquor Co., Ltd..
3. What are the main segments of the Pre Mixed Cocktails?
The market segments include Application, Type.
4. Can you provide details about the market size?
The market size is estimated to be USD XXX N/A as of 2022.
5. What are some drivers contributing to market growth?
N/A
6. What are the notable trends driving market growth?
N/A
7. Are there any restraints impacting market growth?
N/A
8. Can you provide examples of recent developments in the market?
N/A
9. What pricing options are available for accessing the report?
Pricing options include single-user, multi-user, and enterprise licenses priced at USD 3950.00, USD 5925.00, and USD 7900.00 respectively.
10. Is the market size provided in terms of value or volume?
The market size is provided in terms of value, measured in N/A and volume, measured in K.
11. Are there any specific market keywords associated with the report?
Yes, the market keyword associated with the report is "Pre Mixed Cocktails," which aids in identifying and referencing the specific market segment covered.
12. How do I determine which pricing option suits my needs best?
The pricing options vary based on user requirements and access needs. Individual users may opt for single-user licenses, while businesses requiring broader access may choose multi-user or enterprise licenses for cost-effective access to the report.
13. Are there any additional resources or data provided in the Pre Mixed Cocktails report?
While the report offers comprehensive insights, it's advisable to review the specific contents or supplementary materials provided to ascertain if additional resources or data are available.
14. How can I stay updated on further developments or reports in the Pre Mixed Cocktails?
To stay informed about further developments, trends, and reports in the Pre Mixed Cocktails, consider subscribing to industry newsletters, following relevant companies and organizations, or regularly checking reputable industry news sources and publications.
Methodology
Step 1 - Identification of Relevant Samples Size from Population Database


Step 2 - Approaches for Defining Global Market Size (Value, Volume* & Price*)

Note*: In applicable scenarios
Step 3 - Data Sources
Primary Research
- Web Analytics
- Survey Reports
- Research Institute
- Latest Research Reports
- Opinion Leaders
Secondary Research
- Annual Reports
- White Paper
- Latest Press Release
- Industry Association
- Paid Database
- Investor Presentations

Step 4 - Data Triangulation
Involves using different sources of information in order to increase the validity of a study
These sources are likely to be stakeholders in a program - participants, other researchers, program staff, other community members, and so on.
Then we put all data in single framework & apply various statistical tools to find out the dynamic on the market.
During the analysis stage, feedback from the stakeholder groups would be compared to determine areas of agreement as well as areas of divergence