

Key Insights
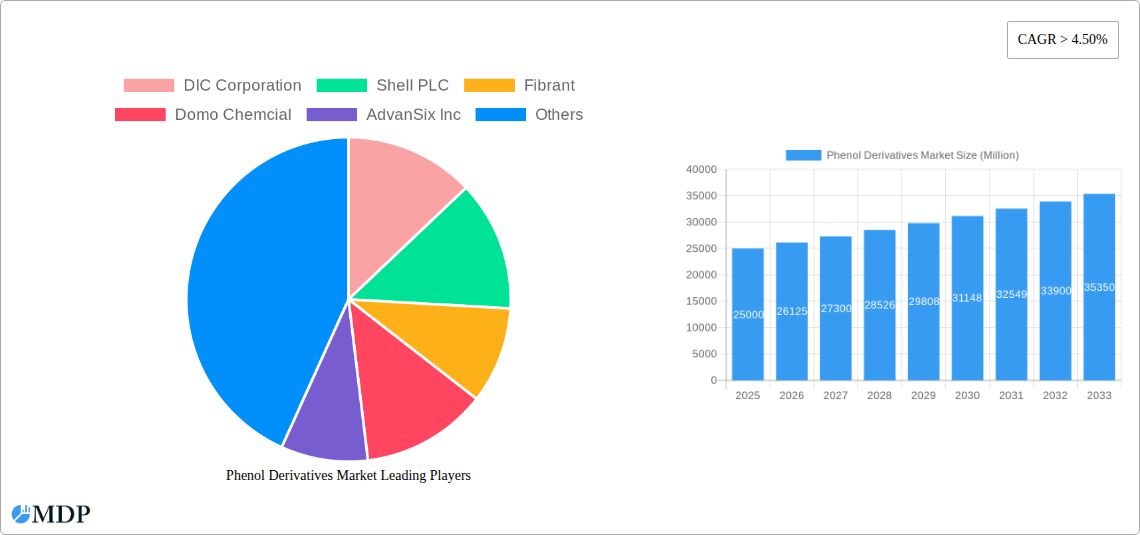
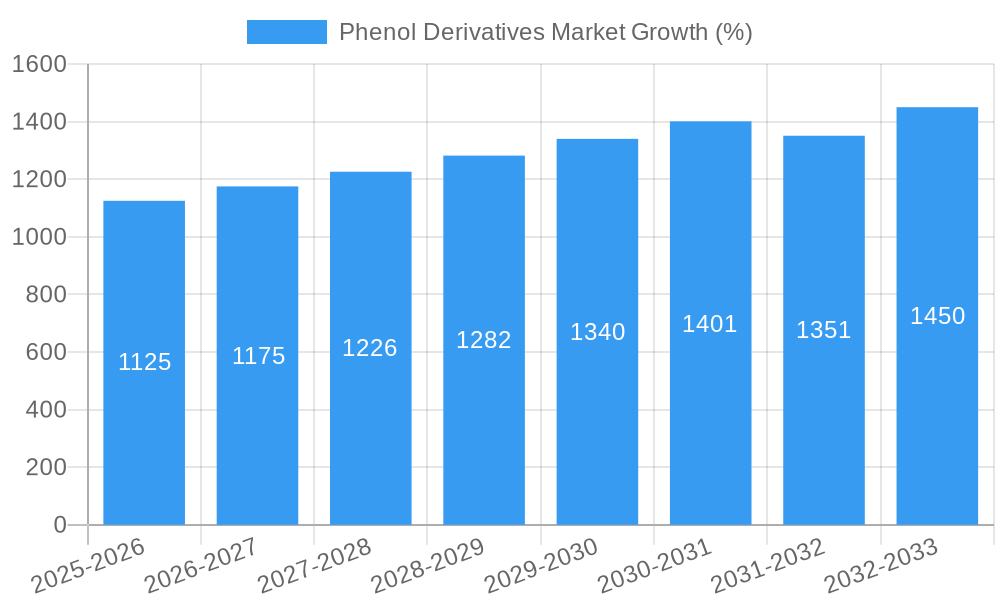
The Phenol Derivatives market is experiencing robust growth, projected to maintain a CAGR exceeding 4.50% from 2025 to 2033. This expansion is fueled by several key factors. Firstly, the increasing demand for bisphenol-A, a crucial component in polycarbonate plastics used extensively in various industries like automotive, electronics, and packaging, is a significant driver. Furthermore, the growing applications of phenolic resins in construction, adhesives, and coatings are contributing to market expansion. The rising production of caprolactam and adipic acid, vital precursors for nylon 6 and nylon 6,6 respectively, further bolsters market growth. These materials find extensive use in textiles, automotive parts, and packaging. Finally, the continuous innovation and development of new applications for phenol derivatives across diverse sectors are expected to propel market expansion throughout the forecast period.
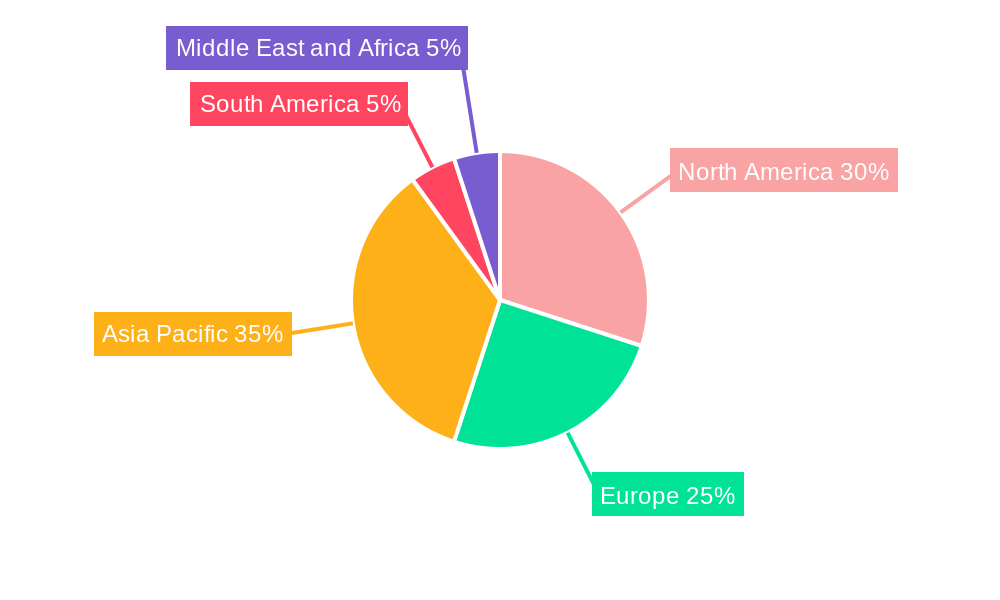
However, certain challenges exist. Fluctuations in raw material prices, particularly phenol, can impact the profitability of phenol derivative manufacturers. Additionally, stringent environmental regulations regarding the production and disposal of certain phenol derivatives pose a constraint. Despite these factors, the market is segmented by various derivatives (Bisphenol-A, Phenolic Resin, Caprolactam, Adipic Acid, and Others), with Bisphenol-A and Phenolic Resin currently dominating the market share. The geographical distribution shows significant activity across Asia Pacific (driven primarily by China and India), North America, and Europe, with emerging markets in South America and the Middle East & Africa showing potential for future growth. Leading players such as DIC Corporation, Shell PLC, BASF SE, and INEOS Capital Ltd. are actively shaping the market through strategic investments, expansions, and technological advancements. The market's future growth trajectory remains optimistic, driven by continuous innovation, growing applications, and strategic expansion by key players.
Phenol Derivatives Market: A Comprehensive Report (2019-2033)
This in-depth report provides a comprehensive analysis of the Phenol Derivatives market, offering valuable insights for industry stakeholders, investors, and strategic decision-makers. Spanning the period from 2019 to 2033 (historical period: 2019-2024; base year: 2025; forecast period: 2025-2033), this report meticulously examines market dynamics, trends, leading players, and future growth prospects. The market is projected to reach xx Million by 2033, exhibiting a robust CAGR of xx% during the forecast period.
Phenol Derivatives Market Dynamics & Concentration
The Phenol Derivatives market is characterized by a moderate level of concentration, with key players holding significant market share. The market's competitive landscape is shaped by factors such as innovation, stringent regulatory frameworks, the availability of substitute products, evolving end-user trends, and ongoing mergers and acquisitions (M&A) activities.
- Market Concentration: The top 5 players account for approximately xx% of the global market share in 2025. This concentration is expected to slightly shift by 2033 due to anticipated M&A activities and the emergence of new players.
- Innovation Drivers: Continuous research and development efforts focused on sustainable and bio-based phenol derivatives are driving innovation. The development of high-performance materials and specialized applications is another key driver.
- Regulatory Frameworks: Environmental regulations concerning emissions and waste disposal are influencing manufacturing processes and product formulations. Stringent safety standards are impacting market dynamics.
- Product Substitutes: The availability of alternative materials, such as bio-based polymers and recycled materials, poses a competitive challenge to traditional phenol derivatives. However, the superior properties of phenol derivatives in many applications ensure sustained demand.
- End-User Trends: Growing demand from key end-use sectors, including automotive, construction, electronics, and packaging, is fueling market growth. Shifts in consumer preferences towards sustainable and eco-friendly products are also shaping market trends.
- M&A Activities: The number of M&A deals in the Phenol Derivatives market has increased in recent years, driven by companies seeking to expand their product portfolio, enhance their market presence, and gain access to new technologies. An estimated xx M&A deals were recorded between 2019 and 2024.
Phenol Derivatives Market Industry Trends & Analysis
The Phenol Derivatives market is experiencing significant growth, driven by several factors. Technological advancements are improving the efficiency and sustainability of production processes. Consumer preferences for high-performance, eco-friendly products are also driving demand. The automotive industry, a major consumer of phenol derivatives, is experiencing rapid growth globally, further boosting market expansion. Intense competition among market players is leading to continuous innovation and cost optimization strategies. The market's growth trajectory is influenced by shifts in supply chain dynamics, economic fluctuations, and governmental policies.
The global market size, valued at xx Million in 2025, is poised for significant expansion, with a projected CAGR of xx% between 2025 and 2033. Market penetration rates vary across different regions and applications, with higher penetration in developed economies and established end-use sectors. Technological disruptions, such as the adoption of bio-based feedstocks, are reshaping the market landscape.
Leading Markets & Segments in Phenol Derivatives Market
The Asia-Pacific region currently dominates the Phenol Derivatives market, driven by robust economic growth, rapid industrialization, and expanding construction and automotive sectors. China and India are particularly important markets within this region.
- By Derivatives:
- Bisphenol-A: The Bisphenol-A segment holds a significant share of the market, driven by its extensive use in polycarbonate plastics and epoxy resins. Strong demand from the construction and automotive industries is a key growth driver.
- Phenolic Resin: The Phenolic Resin segment demonstrates consistent growth, fueled by its applications in the manufacturing of adhesives, laminates, and molded components.
- Caprolactam: The Caprolactam segment exhibits steady growth, driven by its importance in the production of nylon fibers and plastics.
- Adipic Acid: The Adipic Acid segment displays stable growth, owing to its critical role in the production of nylon polymers.
- Other Derivatives: This segment encompasses a variety of phenol derivatives with niche applications, contributing to the overall market diversity.
Key Drivers for Dominance:
- Asia-Pacific: Rapid economic expansion, supportive government policies, burgeoning infrastructure development, and a strong manufacturing sector.
- China and India: Large population base, growing middle class, rising disposable incomes, and substantial investments in industrial capacity.
- Bisphenol-A: Widespread application in high-demand sectors such as construction and automotive, leading to high consumption volumes.
Phenol Derivatives Market Product Developments
Recent product innovations have focused on developing more sustainable, high-performance phenol derivatives. For example, the introduction of bio-attributed phenol products represents a significant step towards reducing reliance on fossil fuels. New applications are continually being explored, expanding the market's reach into various industries. These developments offer significant competitive advantages to manufacturers who can offer superior products with enhanced properties and reduced environmental impact.
Key Drivers of Phenol Derivatives Market Growth
The Phenol Derivatives market's growth is propelled by several factors, including increasing demand from end-use industries, particularly automotive and construction. Technological advancements such as the development of bio-based phenol derivatives are enhancing sustainability. Furthermore, favorable government policies supporting the chemical industry contribute to market expansion. Finally, the growing use of phenol derivatives in high-growth sectors such as electronics and packaging will sustain long-term growth.
Challenges in the Phenol Derivatives Market
The Phenol Derivatives market faces challenges such as stringent environmental regulations impacting production costs and sustainability concerns. Supply chain disruptions can create volatility in raw material prices and availability. The market also faces competitive pressure from substitute materials and alternative technologies. These challenges require ongoing innovation and adaptation to mitigate their impact on market growth. For example, increased raw material costs may result in a xx% increase in production costs by 2030.
Emerging Opportunities in Phenol Derivatives Market
Emerging opportunities lie in developing sustainable and bio-based phenol derivatives, tapping into the growing demand for environmentally friendly materials. Strategic partnerships and collaborations within the value chain can facilitate market expansion and access to new technologies. Market penetration in emerging economies offers significant growth potential. Technological breakthroughs, such as improved synthesis methods and advanced applications, will further drive market expansion.
Leading Players in the Phenol Derivatives Market Sector
- DIC Corporation
- Shell PLC
- Fibrant
- Domo Chemical
- AdvanSix Inc
- Cepsa
- Altivia
- BASF SE
- INEOS Capital Ltd
- Fujian Yongrong Jinjiang Co Ltd
- PTT Phenol Company Limited
- Solvay SA
- Mitsubishi Chemical Corporation
- Mitsui Chemicals Inc
Key Milestones in Phenol Derivatives Market Industry
- June 2022: INEOS Phenol launched its first bio-attributed product line for phenol, acetone, and alpha-methylstyrene at its Gladbeck, Germany, and Antwerp, Belgium sites, sold under the INVIRIDIS brand. This marks a significant step towards sustainable production.
- August 2022: A new bisphenol-A production facility opened in Pune, India. This facility is expected to reduce India's reliance on imports (1.35 lakh tons annually from the US and China), boosting domestic manufacturing and potentially impacting import/export dynamics.
Strategic Outlook for Phenol Derivatives Market
The Phenol Derivatives market presents significant growth potential driven by technological advancements, evolving consumer preferences, and expanding end-use applications. Strategic partnerships, investments in R&D, and expansion into emerging markets will be key to capitalizing on this potential. Companies focused on sustainability and innovation will be best positioned to capture market share in the long term. The increasing adoption of bio-based alternatives and the focus on circular economy models will shape the future trajectory of the market.
Phenol Derivatives Market Segmentation
-
1. Derivatives
- 1.1. Bisphenol-A
- 1.2. Phenolic Resin
- 1.3. Caprolactam
- 1.4. Adipic Acid
- 1.5. Other Derivatives
Phenol Derivatives Market Segmentation By Geography
-
1. Asia Pacific
- 1.1. China
- 1.2. India
- 1.3. Japan
- 1.4. South Korea
- 1.5. Rest of Asia Pacific
-
2. North America
- 2.1. United States
- 2.2. Canada
- 2.3. Mexico
-
3. Europe
- 3.1. Germany
- 3.2. France
- 3.3. United Kingdom
- 3.4. Italy
- 3.5. Rest of the Europe
-
4. South America
- 4.1. Brazil
- 4.2. Argentina
- 4.3. Rest of South America
-
5. Middle East and Africa
- 5.1. Saudi Arabia
- 5.2. South Africa
- 5.3. Rest of Middle East and Africa
Phenol Derivatives Market REPORT HIGHLIGHTS
| Aspects | Details |
|---|---|
| Study Period | 2019-2033 |
| Base Year | 2024 |
| Estimated Year | 2025 |
| Forecast Period | 2025-2033 |
| Historical Period | 2019-2024 |
| Growth Rate | CAGR of > 4.50% from 2019-2033 |
| Segmentation |
|
Table of Contents
- 1. Introduction
- 1.1. Research Scope
- 1.2. Market Segmentation
- 1.3. Research Methodology
- 1.4. Definitions and Assumptions
- 2. Executive Summary
- 2.1. Introduction
- 3. Market Dynamics
- 3.1. Introduction
- 3.2. Market Drivers
- 3.2.1 Growing Demand from the Pharmaceutical Industry; Increasing Use of Phenol Derivatives in the Production of Agrochemicals
- 3.2.2 Dyes
- 3.2.3 and Other Specialty Chemicals.
- 3.3. Market Restrains
- 3.3.1. Stringent Environmental Regulations; Volatility in Raw Material Prices
- 3.4. Market Trends
- 3.4.1. Soaring Demand for Phenolic Resin
- 4. Market Factor Analysis
- 4.1. Porters Five Forces
- 4.2. Supply/Value Chain
- 4.3. PESTEL analysis
- 4.4. Market Entropy
- 4.5. Patent/Trademark Analysis
- 5. Global Phenol Derivatives Market Analysis, Insights and Forecast, 2019-2031
- 5.1. Market Analysis, Insights and Forecast - by Derivatives
- 5.1.1. Bisphenol-A
- 5.1.2. Phenolic Resin
- 5.1.3. Caprolactam
- 5.1.4. Adipic Acid
- 5.1.5. Other Derivatives
- 5.2. Market Analysis, Insights and Forecast - by Region
- 5.2.1. Asia Pacific
- 5.2.2. North America
- 5.2.3. Europe
- 5.2.4. South America
- 5.2.5. Middle East and Africa
- 5.1. Market Analysis, Insights and Forecast - by Derivatives
- 6. Asia Pacific Phenol Derivatives Market Analysis, Insights and Forecast, 2019-2031
- 6.1. Market Analysis, Insights and Forecast - by Derivatives
- 6.1.1. Bisphenol-A
- 6.1.2. Phenolic Resin
- 6.1.3. Caprolactam
- 6.1.4. Adipic Acid
- 6.1.5. Other Derivatives
- 6.1. Market Analysis, Insights and Forecast - by Derivatives
- 7. North America Phenol Derivatives Market Analysis, Insights and Forecast, 2019-2031
- 7.1. Market Analysis, Insights and Forecast - by Derivatives
- 7.1.1. Bisphenol-A
- 7.1.2. Phenolic Resin
- 7.1.3. Caprolactam
- 7.1.4. Adipic Acid
- 7.1.5. Other Derivatives
- 7.1. Market Analysis, Insights and Forecast - by Derivatives
- 8. Europe Phenol Derivatives Market Analysis, Insights and Forecast, 2019-2031
- 8.1. Market Analysis, Insights and Forecast - by Derivatives
- 8.1.1. Bisphenol-A
- 8.1.2. Phenolic Resin
- 8.1.3. Caprolactam
- 8.1.4. Adipic Acid
- 8.1.5. Other Derivatives
- 8.1. Market Analysis, Insights and Forecast - by Derivatives
- 9. South America Phenol Derivatives Market Analysis, Insights and Forecast, 2019-2031
- 9.1. Market Analysis, Insights and Forecast - by Derivatives
- 9.1.1. Bisphenol-A
- 9.1.2. Phenolic Resin
- 9.1.3. Caprolactam
- 9.1.4. Adipic Acid
- 9.1.5. Other Derivatives
- 9.1. Market Analysis, Insights and Forecast - by Derivatives
- 10. Middle East and Africa Phenol Derivatives Market Analysis, Insights and Forecast, 2019-2031
- 10.1. Market Analysis, Insights and Forecast - by Derivatives
- 10.1.1. Bisphenol-A
- 10.1.2. Phenolic Resin
- 10.1.3. Caprolactam
- 10.1.4. Adipic Acid
- 10.1.5. Other Derivatives
- 10.1. Market Analysis, Insights and Forecast - by Derivatives
- 11. Asia Pacific Phenol Derivatives Market Analysis, Insights and Forecast, 2019-2031
- 11.1. Market Analysis, Insights and Forecast - By Country/Sub-region
- 11.1.1 China
- 11.1.2 India
- 11.1.3 Japan
- 11.1.4 South Korea
- 11.1.5 Rest of Asia Pacific
- 12. North America Phenol Derivatives Market Analysis, Insights and Forecast, 2019-2031
- 12.1. Market Analysis, Insights and Forecast - By Country/Sub-region
- 12.1.1 United States
- 12.1.2 Canada
- 12.1.3 Mexico
- 13. Europe Phenol Derivatives Market Analysis, Insights and Forecast, 2019-2031
- 13.1. Market Analysis, Insights and Forecast - By Country/Sub-region
- 13.1.1 Germany
- 13.1.2 France
- 13.1.3 United Kingdom
- 13.1.4 Italy
- 13.1.5 Rest of the Europe
- 14. South America Phenol Derivatives Market Analysis, Insights and Forecast, 2019-2031
- 14.1. Market Analysis, Insights and Forecast - By Country/Sub-region
- 14.1.1 Brazil
- 14.1.2 Argentina
- 14.1.3 Rest of South America
- 15. Middle East and Africa Phenol Derivatives Market Analysis, Insights and Forecast, 2019-2031
- 15.1. Market Analysis, Insights and Forecast - By Country/Sub-region
- 15.1.1 Saudi Arabia
- 15.1.2 South Africa
- 15.1.3 Rest of Middle East and Africa
- 16. Competitive Analysis
- 16.1. Global Market Share Analysis 2024
- 16.2. Company Profiles
- 16.2.1 DIC Corporation
- 16.2.1.1. Overview
- 16.2.1.2. Products
- 16.2.1.3. SWOT Analysis
- 16.2.1.4. Recent Developments
- 16.2.1.5. Financials (Based on Availability)
- 16.2.2 Shell PLC
- 16.2.2.1. Overview
- 16.2.2.2. Products
- 16.2.2.3. SWOT Analysis
- 16.2.2.4. Recent Developments
- 16.2.2.5. Financials (Based on Availability)
- 16.2.3 Fibrant
- 16.2.3.1. Overview
- 16.2.3.2. Products
- 16.2.3.3. SWOT Analysis
- 16.2.3.4. Recent Developments
- 16.2.3.5. Financials (Based on Availability)
- 16.2.4 Domo Chemcial
- 16.2.4.1. Overview
- 16.2.4.2. Products
- 16.2.4.3. SWOT Analysis
- 16.2.4.4. Recent Developments
- 16.2.4.5. Financials (Based on Availability)
- 16.2.5 AdvanSix Inc
- 16.2.5.1. Overview
- 16.2.5.2. Products
- 16.2.5.3. SWOT Analysis
- 16.2.5.4. Recent Developments
- 16.2.5.5. Financials (Based on Availability)
- 16.2.6 Cepsa
- 16.2.6.1. Overview
- 16.2.6.2. Products
- 16.2.6.3. SWOT Analysis
- 16.2.6.4. Recent Developments
- 16.2.6.5. Financials (Based on Availability)
- 16.2.7 Altivia
- 16.2.7.1. Overview
- 16.2.7.2. Products
- 16.2.7.3. SWOT Analysis
- 16.2.7.4. Recent Developments
- 16.2.7.5. Financials (Based on Availability)
- 16.2.8 BASF SE
- 16.2.8.1. Overview
- 16.2.8.2. Products
- 16.2.8.3. SWOT Analysis
- 16.2.8.4. Recent Developments
- 16.2.8.5. Financials (Based on Availability)
- 16.2.9 INEOS Capital Ltd
- 16.2.9.1. Overview
- 16.2.9.2. Products
- 16.2.9.3. SWOT Analysis
- 16.2.9.4. Recent Developments
- 16.2.9.5. Financials (Based on Availability)
- 16.2.10 Fujian Yongrong Jinjiang Co Ltd
- 16.2.10.1. Overview
- 16.2.10.2. Products
- 16.2.10.3. SWOT Analysis
- 16.2.10.4. Recent Developments
- 16.2.10.5. Financials (Based on Availability)
- 16.2.11 PTT Phenol Company Limited
- 16.2.11.1. Overview
- 16.2.11.2. Products
- 16.2.11.3. SWOT Analysis
- 16.2.11.4. Recent Developments
- 16.2.11.5. Financials (Based on Availability)
- 16.2.12 Solvay SA*List Not Exhaustive
- 16.2.12.1. Overview
- 16.2.12.2. Products
- 16.2.12.3. SWOT Analysis
- 16.2.12.4. Recent Developments
- 16.2.12.5. Financials (Based on Availability)
- 16.2.13 Mitsubishi Chemcial Corporation
- 16.2.13.1. Overview
- 16.2.13.2. Products
- 16.2.13.3. SWOT Analysis
- 16.2.13.4. Recent Developments
- 16.2.13.5. Financials (Based on Availability)
- 16.2.14 Mitsui Chemcials Inc
- 16.2.14.1. Overview
- 16.2.14.2. Products
- 16.2.14.3. SWOT Analysis
- 16.2.14.4. Recent Developments
- 16.2.14.5. Financials (Based on Availability)
- 16.2.1 DIC Corporation
List of Figures
- Figure 1: Global Phenol Derivatives Market Revenue Breakdown (Million, %) by Region 2024 & 2032
- Figure 2: Asia Pacific Phenol Derivatives Market Revenue (Million), by Country 2024 & 2032
- Figure 3: Asia Pacific Phenol Derivatives Market Revenue Share (%), by Country 2024 & 2032
- Figure 4: North America Phenol Derivatives Market Revenue (Million), by Country 2024 & 2032
- Figure 5: North America Phenol Derivatives Market Revenue Share (%), by Country 2024 & 2032
- Figure 6: Europe Phenol Derivatives Market Revenue (Million), by Country 2024 & 2032
- Figure 7: Europe Phenol Derivatives Market Revenue Share (%), by Country 2024 & 2032
- Figure 8: South America Phenol Derivatives Market Revenue (Million), by Country 2024 & 2032
- Figure 9: South America Phenol Derivatives Market Revenue Share (%), by Country 2024 & 2032
- Figure 10: Middle East and Africa Phenol Derivatives Market Revenue (Million), by Country 2024 & 2032
- Figure 11: Middle East and Africa Phenol Derivatives Market Revenue Share (%), by Country 2024 & 2032
- Figure 12: Asia Pacific Phenol Derivatives Market Revenue (Million), by Derivatives 2024 & 2032
- Figure 13: Asia Pacific Phenol Derivatives Market Revenue Share (%), by Derivatives 2024 & 2032
- Figure 14: Asia Pacific Phenol Derivatives Market Revenue (Million), by Country 2024 & 2032
- Figure 15: Asia Pacific Phenol Derivatives Market Revenue Share (%), by Country 2024 & 2032
- Figure 16: North America Phenol Derivatives Market Revenue (Million), by Derivatives 2024 & 2032
- Figure 17: North America Phenol Derivatives Market Revenue Share (%), by Derivatives 2024 & 2032
- Figure 18: North America Phenol Derivatives Market Revenue (Million), by Country 2024 & 2032
- Figure 19: North America Phenol Derivatives Market Revenue Share (%), by Country 2024 & 2032
- Figure 20: Europe Phenol Derivatives Market Revenue (Million), by Derivatives 2024 & 2032
- Figure 21: Europe Phenol Derivatives Market Revenue Share (%), by Derivatives 2024 & 2032
- Figure 22: Europe Phenol Derivatives Market Revenue (Million), by Country 2024 & 2032
- Figure 23: Europe Phenol Derivatives Market Revenue Share (%), by Country 2024 & 2032
- Figure 24: South America Phenol Derivatives Market Revenue (Million), by Derivatives 2024 & 2032
- Figure 25: South America Phenol Derivatives Market Revenue Share (%), by Derivatives 2024 & 2032
- Figure 26: South America Phenol Derivatives Market Revenue (Million), by Country 2024 & 2032
- Figure 27: South America Phenol Derivatives Market Revenue Share (%), by Country 2024 & 2032
- Figure 28: Middle East and Africa Phenol Derivatives Market Revenue (Million), by Derivatives 2024 & 2032
- Figure 29: Middle East and Africa Phenol Derivatives Market Revenue Share (%), by Derivatives 2024 & 2032
- Figure 30: Middle East and Africa Phenol Derivatives Market Revenue (Million), by Country 2024 & 2032
- Figure 31: Middle East and Africa Phenol Derivatives Market Revenue Share (%), by Country 2024 & 2032
List of Tables
- Table 1: Global Phenol Derivatives Market Revenue Million Forecast, by Region 2019 & 2032
- Table 2: Global Phenol Derivatives Market Revenue Million Forecast, by Derivatives 2019 & 2032
- Table 3: Global Phenol Derivatives Market Revenue Million Forecast, by Region 2019 & 2032
- Table 4: Global Phenol Derivatives Market Revenue Million Forecast, by Country 2019 & 2032
- Table 5: China Phenol Derivatives Market Revenue (Million) Forecast, by Application 2019 & 2032
- Table 6: India Phenol Derivatives Market Revenue (Million) Forecast, by Application 2019 & 2032
- Table 7: Japan Phenol Derivatives Market Revenue (Million) Forecast, by Application 2019 & 2032
- Table 8: South Korea Phenol Derivatives Market Revenue (Million) Forecast, by Application 2019 & 2032
- Table 9: Rest of Asia Pacific Phenol Derivatives Market Revenue (Million) Forecast, by Application 2019 & 2032
- Table 10: Global Phenol Derivatives Market Revenue Million Forecast, by Country 2019 & 2032
- Table 11: United States Phenol Derivatives Market Revenue (Million) Forecast, by Application 2019 & 2032
- Table 12: Canada Phenol Derivatives Market Revenue (Million) Forecast, by Application 2019 & 2032
- Table 13: Mexico Phenol Derivatives Market Revenue (Million) Forecast, by Application 2019 & 2032
- Table 14: Global Phenol Derivatives Market Revenue Million Forecast, by Country 2019 & 2032
- Table 15: Germany Phenol Derivatives Market Revenue (Million) Forecast, by Application 2019 & 2032
- Table 16: France Phenol Derivatives Market Revenue (Million) Forecast, by Application 2019 & 2032
- Table 17: United Kingdom Phenol Derivatives Market Revenue (Million) Forecast, by Application 2019 & 2032
- Table 18: Italy Phenol Derivatives Market Revenue (Million) Forecast, by Application 2019 & 2032
- Table 19: Rest of the Europe Phenol Derivatives Market Revenue (Million) Forecast, by Application 2019 & 2032
- Table 20: Global Phenol Derivatives Market Revenue Million Forecast, by Country 2019 & 2032
- Table 21: Brazil Phenol Derivatives Market Revenue (Million) Forecast, by Application 2019 & 2032
- Table 22: Argentina Phenol Derivatives Market Revenue (Million) Forecast, by Application 2019 & 2032
- Table 23: Rest of South America Phenol Derivatives Market Revenue (Million) Forecast, by Application 2019 & 2032
- Table 24: Global Phenol Derivatives Market Revenue Million Forecast, by Country 2019 & 2032
- Table 25: Saudi Arabia Phenol Derivatives Market Revenue (Million) Forecast, by Application 2019 & 2032
- Table 26: South Africa Phenol Derivatives Market Revenue (Million) Forecast, by Application 2019 & 2032
- Table 27: Rest of Middle East and Africa Phenol Derivatives Market Revenue (Million) Forecast, by Application 2019 & 2032
- Table 28: Global Phenol Derivatives Market Revenue Million Forecast, by Derivatives 2019 & 2032
- Table 29: Global Phenol Derivatives Market Revenue Million Forecast, by Country 2019 & 2032
- Table 30: China Phenol Derivatives Market Revenue (Million) Forecast, by Application 2019 & 2032
- Table 31: India Phenol Derivatives Market Revenue (Million) Forecast, by Application 2019 & 2032
- Table 32: Japan Phenol Derivatives Market Revenue (Million) Forecast, by Application 2019 & 2032
- Table 33: South Korea Phenol Derivatives Market Revenue (Million) Forecast, by Application 2019 & 2032
- Table 34: Rest of Asia Pacific Phenol Derivatives Market Revenue (Million) Forecast, by Application 2019 & 2032
- Table 35: Global Phenol Derivatives Market Revenue Million Forecast, by Derivatives 2019 & 2032
- Table 36: Global Phenol Derivatives Market Revenue Million Forecast, by Country 2019 & 2032
- Table 37: United States Phenol Derivatives Market Revenue (Million) Forecast, by Application 2019 & 2032
- Table 38: Canada Phenol Derivatives Market Revenue (Million) Forecast, by Application 2019 & 2032
- Table 39: Mexico Phenol Derivatives Market Revenue (Million) Forecast, by Application 2019 & 2032
- Table 40: Global Phenol Derivatives Market Revenue Million Forecast, by Derivatives 2019 & 2032
- Table 41: Global Phenol Derivatives Market Revenue Million Forecast, by Country 2019 & 2032
- Table 42: Germany Phenol Derivatives Market Revenue (Million) Forecast, by Application 2019 & 2032
- Table 43: France Phenol Derivatives Market Revenue (Million) Forecast, by Application 2019 & 2032
- Table 44: United Kingdom Phenol Derivatives Market Revenue (Million) Forecast, by Application 2019 & 2032
- Table 45: Italy Phenol Derivatives Market Revenue (Million) Forecast, by Application 2019 & 2032
- Table 46: Rest of the Europe Phenol Derivatives Market Revenue (Million) Forecast, by Application 2019 & 2032
- Table 47: Global Phenol Derivatives Market Revenue Million Forecast, by Derivatives 2019 & 2032
- Table 48: Global Phenol Derivatives Market Revenue Million Forecast, by Country 2019 & 2032
- Table 49: Brazil Phenol Derivatives Market Revenue (Million) Forecast, by Application 2019 & 2032
- Table 50: Argentina Phenol Derivatives Market Revenue (Million) Forecast, by Application 2019 & 2032
- Table 51: Rest of South America Phenol Derivatives Market Revenue (Million) Forecast, by Application 2019 & 2032
- Table 52: Global Phenol Derivatives Market Revenue Million Forecast, by Derivatives 2019 & 2032
- Table 53: Global Phenol Derivatives Market Revenue Million Forecast, by Country 2019 & 2032
- Table 54: Saudi Arabia Phenol Derivatives Market Revenue (Million) Forecast, by Application 2019 & 2032
- Table 55: South Africa Phenol Derivatives Market Revenue (Million) Forecast, by Application 2019 & 2032
- Table 56: Rest of Middle East and Africa Phenol Derivatives Market Revenue (Million) Forecast, by Application 2019 & 2032
Frequently Asked Questions
1. What is the projected Compound Annual Growth Rate (CAGR) of the Phenol Derivatives Market?
The projected CAGR is approximately > 4.50%.
2. Which companies are prominent players in the Phenol Derivatives Market?
Key companies in the market include DIC Corporation, Shell PLC, Fibrant, Domo Chemcial, AdvanSix Inc, Cepsa, Altivia, BASF SE, INEOS Capital Ltd, Fujian Yongrong Jinjiang Co Ltd, PTT Phenol Company Limited, Solvay SA*List Not Exhaustive, Mitsubishi Chemcial Corporation, Mitsui Chemcials Inc.
3. What are the main segments of the Phenol Derivatives Market?
The market segments include Derivatives.
4. Can you provide details about the market size?
The market size is estimated to be USD XX Million as of 2022.
5. What are some drivers contributing to market growth?
Growing Demand from the Pharmaceutical Industry; Increasing Use of Phenol Derivatives in the Production of Agrochemicals. Dyes. and Other Specialty Chemicals..
6. What are the notable trends driving market growth?
Soaring Demand for Phenolic Resin.
7. Are there any restraints impacting market growth?
Stringent Environmental Regulations; Volatility in Raw Material Prices.
8. Can you provide examples of recent developments in the market?
August 2022: A new bisphenol-A production facility was opened in Pune, India. This facility will reduce imports of bisphenol-A to India by promoting domestic manufacturing. 1.35 lakh tons of bisphenol-A are imported into India from the United States and China.
9. What pricing options are available for accessing the report?
Pricing options include single-user, multi-user, and enterprise licenses priced at USD 4750, USD 5250, and USD 8750 respectively.
10. Is the market size provided in terms of value or volume?
The market size is provided in terms of value, measured in Million.
11. Are there any specific market keywords associated with the report?
Yes, the market keyword associated with the report is "Phenol Derivatives Market," which aids in identifying and referencing the specific market segment covered.
12. How do I determine which pricing option suits my needs best?
The pricing options vary based on user requirements and access needs. Individual users may opt for single-user licenses, while businesses requiring broader access may choose multi-user or enterprise licenses for cost-effective access to the report.
13. Are there any additional resources or data provided in the Phenol Derivatives Market report?
While the report offers comprehensive insights, it's advisable to review the specific contents or supplementary materials provided to ascertain if additional resources or data are available.
14. How can I stay updated on further developments or reports in the Phenol Derivatives Market?
To stay informed about further developments, trends, and reports in the Phenol Derivatives Market, consider subscribing to industry newsletters, following relevant companies and organizations, or regularly checking reputable industry news sources and publications.
Methodology
Step 1 - Identification of Relevant Samples Size from Population Database


Step 2 - Approaches for Defining Global Market Size (Value, Volume* & Price*)

Note*: In applicable scenarios
Step 3 - Data Sources
Primary Research
- Web Analytics
- Survey Reports
- Research Institute
- Latest Research Reports
- Opinion Leaders
Secondary Research
- Annual Reports
- White Paper
- Latest Press Release
- Industry Association
- Paid Database
- Investor Presentations

Step 4 - Data Triangulation
Involves using different sources of information in order to increase the validity of a study
These sources are likely to be stakeholders in a program - participants, other researchers, program staff, other community members, and so on.
Then we put all data in single framework & apply various statistical tools to find out the dynamic on the market.
During the analysis stage, feedback from the stakeholder groups would be compared to determine areas of agreement as well as areas of divergence
