

Key Insights
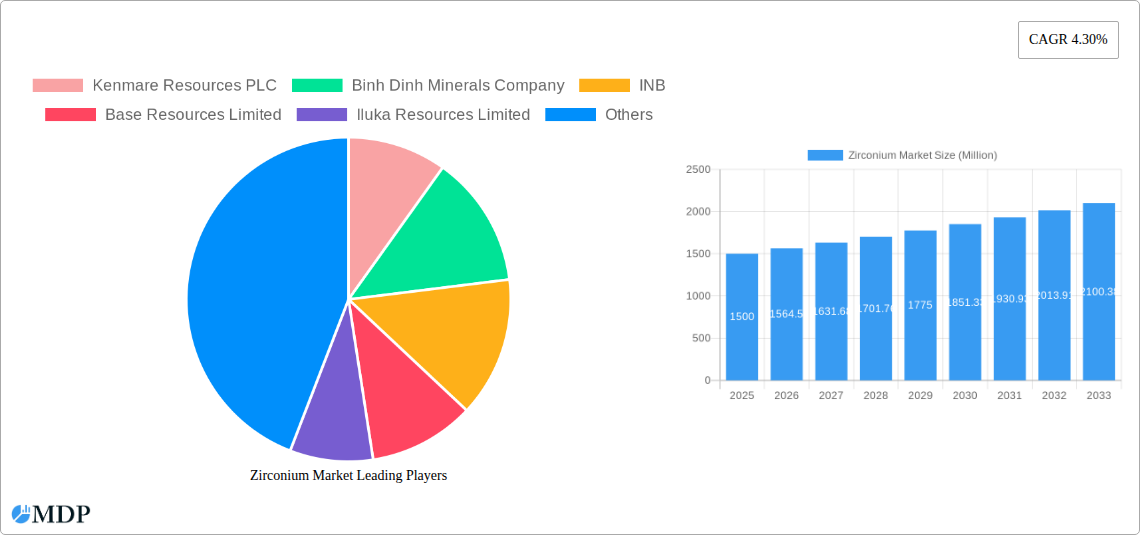
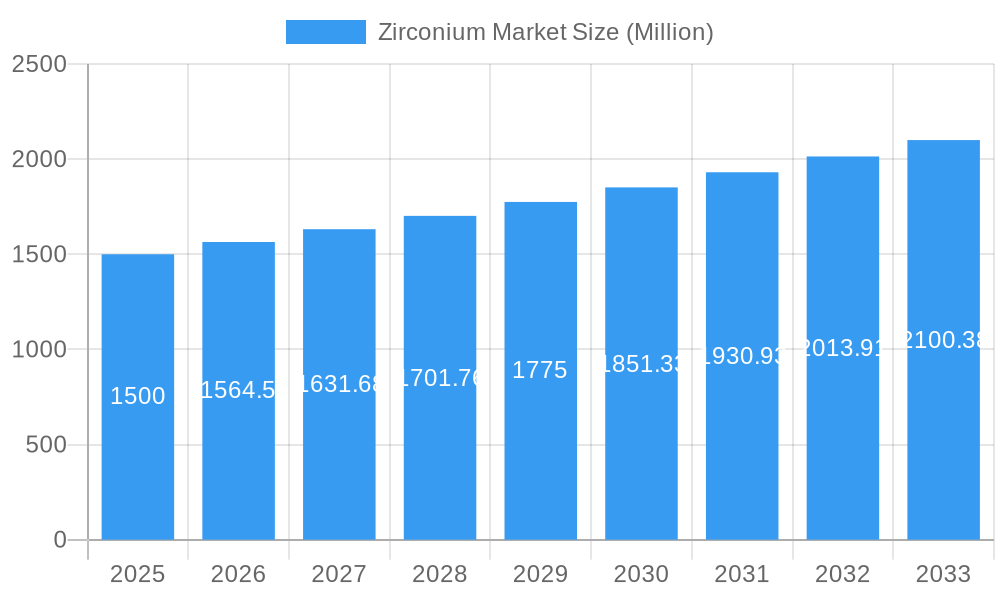
The global zirconium market is projected to reach $1.94 billion by 2025, exhibiting a Compound Annual Growth Rate (CAGR) of 8.49% from 2025 to 2033. This growth is primarily attributed to rising demand in refractories, ceramics, and advanced materials sectors. Zirconium's exceptional properties, including high melting point and chemical resistance, are essential for high-temperature applications such as steelmaking and glass manufacturing. Increased adoption of zircon opacifiers in coatings and paints further fuels market expansion by enhancing opacity and brightness. Technological advancements in extraction and processing are mitigating supply chain risks and price volatility. The Asia-Pacific region, led by China and India, is anticipated to be a key growth driver due to rapid industrialization and infrastructure development.
Zirconium Market Market Size (In Billion)
The market is segmented by product type, with zircon flour/milled sand holding a dominant share, followed by zircon opacifiers and zirconia refractories. Segment growth will be influenced by technological innovations, evolving environmental regulations, and competitive material pricing. Leading companies such as Kenmare Resources PLC, Iluka Resources Limited, and Rio Tinto are focusing on capacity expansion and R&D. Exploration of new deposits and sustainable mining practices will be critical. Mature markets in North America and Europe are expected to see steady growth, driven by established industries and the adoption of new zirconium-based products.
Zirconium Market Company Market Share
Zirconium Market Report: Comprehensive Analysis & Forecast (2019-2033)
This in-depth report provides a comprehensive analysis of the global Zirconium market, offering invaluable insights for industry stakeholders, investors, and strategic decision-makers. Covering the period from 2019 to 2033, with a base year of 2025 and a forecast period of 2025-2033, this report meticulously examines market dynamics, trends, leading players, and future opportunities. The report utilizes data collected during the historical period (2019-2024) and incorporates expert predictions where necessary. The market size is presented in Millions throughout the report.
Zirconium Market Market Dynamics & Concentration
This section analyzes the competitive landscape, innovation drivers, and regulatory influences shaping the Zirconium market. We delve into market concentration, examining market share distribution among key players and exploring the impact of mergers and acquisitions (M&A) activities. The report also assesses the influence of substitute products and evolving end-user trends.
- Market Concentration: The Zirconium market exhibits a [xx]% concentration ratio, with [xx] companies controlling a significant share. This concentration is [increasing/decreasing/stable], primarily due to [reason, e.g., consolidation through M&A, emergence of new players, etc.].
- Innovation Drivers: Key innovation drivers include advancements in [specific technologies, e.g., material science, processing techniques]. This has led to the development of [new products/applications].
- Regulatory Frameworks: Government regulations concerning [environmental standards, resource extraction, etc.] significantly impact market growth and operational costs. The impact of these regulations is [positive/negative/neutral], influencing market expansion in specific regions.
- Product Substitutes: [Mention potential substitute materials and their impact on market share, e.g., alternative refractory materials]. The competitive threat posed by substitutes is assessed to be [high/medium/low].
- End-User Trends: The increasing demand for Zirconium in [specific application areas, e.g., nuclear power, advanced ceramics] is driving market growth. [Quantify this demand if possible, e.g., Demand in application X is projected to grow at xx% CAGR].
- M&A Activities: The report tracks [xx] M&A deals in the Zirconium market during the study period. These activities have primarily focused on [strategic goals, e.g., expanding market share, acquiring new technologies].
Zirconium Market Industry Trends & Analysis
This section provides an in-depth analysis of the key trends shaping the Zirconium market, including growth drivers, technological advancements, consumer preferences, and competitive dynamics. The report assesses the market's overall growth trajectory and provides a detailed CAGR forecast for the projected period. The market penetration rate for key Zirconium applications is also analyzed.
This section will present a detailed analysis of market growth drivers, focusing on factors such as increasing demand from key industries, technological advancements leading to new applications, and evolving consumer preferences. The competitive dynamics will be examined, exploring strategies employed by key players, including pricing strategies, product differentiation, and market expansion initiatives. Specific metrics such as CAGR and market penetration rates will be included to provide quantifiable insights into market growth and performance. The impact of technological disruptions will be assessed, including the potential for [disruptive technologies] to reshape the industry landscape. The impact of macroeconomic factors such as global economic growth, inflation and commodity prices will also be examined. The analysis considers the various occurrences including Zircon, Zirconia, and other occurrence types.
Leading Markets & Segments in Zirconium Market
This section identifies the dominant regions, countries, and segments within the Zirconium market. Detailed analysis will focus on the key drivers underpinning the dominance of each leading segment.
Leading Regions/Countries: [Identify the dominant region(s) and country(ies) and explain reasons for dominance]
- Key Drivers:
- [Bullet points outlining specific economic policies, infrastructure developments, and industry-specific factors contributing to dominance in the identified region(s) and country(ies). Include quantified data if available.]
Leading Segments (Occurrence Type):
- Zircon: [Explain the market share and dominance of Zircon, highlighting key applications and growth drivers.]
- Zirconia: [Explain the market share and dominance of Zirconia, highlighting key applications and growth drivers.]
- Other Occurrence Types: [Analyze the market share and growth prospects for other occurrence types.]
Leading Segments (Applications):
- Zircon Flour/Milled Sand: [Explain the market share and dominance, highlighting key applications and growth drivers. Include details on the market size and expected growth over the forecast period.]
- Zircon Opacifier: [Explain the market share and dominance, highlighting key applications and growth drivers.]
- Refractories (Zirconia): [Explain the market share and dominance, highlighting key applications and growth drivers.]
- Zircon Chemicals: [Explain the market share and dominance, highlighting key applications and growth drivers.]
- Zircon Metal: [Explain the market share and dominance, highlighting key applications and growth drivers.]
Zirconium Market Product Developments
This section summarizes recent product innovations, highlighting technological advancements that enhance product performance, expand application possibilities, and create competitive advantages. The analysis will focus on the trends driving product development and assess the market fit of new offerings.
[Insert a paragraph summarizing recent product innovations, focusing on new materials, improved processing techniques, and enhanced product functionalities. This will include specific examples and an assessment of their impact on the market. ]
Key Drivers of Zirconium Market Growth
This section identifies and analyzes the key factors driving the growth of the Zirconium market. These drivers encompass technological advancements, economic factors, and regulatory influences.
[Insert a paragraph or bulleted list outlining the key drivers of market growth, providing concrete examples and quantifiable data where possible. This might include growth in specific end-use sectors, technological breakthroughs enabling new applications, and supportive government policies.]
Challenges in the Zirconium Market Market
This section explores the key challenges hindering the growth of the Zirconium market. These challenges include regulatory hurdles, supply chain constraints, and competitive pressures.
[Insert a paragraph or bulleted list outlining the key challenges facing the Zirconium market, providing specific examples and quantifiable impacts where possible. This could include regulatory constraints on mining operations, price volatility of raw materials, and intense competition from substitute materials.]
Emerging Opportunities in Zirconium Market
This section highlights the emerging opportunities poised to drive long-term growth in the Zirconium market. These opportunities may include technological breakthroughs, strategic partnerships, and market expansion strategies.
[Insert a paragraph highlighting the emerging opportunities in the Zirconium market. This may include new applications, strategic alliances, market expansions into emerging economies and technological advancements that could unlock new market potential.]
Leading Players in the Zirconium Market Sector
- Kenmare Resources PLC
- Binh Dinh Minerals Company
- INB
- Base Resources Limited
- Iluka Resources Limited
- Tronox Holdings PLC
- Lanka Mineral Sands Limited
- MZI Resources Ltd
- Rio Tinto
- Eramet
- Australian Strategic Materials Ltd
- Doral Mineral Sands Pty Ltd
Key Milestones in Zirconium Market Industry
[Insert a bulleted list of key milestones in the Zirconium market, including dates (year/month) and a description of each milestone and its impact. This will include significant product launches, mergers & acquisitions, regulatory changes, and other major events that shaped the market.]
Strategic Outlook for Zirconium Market Market
This section provides a summary of the growth accelerators and strategic opportunities expected to shape the future of the Zirconium market. The outlook emphasizes the potential for market expansion, technological innovations, and strategic partnerships to drive long-term growth.
[Insert a paragraph summarizing the strategic outlook for the Zirconium market, highlighting the key growth drivers and strategic opportunities for the coming years. This might include predictions for market size, technological trends, and potential shifts in competitive dynamics.]
Zirconium Market Segmentation
-
1. Occurrence Type
- 1.1. Zircon
- 1.2. Zirconia
- 1.3. Other Occurrence Types
-
2. Applications
- 2.1. Zircon Flour/Milled Sand
- 2.2. Zircon Opacifier
- 2.3. Refractories (Zirconia)
- 2.4. Zircon Chemicals
- 2.5. Zircon Metal
Zirconium Market Segmentation By Geography
-
1. North America
- 1.1. United States
- 1.2. Canada
- 1.3. Mexico
-
2. Europe
- 2.1. Germany
- 2.2. France
- 2.3. Italy
- 2.4. United Kingdom
- 2.5. Spain
- 2.6. Russia
- 2.7. Rest of Europe
-
3. Asia Pacific
- 3.1. China
- 3.2. Japan
- 3.3. India
- 3.4. Southeast Asia
- 3.5. South Korea
- 3.6. Australia
- 3.7. Rest of Asia Pacific
-
4. South America
- 4.1. Brazil
- 4.2. Argentina
- 4.3. Rest of South America
-
5. Middle East & Africa
- 5.1. UAE
- 5.2. Saudi Arabia
- 5.3. South Africa
- 5.4. Rest of Middle East & Africa
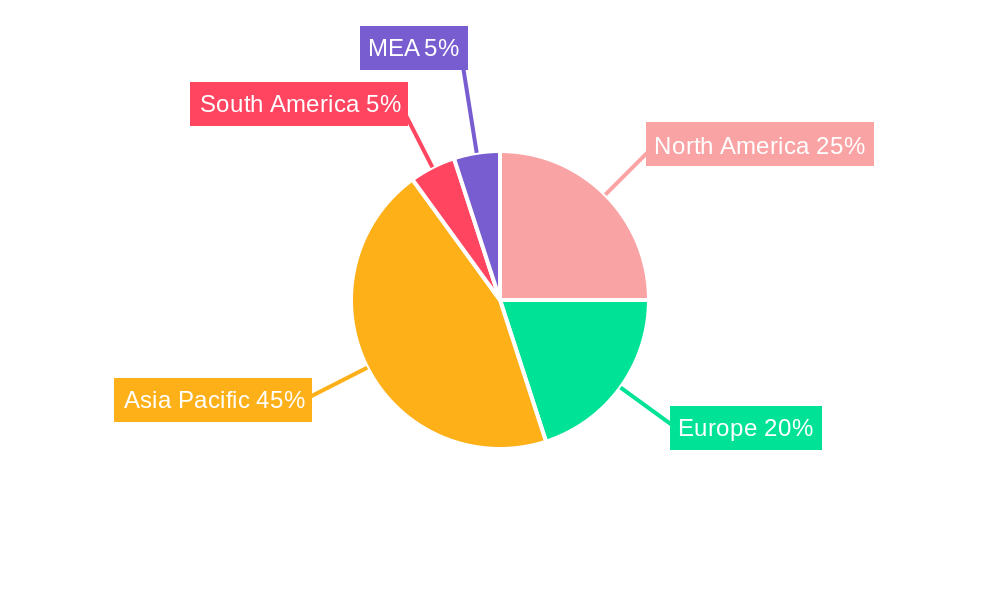
Zirconium Market Regional Market Share
Geographic Coverage of Zirconium Market
Zirconium Market REPORT HIGHLIGHTS
| Aspects | Details |
|---|---|
| Study Period | 2020-2034 |
| Base Year | 2025 |
| Estimated Year | 2026 |
| Forecast Period | 2026-2034 |
| Historical Period | 2020-2025 |
| Growth Rate | CAGR of 8.49% from 2020-2034 |
| Segmentation |
|
Table of Contents
- 1. Introduction
- 1.1. Research Scope
- 1.2. Market Segmentation
- 1.3. Research Objective
- 1.4. Definitions and Assumptions
- 2. Executive Summary
- 2.1. Market Snapshot
- 3. Market Dynamics
- 3.1. Market Drivers
- 3.2. Market Restrains
- 3.3. Market Trends
- 3.4. Market Opportunities
- 4. Market Factor Analysis
- 4.1. Porters Five Forces
- 4.1.1. Bargaining Power of Suppliers
- 4.1.2. Bargaining Power of Buyers
- 4.1.3. Threat of New Entrants
- 4.1.4. Threat of Substitutes
- 4.1.5. Competitive Rivalry
- 4.2. PESTEL analysis
- 4.3. BCG Analysis
- 4.3.1. Stars (High Growth, High Market Share)
- 4.3.2. Cash Cows (Low Growth, High Market Share)
- 4.3.3. Question Mark (High Growth, Low Market Share)
- 4.3.4. Dogs (Low Growth, Low Market Share)
- 4.4. Ansoff Matrix Analysis
- 4.5. Supply Chain Analysis
- 4.6. Regulatory Landscape
- 4.7. Current Market Potential and Opportunity Assessment (TAM–SAM–SOM Framework)
- 4.8. MDP Analyst Note
- 4.1. Porters Five Forces
- 5. Market Analysis, Insights and Forecast 2021-2033
- 5.1. Market Analysis, Insights and Forecast - by Occurrence Type
- 5.1.1. Zircon
- 5.1.2. Zirconia
- 5.1.3. Other Occurrence Types
- 5.2. Market Analysis, Insights and Forecast - by Applications
- 5.2.1. Zircon Flour/Milled Sand
- 5.2.2. Zircon Opacifier
- 5.2.3. Refractories (Zirconia)
- 5.2.4. Zircon Chemicals
- 5.2.5. Zircon Metal
- 5.3. Market Analysis, Insights and Forecast - by Region
- 5.3.1. North America
- 5.3.2. Europe
- 5.3.3. Asia Pacific
- 5.3.4. South America
- 5.3.5. Middle East & Africa
- 5.1. Market Analysis, Insights and Forecast - by Occurrence Type
- 6. Global Zirconium Market Analysis, Insights and Forecast, 2021-2033
- 6.1. Market Analysis, Insights and Forecast - by Occurrence Type
- 6.1.1. Zircon
- 6.1.2. Zirconia
- 6.1.3. Other Occurrence Types
- 6.2. Market Analysis, Insights and Forecast - by Applications
- 6.2.1. Zircon Flour/Milled Sand
- 6.2.2. Zircon Opacifier
- 6.2.3. Refractories (Zirconia)
- 6.2.4. Zircon Chemicals
- 6.2.5. Zircon Metal
- 6.1. Market Analysis, Insights and Forecast - by Occurrence Type
- 7. North America Zirconium Market Analysis, Insights and Forecast, 2020-2032
- 7.1. Market Analysis, Insights and Forecast - by Occurrence Type
- 7.1.1. Zircon
- 7.1.2. Zirconia
- 7.1.3. Other Occurrence Types
- 7.2. Market Analysis, Insights and Forecast - by Applications
- 7.2.1. Zircon Flour/Milled Sand
- 7.2.2. Zircon Opacifier
- 7.2.3. Refractories (Zirconia)
- 7.2.4. Zircon Chemicals
- 7.2.5. Zircon Metal
- 7.1. Market Analysis, Insights and Forecast - by Occurrence Type
- 8. Europe Zirconium Market Analysis, Insights and Forecast, 2020-2032
- 8.1. Market Analysis, Insights and Forecast - by Occurrence Type
- 8.1.1. Zircon
- 8.1.2. Zirconia
- 8.1.3. Other Occurrence Types
- 8.2. Market Analysis, Insights and Forecast - by Applications
- 8.2.1. Zircon Flour/Milled Sand
- 8.2.2. Zircon Opacifier
- 8.2.3. Refractories (Zirconia)
- 8.2.4. Zircon Chemicals
- 8.2.5. Zircon Metal
- 8.1. Market Analysis, Insights and Forecast - by Occurrence Type
- 9. Asia Pacific Zirconium Market Analysis, Insights and Forecast, 2020-2032
- 9.1. Market Analysis, Insights and Forecast - by Occurrence Type
- 9.1.1. Zircon
- 9.1.2. Zirconia
- 9.1.3. Other Occurrence Types
- 9.2. Market Analysis, Insights and Forecast - by Applications
- 9.2.1. Zircon Flour/Milled Sand
- 9.2.2. Zircon Opacifier
- 9.2.3. Refractories (Zirconia)
- 9.2.4. Zircon Chemicals
- 9.2.5. Zircon Metal
- 9.1. Market Analysis, Insights and Forecast - by Occurrence Type
- 10. South America Zirconium Market Analysis, Insights and Forecast, 2020-2032
- 10.1. Market Analysis, Insights and Forecast - by Occurrence Type
- 10.1.1. Zircon
- 10.1.2. Zirconia
- 10.1.3. Other Occurrence Types
- 10.2. Market Analysis, Insights and Forecast - by Applications
- 10.2.1. Zircon Flour/Milled Sand
- 10.2.2. Zircon Opacifier
- 10.2.3. Refractories (Zirconia)
- 10.2.4. Zircon Chemicals
- 10.2.5. Zircon Metal
- 10.1. Market Analysis, Insights and Forecast - by Occurrence Type
- 11. Middle East & Africa Zirconium Market Analysis, Insights and Forecast, 2020-2032
- 11.1. Market Analysis, Insights and Forecast - by Occurrence Type
- 11.1.1. Zircon
- 11.1.2. Zirconia
- 11.1.3. Other Occurrence Types
- 11.2. Market Analysis, Insights and Forecast - by Applications
- 11.2.1. Zircon Flour/Milled Sand
- 11.2.2. Zircon Opacifier
- 11.2.3. Refractories (Zirconia)
- 11.2.4. Zircon Chemicals
- 11.2.5. Zircon Metal
- 11.1. Market Analysis, Insights and Forecast - by Occurrence Type
- 12. Competitive Analysis
- 12.1. Company Profiles
- 12.1.1 Kenmare Resources PLC
- 12.1.1.1. Company Overview
- 12.1.1.2. Products
- 12.1.1.3. Company Financials
- 12.1.1.4. SWOT Analysis
- 12.1.2 Binh Dinh Minerals Company
- 12.1.2.1. Company Overview
- 12.1.2.2. Products
- 12.1.2.3. Company Financials
- 12.1.2.4. SWOT Analysis
- 12.1.3 INB
- 12.1.3.1. Company Overview
- 12.1.3.2. Products
- 12.1.3.3. Company Financials
- 12.1.3.4. SWOT Analysis
- 12.1.4 Base Resources Limited
- 12.1.4.1. Company Overview
- 12.1.4.2. Products
- 12.1.4.3. Company Financials
- 12.1.4.4. SWOT Analysis
- 12.1.5 Iluka Resources Limited
- 12.1.5.1. Company Overview
- 12.1.5.2. Products
- 12.1.5.3. Company Financials
- 12.1.5.4. SWOT Analysis
- 12.1.6 Tronox Holdings PLC
- 12.1.6.1. Company Overview
- 12.1.6.2. Products
- 12.1.6.3. Company Financials
- 12.1.6.4. SWOT Analysis
- 12.1.7 Lanka Mineral Sands Limited
- 12.1.7.1. Company Overview
- 12.1.7.2. Products
- 12.1.7.3. Company Financials
- 12.1.7.4. SWOT Analysis
- 12.1.8 MZI Resources Ltd
- 12.1.8.1. Company Overview
- 12.1.8.2. Products
- 12.1.8.3. Company Financials
- 12.1.8.4. SWOT Analysis
- 12.1.9 Rio Tinto
- 12.1.9.1. Company Overview
- 12.1.9.2. Products
- 12.1.9.3. Company Financials
- 12.1.9.4. SWOT Analysis
- 12.1.10 Eramet
- 12.1.10.1. Company Overview
- 12.1.10.2. Products
- 12.1.10.3. Company Financials
- 12.1.10.4. SWOT Analysis
- 12.1.11 Australian Strategic Materials Ltd
- 12.1.11.1. Company Overview
- 12.1.11.2. Products
- 12.1.11.3. Company Financials
- 12.1.11.4. SWOT Analysis
- 12.1.12 Doral Mineral Sands Pty Ltd
- 12.1.12.1. Company Overview
- 12.1.12.2. Products
- 12.1.12.3. Company Financials
- 12.1.12.4. SWOT Analysis
- 12.1.1 Kenmare Resources PLC
- 12.2. Market Entropy
- 12.2.1 Company's Key Areas Served
- 12.2.2 Recent Developments
- 12.3. Company Market Share Analysis 2025
- 12.3.1 Top 5 Companies Market Share Analysis
- 12.3.2 Top 3 Companies Market Share Analysis
- 12.4. List of Potential Customers
- 13. Research Methodology
List of Figures
- Figure 1: Global Zirconium Market Revenue Breakdown (billion, %) by Region 2025 & 2033
- Figure 2: Global Zirconium Market Volume Breakdown (K Tons, %) by Region 2025 & 2033
- Figure 3: North America Zirconium Market Revenue (billion), by Occurrence Type 2025 & 2033
- Figure 4: North America Zirconium Market Volume (K Tons), by Occurrence Type 2025 & 2033
- Figure 5: North America Zirconium Market Revenue Share (%), by Occurrence Type 2025 & 2033
- Figure 6: North America Zirconium Market Volume Share (%), by Occurrence Type 2025 & 2033
- Figure 7: North America Zirconium Market Revenue (billion), by Applications 2025 & 2033
- Figure 8: North America Zirconium Market Volume (K Tons), by Applications 2025 & 2033
- Figure 9: North America Zirconium Market Revenue Share (%), by Applications 2025 & 2033
- Figure 10: North America Zirconium Market Volume Share (%), by Applications 2025 & 2033
- Figure 11: North America Zirconium Market Revenue (billion), by Country 2025 & 2033
- Figure 12: North America Zirconium Market Volume (K Tons), by Country 2025 & 2033
- Figure 13: North America Zirconium Market Revenue Share (%), by Country 2025 & 2033
- Figure 14: North America Zirconium Market Volume Share (%), by Country 2025 & 2033
- Figure 15: Europe Zirconium Market Revenue (billion), by Occurrence Type 2025 & 2033
- Figure 16: Europe Zirconium Market Volume (K Tons), by Occurrence Type 2025 & 2033
- Figure 17: Europe Zirconium Market Revenue Share (%), by Occurrence Type 2025 & 2033
- Figure 18: Europe Zirconium Market Volume Share (%), by Occurrence Type 2025 & 2033
- Figure 19: Europe Zirconium Market Revenue (billion), by Applications 2025 & 2033
- Figure 20: Europe Zirconium Market Volume (K Tons), by Applications 2025 & 2033
- Figure 21: Europe Zirconium Market Revenue Share (%), by Applications 2025 & 2033
- Figure 22: Europe Zirconium Market Volume Share (%), by Applications 2025 & 2033
- Figure 23: Europe Zirconium Market Revenue (billion), by Country 2025 & 2033
- Figure 24: Europe Zirconium Market Volume (K Tons), by Country 2025 & 2033
- Figure 25: Europe Zirconium Market Revenue Share (%), by Country 2025 & 2033
- Figure 26: Europe Zirconium Market Volume Share (%), by Country 2025 & 2033
- Figure 27: Asia Pacific Zirconium Market Revenue (billion), by Occurrence Type 2025 & 2033
- Figure 28: Asia Pacific Zirconium Market Volume (K Tons), by Occurrence Type 2025 & 2033
- Figure 29: Asia Pacific Zirconium Market Revenue Share (%), by Occurrence Type 2025 & 2033
- Figure 30: Asia Pacific Zirconium Market Volume Share (%), by Occurrence Type 2025 & 2033
- Figure 31: Asia Pacific Zirconium Market Revenue (billion), by Applications 2025 & 2033
- Figure 32: Asia Pacific Zirconium Market Volume (K Tons), by Applications 2025 & 2033
- Figure 33: Asia Pacific Zirconium Market Revenue Share (%), by Applications 2025 & 2033
- Figure 34: Asia Pacific Zirconium Market Volume Share (%), by Applications 2025 & 2033
- Figure 35: Asia Pacific Zirconium Market Revenue (billion), by Country 2025 & 2033
- Figure 36: Asia Pacific Zirconium Market Volume (K Tons), by Country 2025 & 2033
- Figure 37: Asia Pacific Zirconium Market Revenue Share (%), by Country 2025 & 2033
- Figure 38: Asia Pacific Zirconium Market Volume Share (%), by Country 2025 & 2033
- Figure 39: South America Zirconium Market Revenue (billion), by Occurrence Type 2025 & 2033
- Figure 40: South America Zirconium Market Volume (K Tons), by Occurrence Type 2025 & 2033
- Figure 41: South America Zirconium Market Revenue Share (%), by Occurrence Type 2025 & 2033
- Figure 42: South America Zirconium Market Volume Share (%), by Occurrence Type 2025 & 2033
- Figure 43: South America Zirconium Market Revenue (billion), by Applications 2025 & 2033
- Figure 44: South America Zirconium Market Volume (K Tons), by Applications 2025 & 2033
- Figure 45: South America Zirconium Market Revenue Share (%), by Applications 2025 & 2033
- Figure 46: South America Zirconium Market Volume Share (%), by Applications 2025 & 2033
- Figure 47: South America Zirconium Market Revenue (billion), by Country 2025 & 2033
- Figure 48: South America Zirconium Market Volume (K Tons), by Country 2025 & 2033
- Figure 49: South America Zirconium Market Revenue Share (%), by Country 2025 & 2033
- Figure 50: South America Zirconium Market Volume Share (%), by Country 2025 & 2033
- Figure 51: Middle East & Africa Zirconium Market Revenue (billion), by Occurrence Type 2025 & 2033
- Figure 52: Middle East & Africa Zirconium Market Volume (K Tons), by Occurrence Type 2025 & 2033
- Figure 53: Middle East & Africa Zirconium Market Revenue Share (%), by Occurrence Type 2025 & 2033
- Figure 54: Middle East & Africa Zirconium Market Volume Share (%), by Occurrence Type 2025 & 2033
- Figure 55: Middle East & Africa Zirconium Market Revenue (billion), by Applications 2025 & 2033
- Figure 56: Middle East & Africa Zirconium Market Volume (K Tons), by Applications 2025 & 2033
- Figure 57: Middle East & Africa Zirconium Market Revenue Share (%), by Applications 2025 & 2033
- Figure 58: Middle East & Africa Zirconium Market Volume Share (%), by Applications 2025 & 2033
- Figure 59: Middle East & Africa Zirconium Market Revenue (billion), by Country 2025 & 2033
- Figure 60: Middle East & Africa Zirconium Market Volume (K Tons), by Country 2025 & 2033
- Figure 61: Middle East & Africa Zirconium Market Revenue Share (%), by Country 2025 & 2033
- Figure 62: Middle East & Africa Zirconium Market Volume Share (%), by Country 2025 & 2033
List of Tables
- Table 1: Global Zirconium Market Revenue billion Forecast, by Occurrence Type 2020 & 2033
- Table 2: Global Zirconium Market Volume K Tons Forecast, by Occurrence Type 2020 & 2033
- Table 3: Global Zirconium Market Revenue billion Forecast, by Applications 2020 & 2033
- Table 4: Global Zirconium Market Volume K Tons Forecast, by Applications 2020 & 2033
- Table 5: Global Zirconium Market Revenue billion Forecast, by Region 2020 & 2033
- Table 6: Global Zirconium Market Volume K Tons Forecast, by Region 2020 & 2033
- Table 7: Global Zirconium Market Revenue billion Forecast, by Occurrence Type 2020 & 2033
- Table 8: Global Zirconium Market Volume K Tons Forecast, by Occurrence Type 2020 & 2033
- Table 9: Global Zirconium Market Revenue billion Forecast, by Applications 2020 & 2033
- Table 10: Global Zirconium Market Volume K Tons Forecast, by Applications 2020 & 2033
- Table 11: Global Zirconium Market Revenue billion Forecast, by Country 2020 & 2033
- Table 12: Global Zirconium Market Volume K Tons Forecast, by Country 2020 & 2033
- Table 13: United States Zirconium Market Revenue (billion) Forecast, by Application 2020 & 2033
- Table 14: United States Zirconium Market Volume (K Tons) Forecast, by Application 2020 & 2033
- Table 15: Canada Zirconium Market Revenue (billion) Forecast, by Application 2020 & 2033
- Table 16: Canada Zirconium Market Volume (K Tons) Forecast, by Application 2020 & 2033
- Table 17: Mexico Zirconium Market Revenue (billion) Forecast, by Application 2020 & 2033
- Table 18: Mexico Zirconium Market Volume (K Tons) Forecast, by Application 2020 & 2033
- Table 19: Global Zirconium Market Revenue billion Forecast, by Occurrence Type 2020 & 2033
- Table 20: Global Zirconium Market Volume K Tons Forecast, by Occurrence Type 2020 & 2033
- Table 21: Global Zirconium Market Revenue billion Forecast, by Applications 2020 & 2033
- Table 22: Global Zirconium Market Volume K Tons Forecast, by Applications 2020 & 2033
- Table 23: Global Zirconium Market Revenue billion Forecast, by Country 2020 & 2033
- Table 24: Global Zirconium Market Volume K Tons Forecast, by Country 2020 & 2033
- Table 25: Germany Zirconium Market Revenue (billion) Forecast, by Application 2020 & 2033
- Table 26: Germany Zirconium Market Volume (K Tons) Forecast, by Application 2020 & 2033
- Table 27: France Zirconium Market Revenue (billion) Forecast, by Application 2020 & 2033
- Table 28: France Zirconium Market Volume (K Tons) Forecast, by Application 2020 & 2033
- Table 29: Italy Zirconium Market Revenue (billion) Forecast, by Application 2020 & 2033
- Table 30: Italy Zirconium Market Volume (K Tons) Forecast, by Application 2020 & 2033
- Table 31: United Kingdom Zirconium Market Revenue (billion) Forecast, by Application 2020 & 2033
- Table 32: United Kingdom Zirconium Market Volume (K Tons) Forecast, by Application 2020 & 2033
- Table 33: Spain Zirconium Market Revenue (billion) Forecast, by Application 2020 & 2033
- Table 34: Spain Zirconium Market Volume (K Tons) Forecast, by Application 2020 & 2033
- Table 35: Russia Zirconium Market Revenue (billion) Forecast, by Application 2020 & 2033
- Table 36: Russia Zirconium Market Volume (K Tons) Forecast, by Application 2020 & 2033
- Table 37: Rest of Europe Zirconium Market Revenue (billion) Forecast, by Application 2020 & 2033
- Table 38: Rest of Europe Zirconium Market Volume (K Tons) Forecast, by Application 2020 & 2033
- Table 39: Global Zirconium Market Revenue billion Forecast, by Occurrence Type 2020 & 2033
- Table 40: Global Zirconium Market Volume K Tons Forecast, by Occurrence Type 2020 & 2033
- Table 41: Global Zirconium Market Revenue billion Forecast, by Applications 2020 & 2033
- Table 42: Global Zirconium Market Volume K Tons Forecast, by Applications 2020 & 2033
- Table 43: Global Zirconium Market Revenue billion Forecast, by Country 2020 & 2033
- Table 44: Global Zirconium Market Volume K Tons Forecast, by Country 2020 & 2033
- Table 45: China Zirconium Market Revenue (billion) Forecast, by Application 2020 & 2033
- Table 46: China Zirconium Market Volume (K Tons) Forecast, by Application 2020 & 2033
- Table 47: Japan Zirconium Market Revenue (billion) Forecast, by Application 2020 & 2033
- Table 48: Japan Zirconium Market Volume (K Tons) Forecast, by Application 2020 & 2033
- Table 49: India Zirconium Market Revenue (billion) Forecast, by Application 2020 & 2033
- Table 50: India Zirconium Market Volume (K Tons) Forecast, by Application 2020 & 2033
- Table 51: Southeast Asia Zirconium Market Revenue (billion) Forecast, by Application 2020 & 2033
- Table 52: Southeast Asia Zirconium Market Volume (K Tons) Forecast, by Application 2020 & 2033
- Table 53: South Korea Zirconium Market Revenue (billion) Forecast, by Application 2020 & 2033
- Table 54: South Korea Zirconium Market Volume (K Tons) Forecast, by Application 2020 & 2033
- Table 55: Australia Zirconium Market Revenue (billion) Forecast, by Application 2020 & 2033
- Table 56: Australia Zirconium Market Volume (K Tons) Forecast, by Application 2020 & 2033
- Table 57: Rest of Asia Pacific Zirconium Market Revenue (billion) Forecast, by Application 2020 & 2033
- Table 58: Rest of Asia Pacific Zirconium Market Volume (K Tons) Forecast, by Application 2020 & 2033
- Table 59: Global Zirconium Market Revenue billion Forecast, by Occurrence Type 2020 & 2033
- Table 60: Global Zirconium Market Volume K Tons Forecast, by Occurrence Type 2020 & 2033
- Table 61: Global Zirconium Market Revenue billion Forecast, by Applications 2020 & 2033
- Table 62: Global Zirconium Market Volume K Tons Forecast, by Applications 2020 & 2033
- Table 63: Global Zirconium Market Revenue billion Forecast, by Country 2020 & 2033
- Table 64: Global Zirconium Market Volume K Tons Forecast, by Country 2020 & 2033
- Table 65: Brazil Zirconium Market Revenue (billion) Forecast, by Application 2020 & 2033
- Table 66: Brazil Zirconium Market Volume (K Tons) Forecast, by Application 2020 & 2033
- Table 67: Argentina Zirconium Market Revenue (billion) Forecast, by Application 2020 & 2033
- Table 68: Argentina Zirconium Market Volume (K Tons) Forecast, by Application 2020 & 2033
- Table 69: Rest of South America Zirconium Market Revenue (billion) Forecast, by Application 2020 & 2033
- Table 70: Rest of South America Zirconium Market Volume (K Tons) Forecast, by Application 2020 & 2033
- Table 71: Global Zirconium Market Revenue billion Forecast, by Occurrence Type 2020 & 2033
- Table 72: Global Zirconium Market Volume K Tons Forecast, by Occurrence Type 2020 & 2033
- Table 73: Global Zirconium Market Revenue billion Forecast, by Applications 2020 & 2033
- Table 74: Global Zirconium Market Volume K Tons Forecast, by Applications 2020 & 2033
- Table 75: Global Zirconium Market Revenue billion Forecast, by Country 2020 & 2033
- Table 76: Global Zirconium Market Volume K Tons Forecast, by Country 2020 & 2033
- Table 77: UAE Zirconium Market Revenue (billion) Forecast, by Application 2020 & 2033
- Table 78: UAE Zirconium Market Volume (K Tons) Forecast, by Application 2020 & 2033
- Table 79: Saudi Arabia Zirconium Market Revenue (billion) Forecast, by Application 2020 & 2033
- Table 80: Saudi Arabia Zirconium Market Volume (K Tons) Forecast, by Application 2020 & 2033
- Table 81: South Africa Zirconium Market Revenue (billion) Forecast, by Application 2020 & 2033
- Table 82: South Africa Zirconium Market Volume (K Tons) Forecast, by Application 2020 & 2033
- Table 83: Rest of Middle East & Africa Zirconium Market Revenue (billion) Forecast, by Application 2020 & 2033
- Table 84: Rest of Middle East & Africa Zirconium Market Volume (K Tons) Forecast, by Application 2020 & 2033
Frequently Asked Questions
1. What is the projected Compound Annual Growth Rate (CAGR) of the Zirconium Market?
The projected CAGR is approximately 8.49%.
2. Which companies are prominent players in the Zirconium Market?
Key companies in the market include Kenmare Resources PLC, Binh Dinh Minerals Company, INB, Base Resources Limited, Iluka Resources Limited, Tronox Holdings PLC, Lanka Mineral Sands Limited, MZI Resources Ltd, Rio Tinto, Eramet, Australian Strategic Materials Ltd, Doral Mineral Sands Pty Ltd.
3. What are the main segments of the Zirconium Market?
The market segments include Occurrence Type, Applications.
4. Can you provide details about the market size?
The market size is estimated to be USD 1.94 billion as of 2022.
5. What are some drivers contributing to market growth?
Growth of Nuclear Power Stations in the Asia-Pacific; Consistent Growth in Foundries and Refractories; Accelerating Usage in Surface Coatings.
6. What are the notable trends driving market growth?
Increasing Demand from Zircon Flour/Sand.
7. Are there any restraints impacting market growth?
Reducing Dependence on Zircon.
8. Can you provide examples of recent developments in the market?
Recent developments pertaining to the market studied will be provided in the final report.
9. What pricing options are available for accessing the report?
Pricing options include single-user, multi-user, and enterprise licenses priced at USD 4750, USD 5250, and USD 8750 respectively.
10. Is the market size provided in terms of value or volume?
The market size is provided in terms of value, measured in billion and volume, measured in K Tons.
11. Are there any specific market keywords associated with the report?
Yes, the market keyword associated with the report is "Zirconium Market," which aids in identifying and referencing the specific market segment covered.
12. How do I determine which pricing option suits my needs best?
The pricing options vary based on user requirements and access needs. Individual users may opt for single-user licenses, while businesses requiring broader access may choose multi-user or enterprise licenses for cost-effective access to the report.
13. Are there any additional resources or data provided in the Zirconium Market report?
While the report offers comprehensive insights, it's advisable to review the specific contents or supplementary materials provided to ascertain if additional resources or data are available.
14. How can I stay updated on further developments or reports in the Zirconium Market?
To stay informed about further developments, trends, and reports in the Zirconium Market, consider subscribing to industry newsletters, following relevant companies and organizations, or regularly checking reputable industry news sources and publications.
Methodology
Step 1 - Identification of Relevant Samples Size from Population Database


Step 2 - Approaches for Defining Global Market Size (Value, Volume* & Price*)

Note*: In applicable scenarios
Step 3 - Data Sources
Primary Research
- Web Analytics
- Survey Reports
- Research Institute
- Latest Research Reports
- Opinion Leaders
Secondary Research
- Annual Reports
- White Paper
- Latest Press Release
- Industry Association
- Paid Database
- Investor Presentations

Step 4 - Data Triangulation
Involves using different sources of information in order to increase the validity of a study
These sources are likely to be stakeholders in a program - participants, other researchers, program staff, other community members, and so on.
Then we put all data in single framework & apply various statistical tools to find out the dynamic on the market.
During the analysis stage, feedback from the stakeholder groups would be compared to determine areas of agreement as well as areas of divergence