

Key Insights
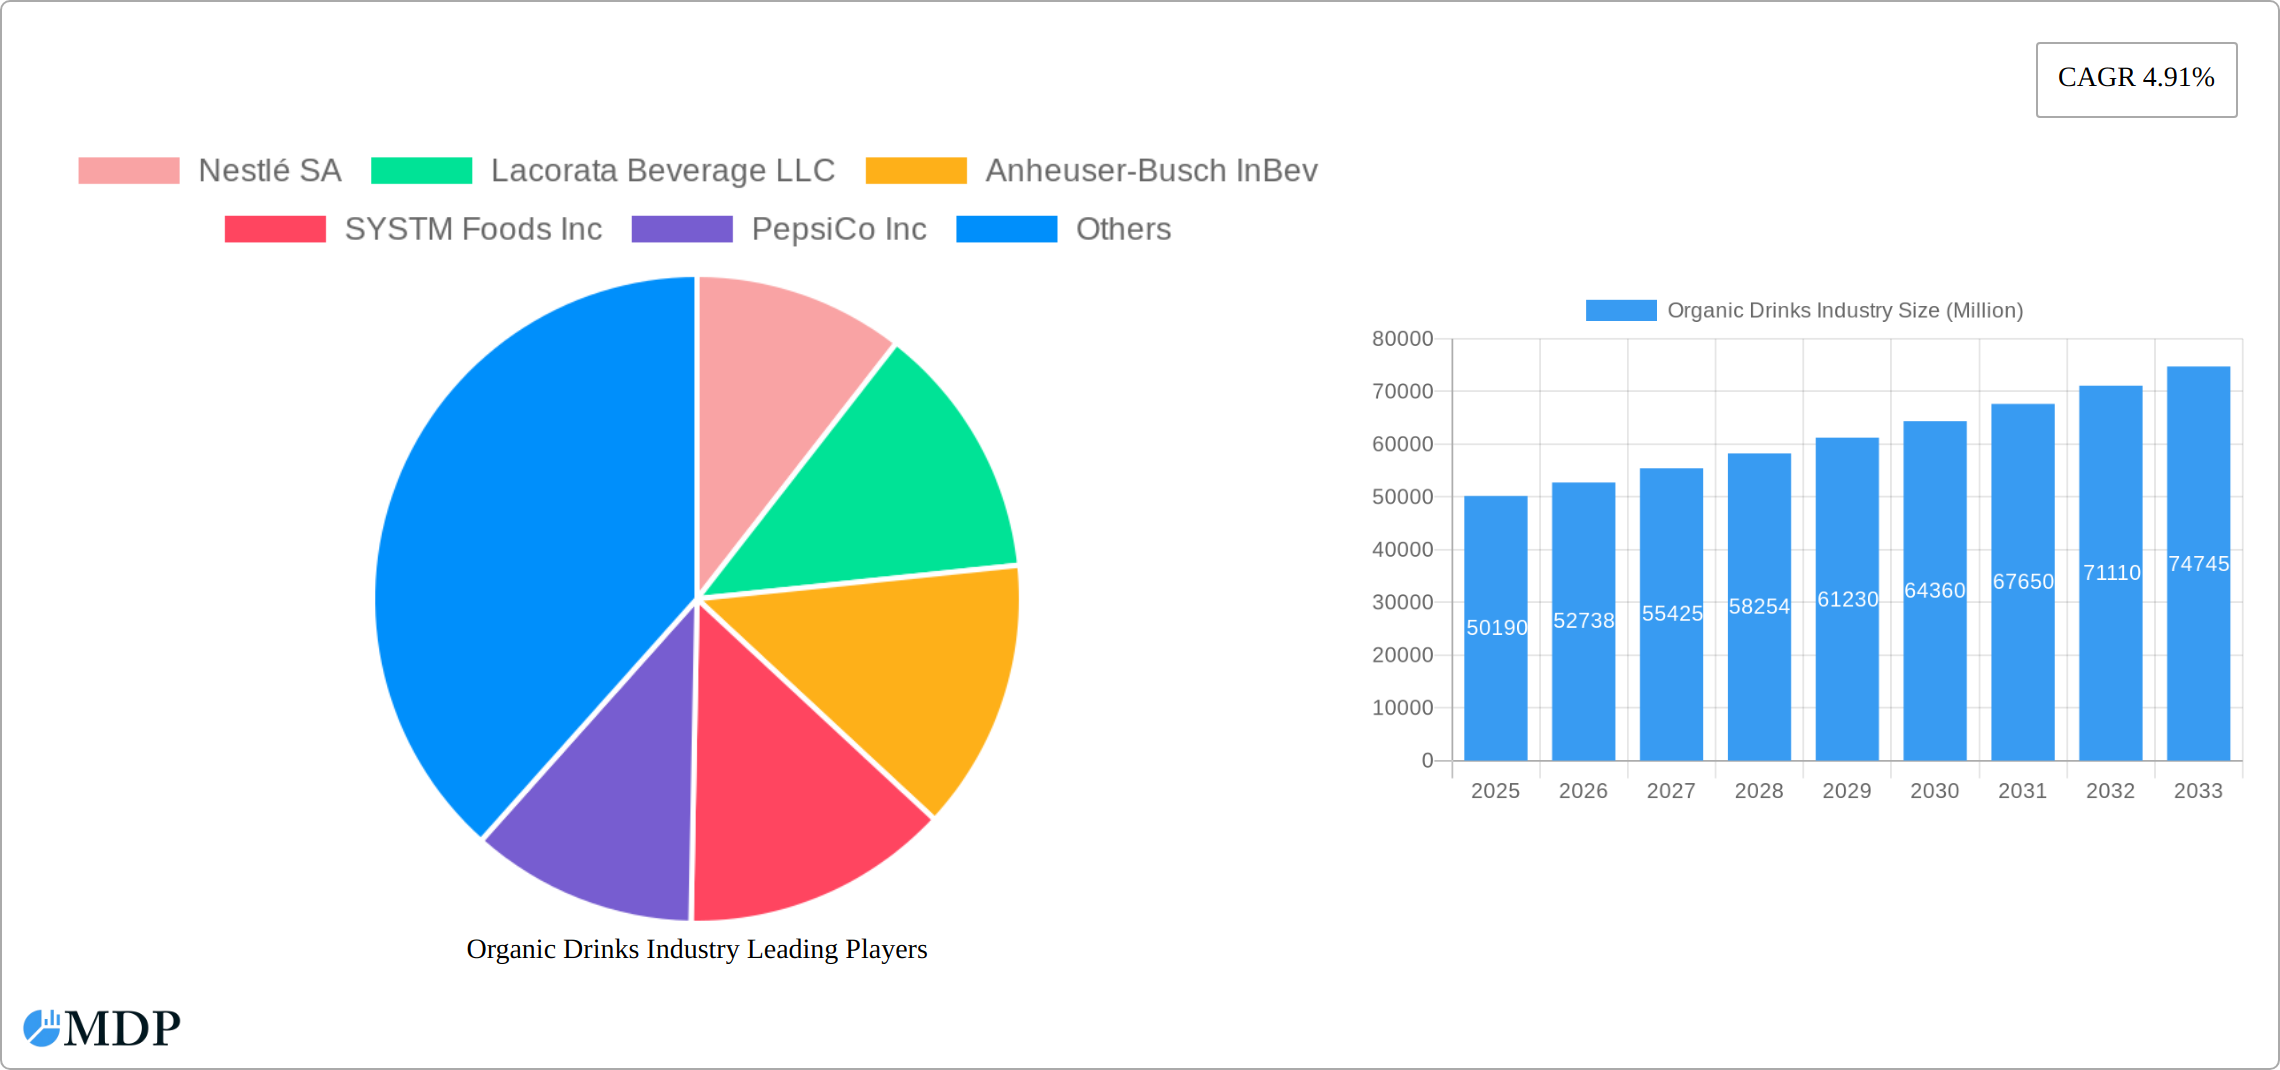
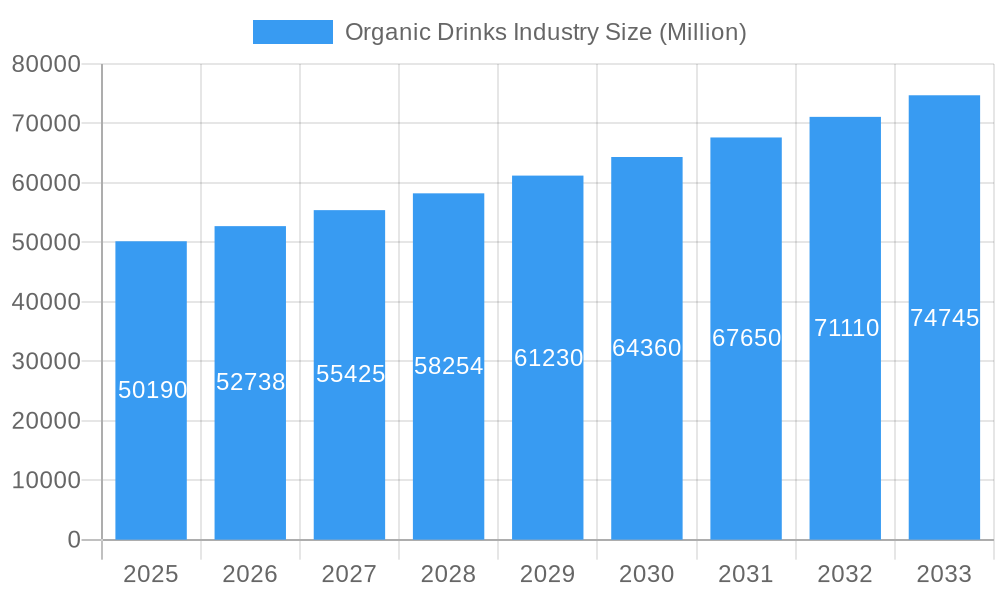
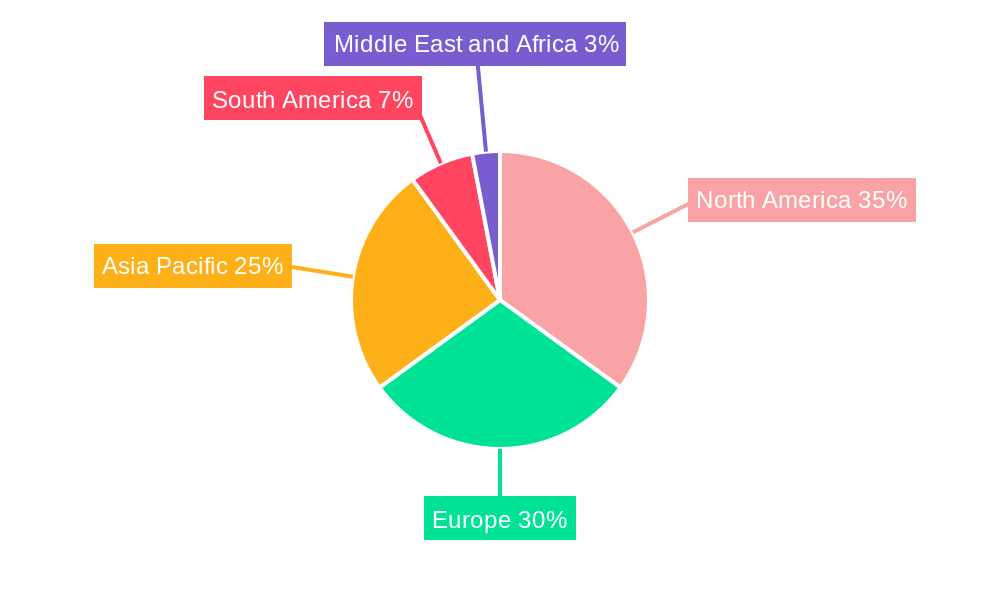
The global organic drinks market, valued at $50.19 billion in 2025, is projected to experience robust growth, driven by increasing consumer awareness of health and wellness, a rising preference for natural and sustainable products, and growing concerns about the potential negative health impacts of artificial additives and preservatives found in conventional beverages. This expanding market is segmented by product type (alcoholic and non-alcoholic organic beverages) and distribution channel (supermarkets/hypermarkets, convenience stores, specialist retailers, online retailers, and other channels). Key players like Nestlé SA, PepsiCo Inc., and Danone SA are capitalizing on this trend, investing in research and development to innovate and expand their organic beverage offerings. The market's growth is further fueled by the increasing popularity of plant-based milk alternatives, organic juices, and functional organic drinks fortified with vitamins and minerals. Geographic variations exist, with North America and Europe currently holding significant market share due to established consumer bases and strong regulatory frameworks supporting organic agriculture. However, Asia-Pacific is anticipated to exhibit significant growth potential in the coming years, driven by increasing disposable incomes and changing lifestyles in emerging economies.
Organic Drinks Industry Market Size (In Billion)
The market's growth trajectory is expected to be influenced by several factors. Sustained consumer demand for healthier alternatives will remain a key driver. However, challenges remain, including higher production costs for organic ingredients compared to conventional ones, which may impact pricing and accessibility for some consumers. Furthermore, fluctuations in raw material prices and the increasing competition from both established and emerging players within the organic food and beverage industry pose challenges. To maintain competitive advantage, companies are focusing on product diversification, strategic partnerships, and expanding their distribution networks. The market's future growth is projected to maintain a Compound Annual Growth Rate (CAGR) of 4.91%, indicating a steady expansion through 2033, although this rate may fluctuate based on economic conditions and shifts in consumer preferences.
Organic Drinks Industry Company Market Share
Organic Drinks Industry: Market Analysis & Growth Forecast (2019-2033)
This comprehensive report provides a detailed analysis of the global organic drinks market, offering invaluable insights for industry stakeholders, investors, and businesses seeking to capitalize on this burgeoning sector. The report covers the period from 2019 to 2033, with a focus on the key developments and trends shaping the market's future. We project a market value exceeding xx Million by 2033.
Organic Drinks Industry Market Dynamics & Concentration
The organic drinks market is a dynamic landscape shaped by several key factors influencing its growth and concentration. While a moderate level of concentration exists, with several large players holding substantial market share (e.g., Nestlé SA, PepsiCo Inc., and Danone SA, alongside others like Anheuser-Busch InBev increasingly focusing on organic offerings), the market also exhibits significant fragmentation, encompassing numerous smaller, regional, and niche players. This creates a competitive environment with opportunities for both established brands and emerging businesses.
Market Concentration Metrics (2024 Estimates): (Note: Replace the 'xx' placeholders below with actual data.)
- Top 5 players hold approximately xx% market share.
- Average market share of top 10 players: xx%
- Number of M&A deals in the past five years: xx
- Herfindahl-Hirschman Index (HHI): xx (This provides a more comprehensive measure of market concentration)
Key Dynamics:
- Innovation Drivers: Consumer demand for healthier, more sustainable, and ethically sourced beverages fuels innovation across product formulations, packaging materials (e.g., increased use of recycled and compostable materials), and distribution methods (e.g., direct-to-consumer models).
- Regulatory Frameworks & Certification: Stringent regulations surrounding organic certification (e.g., USDA Organic, EU Organic) and labeling significantly influence market dynamics. Compliance creates challenges but also provides opportunities for brands to differentiate themselves and build consumer trust.
- Competitive Landscape & Product Substitutes: Competition stems from both conventional beverages and other health-conscious drinks (e.g., functional beverages, plant-based alternatives). However, the unique selling proposition of organic certification provides a strong competitive advantage, appealing to consumers seeking transparency and higher quality ingredients.
- Evolving Consumer Preferences: The rising consumer awareness of health and wellness, coupled with increasing demand for functional beverages (e.g., those with added vitamins, probiotics, or adaptogens) and plant-based options, is a major driver of market growth. Specific dietary restrictions and preferences (e.g., veganism, ketogenic diets) also influence demand.
- Mergers & Acquisitions (M&A): The organic drinks sector is experiencing increased M&A activity, reflecting the strategic importance of organic portfolios for larger corporations seeking to expand their market reach and capitalize on growing consumer demand.
Organic Drinks Industry Industry Trends & Analysis
The global organic drinks market has experienced robust growth during the historical period (2019-2024), and this trend is expected to continue throughout the forecast period (2025-2033). The market is propelled by several key factors, including rising consumer awareness of health and wellness, increasing disposable incomes in emerging economies, and the growing popularity of convenient, ready-to-drink (RTD) formats. Technological advancements in production and packaging further contribute to market expansion.
The CAGR for the market during the forecast period is estimated at xx%. Market penetration of organic drinks remains relatively low, suggesting considerable room for future growth. The rising demand for organic alcoholic beverages, such as organic beer and wine, presents a significant opportunity for growth. Competitive dynamics are characterized by a mix of established players and emerging niche brands, resulting in intense competition and continuous innovation. Consumer preference shifts towards sustainability and ethical sourcing further strengthen the demand for organic drinks.
Leading Markets & Segments in Organic Drinks Industry
The North American market currently holds a dominant position in the global organic drinks market. This dominance is attributable to several factors, including high consumer awareness of health and wellness, strong regulatory support for organic products, and a well-established distribution network. Europe also holds a significant share, driven by strong consumer demand and a progressive regulatory environment.
Key Drivers:
- North America: Strong consumer demand, advanced infrastructure, high disposable incomes.
- Europe: High awareness of health and sustainability, supportive regulatory frameworks, established distribution channels.
- Asia-Pacific: Rapidly growing middle class, increasing disposable incomes, rising health consciousness.
Dominant Segments:
- Product Type: Non-alcoholic organic beverages, particularly juices, teas, and waters, currently represent the largest segment. However, the alcoholic segment, encompassing organic beers, wines, and spirits, is experiencing rapid growth.
- Distribution Channel: Supermarkets/hypermarkets remain the dominant distribution channel, followed by convenience stores and specialist retailers. Online retailers are gaining traction, driven by increasing e-commerce adoption.
Organic Drinks Industry Product Developments
Recent years have seen a surge in product innovation within the organic drinks industry. This is characterized by a focus on: unique and sophisticated flavor profiles catering to evolving palates; functional beverages incorporating added health benefits (e.g., enhanced immunity, improved digestion); and convenient packaging formats (e.g., single-serve bottles, on-the-go pouches) designed to meet modern lifestyles. Technological advancements in production processes have resulted in improvements to product quality, extended shelf life, and reduced environmental impact through more efficient resource utilization and waste reduction. A strong emphasis on sustainable packaging, utilizing recyclable and compostable materials, is gaining significant traction with environmentally conscious consumers. The burgeoning trend towards plant-based and vegan options continues to diversify the product landscape, providing a wider range of choices for consumers.
Key Drivers of Organic Drinks Industry Growth
Several factors contribute to the organic drinks market's growth. These include rising consumer awareness of health and wellness, increasing preference for natural and sustainable products, and favorable government regulations promoting organic agriculture. Technological advancements in production and packaging play a crucial role in enhancing efficiency and reducing costs. Furthermore, the growing availability of organic ingredients and the expansion of distribution networks support market expansion. Economic growth, particularly in developing economies, leads to higher disposable incomes, enabling consumers to purchase premium organic drinks.
Challenges in the Organic Drinks Industry Market
The organic drinks market faces several challenges. Maintaining consistent supply chain management is a significant concern due to the limited availability of certified organic ingredients. Strict regulatory compliance requirements, including labeling and certification processes, pose operational hurdles. Intense competition from both established players and new entrants requires continuous innovation and differentiation. Consumer price sensitivity, particularly in developing economies, limits market penetration of premium organic products. Furthermore, the variability in organic certification standards globally adds complexity to the market. The fluctuations in the prices of raw materials also pose a challenge.
Emerging Opportunities in Organic Drinks Industry
The organic drinks sector presents substantial long-term growth prospects. Several key opportunities are driving expansion: Technological advancements, such as precision fermentation and improved processing techniques, offer avenues for cost reduction and enhanced product quality. Innovative packaging solutions contribute to sustainability and enhanced consumer experience. Strategic partnerships and collaborations between organic producers and established beverage companies can leverage complementary resources and expertise to achieve greater market penetration. Expansion into emerging markets, where consumer awareness of health and sustainability is increasing rapidly, presents significant untapped potential. The creation of entirely new product categories, such as organic functional beverages targeting specific health needs or lifestyle choices, represents further avenues for market segmentation and growth.
Leading Players in the Organic Drinks Industry Sector
- Nestlé SA
- Lacorata Beverage LLC
- Anheuser-Busch InBev
- SYSTM Foods Inc
- PepsiCo Inc
- Whitewave Foods Company
- James White Drinks
- Bison Organic Beer
- Danone SA
- Organic Valley
- PS Organic LLC
- Drake's Organic Spirits LLC
Key Milestones in Organic Drinks Industry Industry
- June 2022: Systm Foods acquired Chameleon Organic Coffee from Nestlé USA, expanding its RTD organic coffee offerings.
- March 2022: Graasi Barley Water launched a new line of organic RTD waters, diversifying the market with unique flavors.
- March 2022: Anheuser-Busch InBev introduced a new line of coconut water-infused hard seltzers under its Michelob Ultra brand, capitalizing on the growing hard seltzer market.
Strategic Outlook for Organic Drinks Industry Market
The future of the organic drinks market is exceptionally promising. The sustained growth in consumer demand for health-conscious and ethically produced products, combined with ongoing technological advancements across production, packaging, and distribution, is poised to fuel significant market expansion. Companies prioritizing sustainable practices, ethical sourcing, and transparent supply chains will hold a distinct competitive advantage. Strategic partnerships and acquisitions will continue to reshape the market landscape, leading to both consolidation and the emergence of new players. The organic drinks industry is well-positioned for considerable growth in both developed and emerging economies, creating abundant opportunities for innovation, expansion, and the development of new product categories tailored to evolving consumer preferences.
Organic Drinks Industry Segmentation
-
1. Product Type
-
1.1. Alcoholic
- 1.1.1. Wine
- 1.1.2. Beer
- 1.1.3. Spirits
- 1.1.4. Other Alcoholic Beverages
-
1.2. Non-alcoholic
- 1.2.1. Fruit and Vegetable Juices
- 1.2.2. Dairy
- 1.2.3. Coffee and Tea
- 1.2.4. Other Non-alcoholic Beverages
-
1.1. Alcoholic
-
2. Distribution Channel
- 2.1. Supermarkets/Hypermarkets
- 2.2. Convenience Stores
- 2.3. Specialist Retailers
- 2.4. Online Retailers
- 2.5. Other Distribution Channels
Organic Drinks Industry Segmentation By Geography
-
1. North America
- 1.1. United States
- 1.2. Canada
- 1.3. Mexico
- 1.4. Rest of North America
-
2. Europe
- 2.1. Spain
- 2.2. United Kingdom
- 2.3. Germany
- 2.4. France
- 2.5. Italy
- 2.6. Russia
- 2.7. Rest of Europe
-
3. Asia Pacific
- 3.1. China
- 3.2. Japan
- 3.3. India
- 3.4. Australia
- 3.5. Rest of Asia Pacific
-
4. South America
- 4.1. Brazil
- 4.2. Argentina
- 4.3. Rest of South America
-
5. Middle East and Africa
- 5.1. South Africa
- 5.2. United Arab Emirates
- 5.3. Rest of Middle East and Africa
Organic Drinks Industry Regional Market Share
Geographic Coverage of Organic Drinks Industry
Organic Drinks Industry REPORT HIGHLIGHTS
| Aspects | Details |
|---|---|
| Study Period | 2020-2034 |
| Base Year | 2025 |
| Estimated Year | 2026 |
| Forecast Period | 2026-2034 |
| Historical Period | 2020-2025 |
| Growth Rate | CAGR of 4.91% from 2020-2034 |
| Segmentation |
|
Table of Contents
- 1. Introduction
- 1.1. Research Scope
- 1.2. Market Segmentation
- 1.3. Research Methodology
- 1.4. Definitions and Assumptions
- 2. Executive Summary
- 2.1. Introduction
- 3. Market Dynamics
- 3.1. Introduction
- 3.2. Market Drivers
- 3.2.1. Growing Demand for Nutricosmetics Among Millennials; Growing Beauty and Wellness Trend
- 3.3. Market Restrains
- 3.3.1. Stringent Government Regulations and Product Guidelines
- 3.4. Market Trends
- 3.4.1. Health-conscious consumers are increasingly demanding organic beverages
- 4. Market Factor Analysis
- 4.1. Porters Five Forces
- 4.2. Supply/Value Chain
- 4.3. PESTEL analysis
- 4.4. Market Entropy
- 4.5. Patent/Trademark Analysis
- 5. Global Organic Drinks Industry Analysis, Insights and Forecast, 2020-2032
- 5.1. Market Analysis, Insights and Forecast - by Product Type
- 5.1.1. Alcoholic
- 5.1.1.1. Wine
- 5.1.1.2. Beer
- 5.1.1.3. Spirits
- 5.1.1.4. Other Alcoholic Beverages
- 5.1.2. Non-alcoholic
- 5.1.2.1. Fruit and Vegetable Juices
- 5.1.2.2. Dairy
- 5.1.2.3. Coffee and Tea
- 5.1.2.4. Other Non-alcoholic Beverages
- 5.1.1. Alcoholic
- 5.2. Market Analysis, Insights and Forecast - by Distribution Channel
- 5.2.1. Supermarkets/Hypermarkets
- 5.2.2. Convenience Stores
- 5.2.3. Specialist Retailers
- 5.2.4. Online Retailers
- 5.2.5. Other Distribution Channels
- 5.3. Market Analysis, Insights and Forecast - by Region
- 5.3.1. North America
- 5.3.2. Europe
- 5.3.3. Asia Pacific
- 5.3.4. South America
- 5.3.5. Middle East and Africa
- 5.1. Market Analysis, Insights and Forecast - by Product Type
- 6. North America Organic Drinks Industry Analysis, Insights and Forecast, 2020-2032
- 6.1. Market Analysis, Insights and Forecast - by Product Type
- 6.1.1. Alcoholic
- 6.1.1.1. Wine
- 6.1.1.2. Beer
- 6.1.1.3. Spirits
- 6.1.1.4. Other Alcoholic Beverages
- 6.1.2. Non-alcoholic
- 6.1.2.1. Fruit and Vegetable Juices
- 6.1.2.2. Dairy
- 6.1.2.3. Coffee and Tea
- 6.1.2.4. Other Non-alcoholic Beverages
- 6.1.1. Alcoholic
- 6.2. Market Analysis, Insights and Forecast - by Distribution Channel
- 6.2.1. Supermarkets/Hypermarkets
- 6.2.2. Convenience Stores
- 6.2.3. Specialist Retailers
- 6.2.4. Online Retailers
- 6.2.5. Other Distribution Channels
- 6.1. Market Analysis, Insights and Forecast - by Product Type
- 7. Europe Organic Drinks Industry Analysis, Insights and Forecast, 2020-2032
- 7.1. Market Analysis, Insights and Forecast - by Product Type
- 7.1.1. Alcoholic
- 7.1.1.1. Wine
- 7.1.1.2. Beer
- 7.1.1.3. Spirits
- 7.1.1.4. Other Alcoholic Beverages
- 7.1.2. Non-alcoholic
- 7.1.2.1. Fruit and Vegetable Juices
- 7.1.2.2. Dairy
- 7.1.2.3. Coffee and Tea
- 7.1.2.4. Other Non-alcoholic Beverages
- 7.1.1. Alcoholic
- 7.2. Market Analysis, Insights and Forecast - by Distribution Channel
- 7.2.1. Supermarkets/Hypermarkets
- 7.2.2. Convenience Stores
- 7.2.3. Specialist Retailers
- 7.2.4. Online Retailers
- 7.2.5. Other Distribution Channels
- 7.1. Market Analysis, Insights and Forecast - by Product Type
- 8. Asia Pacific Organic Drinks Industry Analysis, Insights and Forecast, 2020-2032
- 8.1. Market Analysis, Insights and Forecast - by Product Type
- 8.1.1. Alcoholic
- 8.1.1.1. Wine
- 8.1.1.2. Beer
- 8.1.1.3. Spirits
- 8.1.1.4. Other Alcoholic Beverages
- 8.1.2. Non-alcoholic
- 8.1.2.1. Fruit and Vegetable Juices
- 8.1.2.2. Dairy
- 8.1.2.3. Coffee and Tea
- 8.1.2.4. Other Non-alcoholic Beverages
- 8.1.1. Alcoholic
- 8.2. Market Analysis, Insights and Forecast - by Distribution Channel
- 8.2.1. Supermarkets/Hypermarkets
- 8.2.2. Convenience Stores
- 8.2.3. Specialist Retailers
- 8.2.4. Online Retailers
- 8.2.5. Other Distribution Channels
- 8.1. Market Analysis, Insights and Forecast - by Product Type
- 9. South America Organic Drinks Industry Analysis, Insights and Forecast, 2020-2032
- 9.1. Market Analysis, Insights and Forecast - by Product Type
- 9.1.1. Alcoholic
- 9.1.1.1. Wine
- 9.1.1.2. Beer
- 9.1.1.3. Spirits
- 9.1.1.4. Other Alcoholic Beverages
- 9.1.2. Non-alcoholic
- 9.1.2.1. Fruit and Vegetable Juices
- 9.1.2.2. Dairy
- 9.1.2.3. Coffee and Tea
- 9.1.2.4. Other Non-alcoholic Beverages
- 9.1.1. Alcoholic
- 9.2. Market Analysis, Insights and Forecast - by Distribution Channel
- 9.2.1. Supermarkets/Hypermarkets
- 9.2.2. Convenience Stores
- 9.2.3. Specialist Retailers
- 9.2.4. Online Retailers
- 9.2.5. Other Distribution Channels
- 9.1. Market Analysis, Insights and Forecast - by Product Type
- 10. Middle East and Africa Organic Drinks Industry Analysis, Insights and Forecast, 2020-2032
- 10.1. Market Analysis, Insights and Forecast - by Product Type
- 10.1.1. Alcoholic
- 10.1.1.1. Wine
- 10.1.1.2. Beer
- 10.1.1.3. Spirits
- 10.1.1.4. Other Alcoholic Beverages
- 10.1.2. Non-alcoholic
- 10.1.2.1. Fruit and Vegetable Juices
- 10.1.2.2. Dairy
- 10.1.2.3. Coffee and Tea
- 10.1.2.4. Other Non-alcoholic Beverages
- 10.1.1. Alcoholic
- 10.2. Market Analysis, Insights and Forecast - by Distribution Channel
- 10.2.1. Supermarkets/Hypermarkets
- 10.2.2. Convenience Stores
- 10.2.3. Specialist Retailers
- 10.2.4. Online Retailers
- 10.2.5. Other Distribution Channels
- 10.1. Market Analysis, Insights and Forecast - by Product Type
- 11. Competitive Analysis
- 11.1. Global Market Share Analysis 2025
- 11.2. Company Profiles
- 11.2.1 Nestlé SA
- 11.2.1.1. Overview
- 11.2.1.2. Products
- 11.2.1.3. SWOT Analysis
- 11.2.1.4. Recent Developments
- 11.2.1.5. Financials (Based on Availability)
- 11.2.2 Lacorata Beverage LLC
- 11.2.2.1. Overview
- 11.2.2.2. Products
- 11.2.2.3. SWOT Analysis
- 11.2.2.4. Recent Developments
- 11.2.2.5. Financials (Based on Availability)
- 11.2.3 Anheuser-Busch InBev
- 11.2.3.1. Overview
- 11.2.3.2. Products
- 11.2.3.3. SWOT Analysis
- 11.2.3.4. Recent Developments
- 11.2.3.5. Financials (Based on Availability)
- 11.2.4 SYSTM Foods Inc
- 11.2.4.1. Overview
- 11.2.4.2. Products
- 11.2.4.3. SWOT Analysis
- 11.2.4.4. Recent Developments
- 11.2.4.5. Financials (Based on Availability)
- 11.2.5 PepsiCo Inc
- 11.2.5.1. Overview
- 11.2.5.2. Products
- 11.2.5.3. SWOT Analysis
- 11.2.5.4. Recent Developments
- 11.2.5.5. Financials (Based on Availability)
- 11.2.6 Whitewave Foods Company
- 11.2.6.1. Overview
- 11.2.6.2. Products
- 11.2.6.3. SWOT Analysis
- 11.2.6.4. Recent Developments
- 11.2.6.5. Financials (Based on Availability)
- 11.2.7 James White Drinks
- 11.2.7.1. Overview
- 11.2.7.2. Products
- 11.2.7.3. SWOT Analysis
- 11.2.7.4. Recent Developments
- 11.2.7.5. Financials (Based on Availability)
- 11.2.8 Bison Organic Beer
- 11.2.8.1. Overview
- 11.2.8.2. Products
- 11.2.8.3. SWOT Analysis
- 11.2.8.4. Recent Developments
- 11.2.8.5. Financials (Based on Availability)
- 11.2.9 Danone SA
- 11.2.9.1. Overview
- 11.2.9.2. Products
- 11.2.9.3. SWOT Analysis
- 11.2.9.4. Recent Developments
- 11.2.9.5. Financials (Based on Availability)
- 11.2.10 Organic Valley*List Not Exhaustive
- 11.2.10.1. Overview
- 11.2.10.2. Products
- 11.2.10.3. SWOT Analysis
- 11.2.10.4. Recent Developments
- 11.2.10.5. Financials (Based on Availability)
- 11.2.11 PS Organic LLC
- 11.2.11.1. Overview
- 11.2.11.2. Products
- 11.2.11.3. SWOT Analysis
- 11.2.11.4. Recent Developments
- 11.2.11.5. Financials (Based on Availability)
- 11.2.12 Drake's Organic Spirits LLC
- 11.2.12.1. Overview
- 11.2.12.2. Products
- 11.2.12.3. SWOT Analysis
- 11.2.12.4. Recent Developments
- 11.2.12.5. Financials (Based on Availability)
- 11.2.1 Nestlé SA
List of Figures
- Figure 1: Global Organic Drinks Industry Revenue Breakdown (Million, %) by Region 2025 & 2033
- Figure 2: Global Organic Drinks Industry Volume Breakdown (liter , %) by Region 2025 & 2033
- Figure 3: North America Organic Drinks Industry Revenue (Million), by Product Type 2025 & 2033
- Figure 4: North America Organic Drinks Industry Volume (liter ), by Product Type 2025 & 2033
- Figure 5: North America Organic Drinks Industry Revenue Share (%), by Product Type 2025 & 2033
- Figure 6: North America Organic Drinks Industry Volume Share (%), by Product Type 2025 & 2033
- Figure 7: North America Organic Drinks Industry Revenue (Million), by Distribution Channel 2025 & 2033
- Figure 8: North America Organic Drinks Industry Volume (liter ), by Distribution Channel 2025 & 2033
- Figure 9: North America Organic Drinks Industry Revenue Share (%), by Distribution Channel 2025 & 2033
- Figure 10: North America Organic Drinks Industry Volume Share (%), by Distribution Channel 2025 & 2033
- Figure 11: North America Organic Drinks Industry Revenue (Million), by Country 2025 & 2033
- Figure 12: North America Organic Drinks Industry Volume (liter ), by Country 2025 & 2033
- Figure 13: North America Organic Drinks Industry Revenue Share (%), by Country 2025 & 2033
- Figure 14: North America Organic Drinks Industry Volume Share (%), by Country 2025 & 2033
- Figure 15: Europe Organic Drinks Industry Revenue (Million), by Product Type 2025 & 2033
- Figure 16: Europe Organic Drinks Industry Volume (liter ), by Product Type 2025 & 2033
- Figure 17: Europe Organic Drinks Industry Revenue Share (%), by Product Type 2025 & 2033
- Figure 18: Europe Organic Drinks Industry Volume Share (%), by Product Type 2025 & 2033
- Figure 19: Europe Organic Drinks Industry Revenue (Million), by Distribution Channel 2025 & 2033
- Figure 20: Europe Organic Drinks Industry Volume (liter ), by Distribution Channel 2025 & 2033
- Figure 21: Europe Organic Drinks Industry Revenue Share (%), by Distribution Channel 2025 & 2033
- Figure 22: Europe Organic Drinks Industry Volume Share (%), by Distribution Channel 2025 & 2033
- Figure 23: Europe Organic Drinks Industry Revenue (Million), by Country 2025 & 2033
- Figure 24: Europe Organic Drinks Industry Volume (liter ), by Country 2025 & 2033
- Figure 25: Europe Organic Drinks Industry Revenue Share (%), by Country 2025 & 2033
- Figure 26: Europe Organic Drinks Industry Volume Share (%), by Country 2025 & 2033
- Figure 27: Asia Pacific Organic Drinks Industry Revenue (Million), by Product Type 2025 & 2033
- Figure 28: Asia Pacific Organic Drinks Industry Volume (liter ), by Product Type 2025 & 2033
- Figure 29: Asia Pacific Organic Drinks Industry Revenue Share (%), by Product Type 2025 & 2033
- Figure 30: Asia Pacific Organic Drinks Industry Volume Share (%), by Product Type 2025 & 2033
- Figure 31: Asia Pacific Organic Drinks Industry Revenue (Million), by Distribution Channel 2025 & 2033
- Figure 32: Asia Pacific Organic Drinks Industry Volume (liter ), by Distribution Channel 2025 & 2033
- Figure 33: Asia Pacific Organic Drinks Industry Revenue Share (%), by Distribution Channel 2025 & 2033
- Figure 34: Asia Pacific Organic Drinks Industry Volume Share (%), by Distribution Channel 2025 & 2033
- Figure 35: Asia Pacific Organic Drinks Industry Revenue (Million), by Country 2025 & 2033
- Figure 36: Asia Pacific Organic Drinks Industry Volume (liter ), by Country 2025 & 2033
- Figure 37: Asia Pacific Organic Drinks Industry Revenue Share (%), by Country 2025 & 2033
- Figure 38: Asia Pacific Organic Drinks Industry Volume Share (%), by Country 2025 & 2033
- Figure 39: South America Organic Drinks Industry Revenue (Million), by Product Type 2025 & 2033
- Figure 40: South America Organic Drinks Industry Volume (liter ), by Product Type 2025 & 2033
- Figure 41: South America Organic Drinks Industry Revenue Share (%), by Product Type 2025 & 2033
- Figure 42: South America Organic Drinks Industry Volume Share (%), by Product Type 2025 & 2033
- Figure 43: South America Organic Drinks Industry Revenue (Million), by Distribution Channel 2025 & 2033
- Figure 44: South America Organic Drinks Industry Volume (liter ), by Distribution Channel 2025 & 2033
- Figure 45: South America Organic Drinks Industry Revenue Share (%), by Distribution Channel 2025 & 2033
- Figure 46: South America Organic Drinks Industry Volume Share (%), by Distribution Channel 2025 & 2033
- Figure 47: South America Organic Drinks Industry Revenue (Million), by Country 2025 & 2033
- Figure 48: South America Organic Drinks Industry Volume (liter ), by Country 2025 & 2033
- Figure 49: South America Organic Drinks Industry Revenue Share (%), by Country 2025 & 2033
- Figure 50: South America Organic Drinks Industry Volume Share (%), by Country 2025 & 2033
- Figure 51: Middle East and Africa Organic Drinks Industry Revenue (Million), by Product Type 2025 & 2033
- Figure 52: Middle East and Africa Organic Drinks Industry Volume (liter ), by Product Type 2025 & 2033
- Figure 53: Middle East and Africa Organic Drinks Industry Revenue Share (%), by Product Type 2025 & 2033
- Figure 54: Middle East and Africa Organic Drinks Industry Volume Share (%), by Product Type 2025 & 2033
- Figure 55: Middle East and Africa Organic Drinks Industry Revenue (Million), by Distribution Channel 2025 & 2033
- Figure 56: Middle East and Africa Organic Drinks Industry Volume (liter ), by Distribution Channel 2025 & 2033
- Figure 57: Middle East and Africa Organic Drinks Industry Revenue Share (%), by Distribution Channel 2025 & 2033
- Figure 58: Middle East and Africa Organic Drinks Industry Volume Share (%), by Distribution Channel 2025 & 2033
- Figure 59: Middle East and Africa Organic Drinks Industry Revenue (Million), by Country 2025 & 2033
- Figure 60: Middle East and Africa Organic Drinks Industry Volume (liter ), by Country 2025 & 2033
- Figure 61: Middle East and Africa Organic Drinks Industry Revenue Share (%), by Country 2025 & 2033
- Figure 62: Middle East and Africa Organic Drinks Industry Volume Share (%), by Country 2025 & 2033
List of Tables
- Table 1: Global Organic Drinks Industry Revenue Million Forecast, by Product Type 2020 & 2033
- Table 2: Global Organic Drinks Industry Volume liter Forecast, by Product Type 2020 & 2033
- Table 3: Global Organic Drinks Industry Revenue Million Forecast, by Distribution Channel 2020 & 2033
- Table 4: Global Organic Drinks Industry Volume liter Forecast, by Distribution Channel 2020 & 2033
- Table 5: Global Organic Drinks Industry Revenue Million Forecast, by Region 2020 & 2033
- Table 6: Global Organic Drinks Industry Volume liter Forecast, by Region 2020 & 2033
- Table 7: Global Organic Drinks Industry Revenue Million Forecast, by Product Type 2020 & 2033
- Table 8: Global Organic Drinks Industry Volume liter Forecast, by Product Type 2020 & 2033
- Table 9: Global Organic Drinks Industry Revenue Million Forecast, by Distribution Channel 2020 & 2033
- Table 10: Global Organic Drinks Industry Volume liter Forecast, by Distribution Channel 2020 & 2033
- Table 11: Global Organic Drinks Industry Revenue Million Forecast, by Country 2020 & 2033
- Table 12: Global Organic Drinks Industry Volume liter Forecast, by Country 2020 & 2033
- Table 13: United States Organic Drinks Industry Revenue (Million) Forecast, by Application 2020 & 2033
- Table 14: United States Organic Drinks Industry Volume (liter ) Forecast, by Application 2020 & 2033
- Table 15: Canada Organic Drinks Industry Revenue (Million) Forecast, by Application 2020 & 2033
- Table 16: Canada Organic Drinks Industry Volume (liter ) Forecast, by Application 2020 & 2033
- Table 17: Mexico Organic Drinks Industry Revenue (Million) Forecast, by Application 2020 & 2033
- Table 18: Mexico Organic Drinks Industry Volume (liter ) Forecast, by Application 2020 & 2033
- Table 19: Rest of North America Organic Drinks Industry Revenue (Million) Forecast, by Application 2020 & 2033
- Table 20: Rest of North America Organic Drinks Industry Volume (liter ) Forecast, by Application 2020 & 2033
- Table 21: Global Organic Drinks Industry Revenue Million Forecast, by Product Type 2020 & 2033
- Table 22: Global Organic Drinks Industry Volume liter Forecast, by Product Type 2020 & 2033
- Table 23: Global Organic Drinks Industry Revenue Million Forecast, by Distribution Channel 2020 & 2033
- Table 24: Global Organic Drinks Industry Volume liter Forecast, by Distribution Channel 2020 & 2033
- Table 25: Global Organic Drinks Industry Revenue Million Forecast, by Country 2020 & 2033
- Table 26: Global Organic Drinks Industry Volume liter Forecast, by Country 2020 & 2033
- Table 27: Spain Organic Drinks Industry Revenue (Million) Forecast, by Application 2020 & 2033
- Table 28: Spain Organic Drinks Industry Volume (liter ) Forecast, by Application 2020 & 2033
- Table 29: United Kingdom Organic Drinks Industry Revenue (Million) Forecast, by Application 2020 & 2033
- Table 30: United Kingdom Organic Drinks Industry Volume (liter ) Forecast, by Application 2020 & 2033
- Table 31: Germany Organic Drinks Industry Revenue (Million) Forecast, by Application 2020 & 2033
- Table 32: Germany Organic Drinks Industry Volume (liter ) Forecast, by Application 2020 & 2033
- Table 33: France Organic Drinks Industry Revenue (Million) Forecast, by Application 2020 & 2033
- Table 34: France Organic Drinks Industry Volume (liter ) Forecast, by Application 2020 & 2033
- Table 35: Italy Organic Drinks Industry Revenue (Million) Forecast, by Application 2020 & 2033
- Table 36: Italy Organic Drinks Industry Volume (liter ) Forecast, by Application 2020 & 2033
- Table 37: Russia Organic Drinks Industry Revenue (Million) Forecast, by Application 2020 & 2033
- Table 38: Russia Organic Drinks Industry Volume (liter ) Forecast, by Application 2020 & 2033
- Table 39: Rest of Europe Organic Drinks Industry Revenue (Million) Forecast, by Application 2020 & 2033
- Table 40: Rest of Europe Organic Drinks Industry Volume (liter ) Forecast, by Application 2020 & 2033
- Table 41: Global Organic Drinks Industry Revenue Million Forecast, by Product Type 2020 & 2033
- Table 42: Global Organic Drinks Industry Volume liter Forecast, by Product Type 2020 & 2033
- Table 43: Global Organic Drinks Industry Revenue Million Forecast, by Distribution Channel 2020 & 2033
- Table 44: Global Organic Drinks Industry Volume liter Forecast, by Distribution Channel 2020 & 2033
- Table 45: Global Organic Drinks Industry Revenue Million Forecast, by Country 2020 & 2033
- Table 46: Global Organic Drinks Industry Volume liter Forecast, by Country 2020 & 2033
- Table 47: China Organic Drinks Industry Revenue (Million) Forecast, by Application 2020 & 2033
- Table 48: China Organic Drinks Industry Volume (liter ) Forecast, by Application 2020 & 2033
- Table 49: Japan Organic Drinks Industry Revenue (Million) Forecast, by Application 2020 & 2033
- Table 50: Japan Organic Drinks Industry Volume (liter ) Forecast, by Application 2020 & 2033
- Table 51: India Organic Drinks Industry Revenue (Million) Forecast, by Application 2020 & 2033
- Table 52: India Organic Drinks Industry Volume (liter ) Forecast, by Application 2020 & 2033
- Table 53: Australia Organic Drinks Industry Revenue (Million) Forecast, by Application 2020 & 2033
- Table 54: Australia Organic Drinks Industry Volume (liter ) Forecast, by Application 2020 & 2033
- Table 55: Rest of Asia Pacific Organic Drinks Industry Revenue (Million) Forecast, by Application 2020 & 2033
- Table 56: Rest of Asia Pacific Organic Drinks Industry Volume (liter ) Forecast, by Application 2020 & 2033
- Table 57: Global Organic Drinks Industry Revenue Million Forecast, by Product Type 2020 & 2033
- Table 58: Global Organic Drinks Industry Volume liter Forecast, by Product Type 2020 & 2033
- Table 59: Global Organic Drinks Industry Revenue Million Forecast, by Distribution Channel 2020 & 2033
- Table 60: Global Organic Drinks Industry Volume liter Forecast, by Distribution Channel 2020 & 2033
- Table 61: Global Organic Drinks Industry Revenue Million Forecast, by Country 2020 & 2033
- Table 62: Global Organic Drinks Industry Volume liter Forecast, by Country 2020 & 2033
- Table 63: Brazil Organic Drinks Industry Revenue (Million) Forecast, by Application 2020 & 2033
- Table 64: Brazil Organic Drinks Industry Volume (liter ) Forecast, by Application 2020 & 2033
- Table 65: Argentina Organic Drinks Industry Revenue (Million) Forecast, by Application 2020 & 2033
- Table 66: Argentina Organic Drinks Industry Volume (liter ) Forecast, by Application 2020 & 2033
- Table 67: Rest of South America Organic Drinks Industry Revenue (Million) Forecast, by Application 2020 & 2033
- Table 68: Rest of South America Organic Drinks Industry Volume (liter ) Forecast, by Application 2020 & 2033
- Table 69: Global Organic Drinks Industry Revenue Million Forecast, by Product Type 2020 & 2033
- Table 70: Global Organic Drinks Industry Volume liter Forecast, by Product Type 2020 & 2033
- Table 71: Global Organic Drinks Industry Revenue Million Forecast, by Distribution Channel 2020 & 2033
- Table 72: Global Organic Drinks Industry Volume liter Forecast, by Distribution Channel 2020 & 2033
- Table 73: Global Organic Drinks Industry Revenue Million Forecast, by Country 2020 & 2033
- Table 74: Global Organic Drinks Industry Volume liter Forecast, by Country 2020 & 2033
- Table 75: South Africa Organic Drinks Industry Revenue (Million) Forecast, by Application 2020 & 2033
- Table 76: South Africa Organic Drinks Industry Volume (liter ) Forecast, by Application 2020 & 2033
- Table 77: United Arab Emirates Organic Drinks Industry Revenue (Million) Forecast, by Application 2020 & 2033
- Table 78: United Arab Emirates Organic Drinks Industry Volume (liter ) Forecast, by Application 2020 & 2033
- Table 79: Rest of Middle East and Africa Organic Drinks Industry Revenue (Million) Forecast, by Application 2020 & 2033
- Table 80: Rest of Middle East and Africa Organic Drinks Industry Volume (liter ) Forecast, by Application 2020 & 2033
Frequently Asked Questions
1. What is the projected Compound Annual Growth Rate (CAGR) of the Organic Drinks Industry?
The projected CAGR is approximately 4.91%.
2. Which companies are prominent players in the Organic Drinks Industry?
Key companies in the market include Nestlé SA, Lacorata Beverage LLC, Anheuser-Busch InBev, SYSTM Foods Inc, PepsiCo Inc, Whitewave Foods Company, James White Drinks, Bison Organic Beer, Danone SA, Organic Valley*List Not Exhaustive, PS Organic LLC, Drake's Organic Spirits LLC.
3. What are the main segments of the Organic Drinks Industry?
The market segments include Product Type, Distribution Channel.
4. Can you provide details about the market size?
The market size is estimated to be USD 50.19 Million as of 2022.
5. What are some drivers contributing to market growth?
Growing Demand for Nutricosmetics Among Millennials; Growing Beauty and Wellness Trend.
6. What are the notable trends driving market growth?
Health-conscious consumers are increasingly demanding organic beverages.
7. Are there any restraints impacting market growth?
Stringent Government Regulations and Product Guidelines.
8. Can you provide examples of recent developments in the market?
In June 2022, the food and beverage brand, Systm Foods acquired Chameleon Organic Coffee from Nestlé USA. Chameleon Organic Coffee's product portfolio includes single-serve ready-to-drink products as well as multi-serve concentrates.
9. What pricing options are available for accessing the report?
Pricing options include single-user, multi-user, and enterprise licenses priced at USD 4750, USD 5250, and USD 8750 respectively.
10. Is the market size provided in terms of value or volume?
The market size is provided in terms of value, measured in Million and volume, measured in liter .
11. Are there any specific market keywords associated with the report?
Yes, the market keyword associated with the report is "Organic Drinks Industry," which aids in identifying and referencing the specific market segment covered.
12. How do I determine which pricing option suits my needs best?
The pricing options vary based on user requirements and access needs. Individual users may opt for single-user licenses, while businesses requiring broader access may choose multi-user or enterprise licenses for cost-effective access to the report.
13. Are there any additional resources or data provided in the Organic Drinks Industry report?
While the report offers comprehensive insights, it's advisable to review the specific contents or supplementary materials provided to ascertain if additional resources or data are available.
14. How can I stay updated on further developments or reports in the Organic Drinks Industry?
To stay informed about further developments, trends, and reports in the Organic Drinks Industry, consider subscribing to industry newsletters, following relevant companies and organizations, or regularly checking reputable industry news sources and publications.
Methodology
Step 1 - Identification of Relevant Samples Size from Population Database


Step 2 - Approaches for Defining Global Market Size (Value, Volume* & Price*)

Note*: In applicable scenarios
Step 3 - Data Sources
Primary Research
- Web Analytics
- Survey Reports
- Research Institute
- Latest Research Reports
- Opinion Leaders
Secondary Research
- Annual Reports
- White Paper
- Latest Press Release
- Industry Association
- Paid Database
- Investor Presentations

Step 4 - Data Triangulation
Involves using different sources of information in order to increase the validity of a study
These sources are likely to be stakeholders in a program - participants, other researchers, program staff, other community members, and so on.
Then we put all data in single framework & apply various statistical tools to find out the dynamic on the market.
During the analysis stage, feedback from the stakeholder groups would be compared to determine areas of agreement as well as areas of divergence