

Key Insights
The non-thermal processing market is poised for substantial expansion, fueled by consumer demand for enhanced shelf-life and superior food safety. Projected to grow at a compound annual growth rate (CAGR) of 8.53%, the market is valued at $2.07 billion in the base year 2025. This growth is propelled by escalating concerns over foodborne illnesses, the rising popularity of minimally processed foods, and the imperative for efficient, sustainable preservation methods. Technological advancements in High-Pressure Processing (HPP), Ultraviolet (UV) processing, and pulsed electric fields are key accelerators. The food and beverage sector, particularly beverages, meat, and dairy, are primary adopters, leveraging these technologies for quality preservation and extended shelf life without nutritional compromise. HPP currently leads in market share due to its proven efficacy and widespread integration. North America and Europe exhibit strong growth driven by high consumer awareness and robust regulatory support, while the Asia-Pacific region is anticipated to lead in expansion due to rapid economic development, increasing disposable incomes, and adoption of advanced preservation technologies. Market challenges include significant initial capital investment, scalability limitations for certain technologies, and the requirement for specialized operator training. Nevertheless, the persistent focus on food safety and the development of more efficient and cost-effective non-thermal processing solutions are expected to overcome these obstacles, ensuring continued market growth.
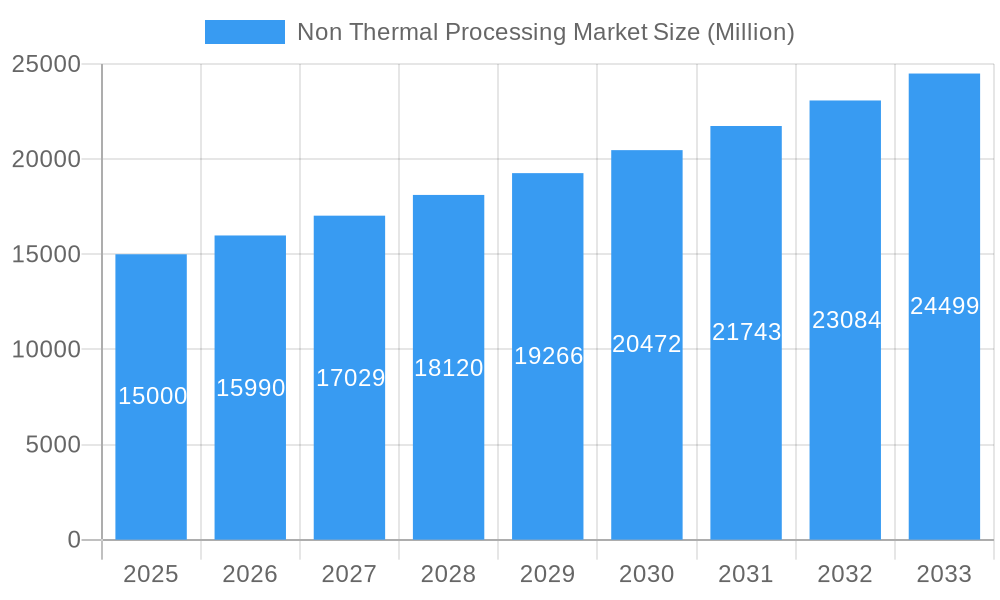
Non Thermal Processing Market Market Size (In Billion)
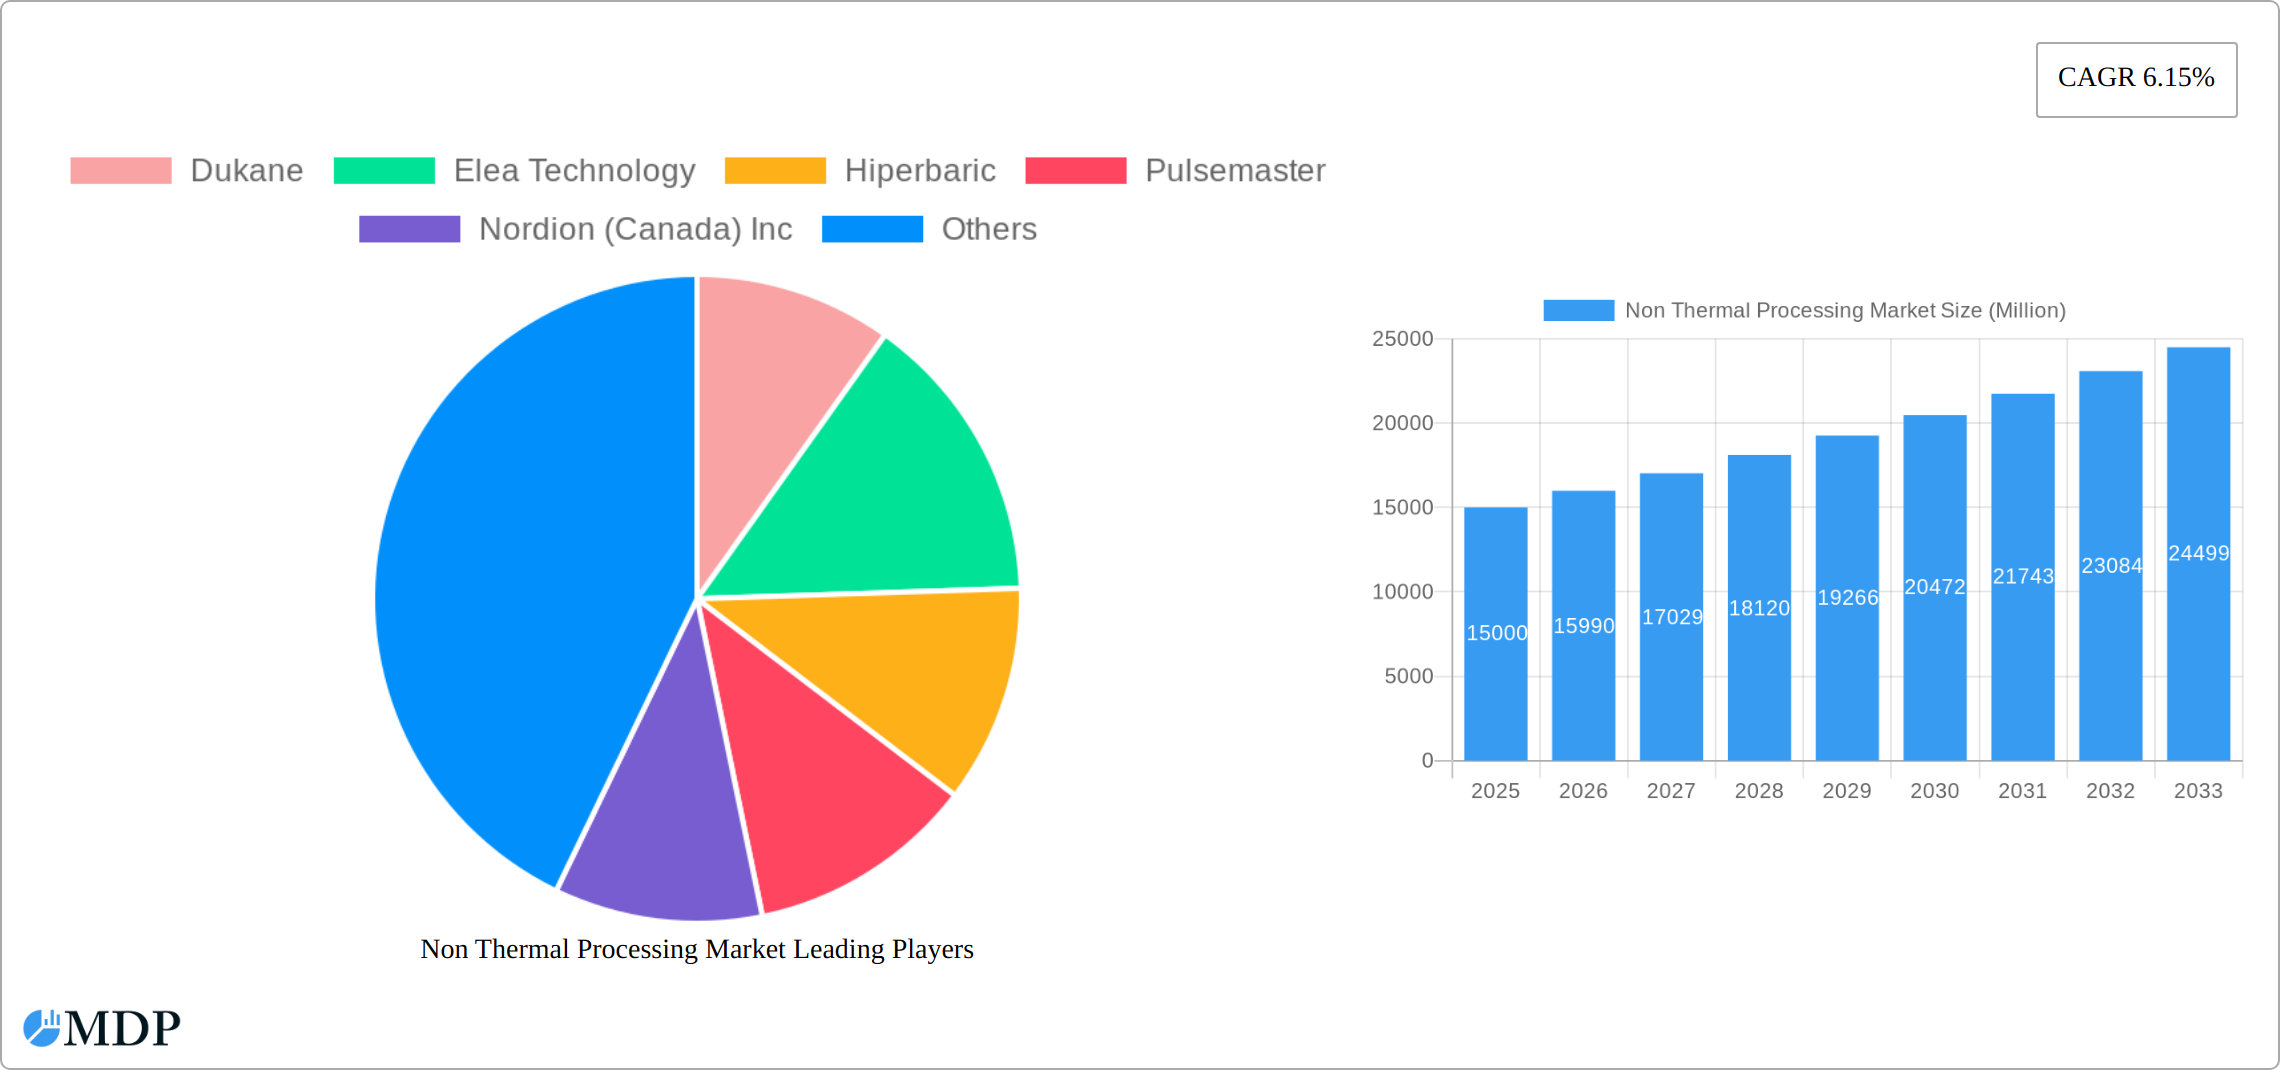
The non-thermal processing market, with a projected CAGR of 8.53% and a market size of $2.07 billion by 2025, presents significant opportunities. Anticipated growth across emerging economies in Asia-Pacific and South America is expected to balance growth in established markets like North America and Europe. A competitive landscape featuring key players such as Dukane, Elea Technology, and Hiperbaric underscores the industry's maturity and adaptability to evolving consumer preferences and technological innovations.
Non Thermal Processing Market Company Market Share
Unlocking Growth in the Non-Thermal Processing Market: A Comprehensive Report (2019-2033)
This comprehensive report provides an in-depth analysis of the Non-Thermal Processing Market, offering invaluable insights for stakeholders across the food and beverage, and pharmaceutical industries. With a detailed examination spanning the historical period (2019-2024), base year (2025), and forecast period (2025-2033), this report unveils the market's trajectory, key players, and emerging opportunities. The market is projected to reach xx Million by 2033, exhibiting a promising CAGR of xx%. This report is essential for strategic decision-making, investment analysis, and competitive benchmarking.
Non-Thermal Processing Market Market Dynamics & Concentration
The Non-Thermal Processing Market is experiencing significant growth driven by increasing consumer demand for extended shelf-life products, improved food safety, and a heightened focus on maintaining nutritional value. Market concentration is moderate, with several key players vying for market share. The market share of the top five players is estimated at xx%, leaving ample opportunity for smaller players to innovate and expand. Innovation is a key driver, fueled by advancements in High-Pressure Processing (HPP), Pulsed Electric Fields (PEF), and other non-thermal technologies. Regulatory frameworks vary across regions, presenting both opportunities and challenges. Product substitutes, such as traditional thermal processing methods, continue to exist, but the advantages of non-thermal processing in terms of quality retention are driving market adoption. End-user trends, particularly towards healthier and more convenient food options, are fueling demand. M&A activity within the market has been moderate, with approximately xx deals recorded during the study period (2019-2024), indicating a consolidation trend.
Non-Thermal Processing Market Industry Trends & Analysis
The Non-Thermal Processing Market is witnessing robust growth, projected to reach xx Million by 2033. This expansion is fueled by several factors: increasing consumer demand for extended shelf-life products, a growing focus on food safety, and the preservation of nutritional value during processing. Technological advancements, particularly in HPP and PEF technologies, are driving efficiency and reducing processing costs. Consumer preferences are shifting towards healthier and more convenient food options, which aligns perfectly with the benefits of non-thermal processing. The market is also witnessing increased adoption across various food types, with the beverages segment leading the charge. Competitive dynamics are shaping the market landscape, with key players focusing on innovation, strategic partnerships, and geographical expansion. The market penetration rate for non-thermal processing technologies is currently at xx%, projected to increase to xx% by 2033.
Leading Markets & Segments in Non Thermal Processing Market
The Non-Thermal Processing (NTP) market is experiencing robust growth, with North America currently leading the charge. This dominance stems from a confluence of factors: strong consumer demand for minimally processed foods, significant technological advancements in NTP techniques, and robust regulatory frameworks supporting food safety and innovation. Europe follows closely, presenting substantial growth potential fueled by increasing adoption of sustainable processing methods and stringent food safety regulations. Within the diverse technological landscape of NTP, High-Pressure Processing (HPP) currently commands the largest market share, attributable to its established technological maturity, widespread adoption across various food categories, and proven efficacy in extending shelf life and maintaining product quality. The fruits and vegetables segment constitutes the largest application area for NTP, reflecting the high susceptibility of these products to spoilage and the consumer preference for fresh-like attributes combined with extended shelf life. Other significant segments include ready-to-eat meals, meat and poultry, and beverages, each exhibiting specific growth drivers and unique challenges.
Key Drivers for Leading Markets/Segments:
- North America: Strong consumer awareness of food safety and health, high disposable incomes, well-established food processing infrastructure, and early adoption of innovative technologies.
- Europe: Growing emphasis on sustainable and environmentally friendly processing technologies, stringent food safety regulations driving innovation, and a well-developed market for processed foods.
- HPP Technology: Established technological maturity, proven efficacy in maintaining product quality and extending shelf life, relatively lower capital investment compared to other NTP technologies (e.g., PEF), and versatility across various food applications.
- Fruits & Vegetables: High susceptibility to spoilage, increasing consumer demand for minimally processed, fresh-like products, and a high-value proposition for extended shelf-life, leading to premium pricing opportunities.
Non-Thermal Processing Market Product Developments
Recent product innovations have focused on enhancing processing efficiency, reducing energy consumption, and expanding application capabilities. New equipment designs offer improved process control and automation. Technological trends emphasize compact and modular designs to cater to diverse production scales. Companies are striving to develop versatile systems capable of handling a wider range of food products. These developments are directly improving market fit and increasing adoption across various segments and regions.
Key Drivers of Non Thermal Processing Market Growth
The burgeoning Non-Thermal Processing market is propelled by several key factors. Continuous technological advancements in High-Pressure Processing (HPP), Pulsed Electric Fields (PEF), Ultraviolet (UV) processing, and other emerging technologies are significantly enhancing processing efficiency, reducing operational costs, and expanding application possibilities. Globally stringent food safety regulations are increasingly mandating the adoption of advanced processing methods like NTP to ensure product safety and quality, thereby boosting market demand. The simultaneous rise in consumer demand for minimally processed, healthier foods, coupled with the preference for extended shelf-life products that reduce food waste, greatly contributes to the expansion of the NTP market. Furthermore, the growing awareness of the environmental benefits associated with NTP technologies, such as reduced energy consumption compared to thermal processing, is further driving adoption.
Challenges in the Non Thermal Processing Market Market
Challenges include the relatively higher initial capital investment compared to traditional thermal processing, which can pose a barrier for small and medium-sized enterprises (SMEs). Supply chain complexities and potential limitations in scaling up production can also impede growth. Furthermore, regulatory hurdles and variations in standards across different regions add to the complexities. These challenges can collectively limit wider adoption of Non-Thermal Processing technologies. The impact on market growth is estimated at approximately xx% based on current market analysis.
Emerging Opportunities in Non Thermal Processing Market
Emerging opportunities include the application of Non-Thermal Processing technologies in new food and pharmaceutical segments, such as ready-to-eat meals and sensitive pharmaceuticals. Strategic partnerships between equipment manufacturers and food processors are fostering innovation and wider market adoption. Expansion into developing economies with high growth potential represents a considerable opportunity. Technological breakthroughs, such as improved process optimization and more cost-effective equipment, can accelerate market penetration.
Leading Players in the Non Thermal Processing Market Sector
- Dukane
- Elea Technology
- Hiperbaric
- Pulsemaster
- Nordion (Canada) Inc
- CHIC Group
- Symbios Technologies
- GRAY*STAR Inc
Key Milestones in Non Thermal Processing Market Industry
- 2020: Introduction of a new HPP system with increased processing capacity by Hiperbaric.
- 2021: Partnership between Dukane and a major food processor for large-scale HPP implementation.
- 2022: Successful pilot project demonstrating the efficacy of PEF technology in preserving the nutritional value of fruits.
- 2023: Regulatory approval for a new UV processing technology in a key market.
Strategic Outlook for Non Thermal Processing Market Market
The Non-Thermal Processing Market shows immense growth potential fueled by rising consumer demand, technological progress, and the need for enhanced food safety and quality. Strategic partnerships, investments in research and development, and expansion into new geographical markets are key for long-term success. Focus on sustainable and environmentally friendly processing methods will also shape the future of the market. The potential for market expansion into developing economies, coupled with continuous innovation, positions the Non-Thermal Processing market for sustained growth.
Non Thermal Processing Market Segmentation
-
1. Technology
- 1.1. HPP
- 1.2. UV Processing
- 1.3. Pulsed Electrical Fields
- 1.4. Ultrasonic
- 1.5. Irradiation
- 1.6. Others
-
2. Food Type
- 2.1. Beverages
- 2.2. Meat
- 2.3. Dairy
- 2.4. Fruits and Vegetables
- 2.5. Others
Non Thermal Processing Market Segmentation By Geography
-
1. North America
- 1.1. United States
- 1.2. Canada
- 1.3. Mexico
- 1.4. Rest of North America
-
2. Europe
- 2.1. Spain
- 2.2. United Kingdom
- 2.3. Germany
- 2.4. France
- 2.5. Italy
- 2.6. Russia
- 2.7. Rest of Europe
-
3. Asia Pacific
- 3.1. China
- 3.2. Japan
- 3.3. India
- 3.4. Australia
- 3.5. Rest of Asia Pacific
- 4. Rest of the World
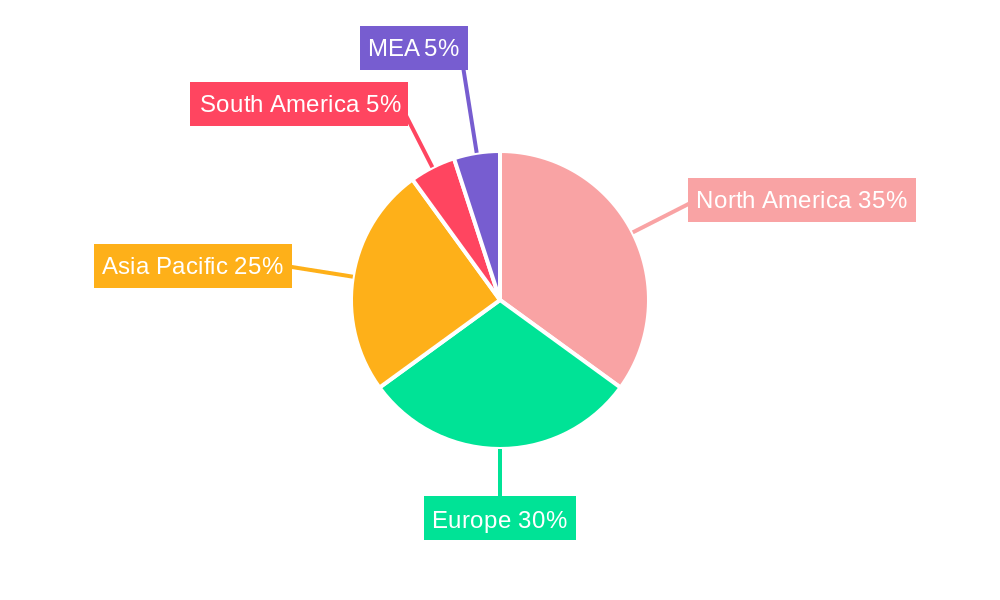
Non Thermal Processing Market Regional Market Share
Geographic Coverage of Non Thermal Processing Market
Non Thermal Processing Market REPORT HIGHLIGHTS
| Aspects | Details |
|---|---|
| Study Period | 2020-2034 |
| Base Year | 2025 |
| Estimated Year | 2026 |
| Forecast Period | 2026-2034 |
| Historical Period | 2020-2025 |
| Growth Rate | CAGR of 8.53% from 2020-2034 |
| Segmentation |
|
Table of Contents
- 1. Introduction
- 1.1. Research Scope
- 1.2. Market Segmentation
- 1.3. Research Methodology
- 1.4. Definitions and Assumptions
- 2. Executive Summary
- 2.1. Introduction
- 3. Market Dynamics
- 3.1. Introduction
- 3.2. Market Drivers
- 3.2.1. Rising Health & Wellness Trends; Strategic Initiatives By Key Players
- 3.3. Market Restrains
- 3.3.1. Cost Considerations Coupled With Availability Of Alternatives
- 3.4. Market Trends
- 3.4.1. Growing Demand For High Quality Foods
- 4. Market Factor Analysis
- 4.1. Porters Five Forces
- 4.2. Supply/Value Chain
- 4.3. PESTEL analysis
- 4.4. Market Entropy
- 4.5. Patent/Trademark Analysis
- 5. Global Non Thermal Processing Market Analysis, Insights and Forecast, 2020-2032
- 5.1. Market Analysis, Insights and Forecast - by Technology
- 5.1.1. HPP
- 5.1.2. UV Processing
- 5.1.3. Pulsed Electrical Fields
- 5.1.4. Ultrasonic
- 5.1.5. Irradiation
- 5.1.6. Others
- 5.2. Market Analysis, Insights and Forecast - by Food Type
- 5.2.1. Beverages
- 5.2.2. Meat
- 5.2.3. Dairy
- 5.2.4. Fruits and Vegetables
- 5.2.5. Others
- 5.3. Market Analysis, Insights and Forecast - by Region
- 5.3.1. North America
- 5.3.2. Europe
- 5.3.3. Asia Pacific
- 5.3.4. Rest of the World
- 5.1. Market Analysis, Insights and Forecast - by Technology
- 6. North America Non Thermal Processing Market Analysis, Insights and Forecast, 2020-2032
- 6.1. Market Analysis, Insights and Forecast - by Technology
- 6.1.1. HPP
- 6.1.2. UV Processing
- 6.1.3. Pulsed Electrical Fields
- 6.1.4. Ultrasonic
- 6.1.5. Irradiation
- 6.1.6. Others
- 6.2. Market Analysis, Insights and Forecast - by Food Type
- 6.2.1. Beverages
- 6.2.2. Meat
- 6.2.3. Dairy
- 6.2.4. Fruits and Vegetables
- 6.2.5. Others
- 6.1. Market Analysis, Insights and Forecast - by Technology
- 7. Europe Non Thermal Processing Market Analysis, Insights and Forecast, 2020-2032
- 7.1. Market Analysis, Insights and Forecast - by Technology
- 7.1.1. HPP
- 7.1.2. UV Processing
- 7.1.3. Pulsed Electrical Fields
- 7.1.4. Ultrasonic
- 7.1.5. Irradiation
- 7.1.6. Others
- 7.2. Market Analysis, Insights and Forecast - by Food Type
- 7.2.1. Beverages
- 7.2.2. Meat
- 7.2.3. Dairy
- 7.2.4. Fruits and Vegetables
- 7.2.5. Others
- 7.1. Market Analysis, Insights and Forecast - by Technology
- 8. Asia Pacific Non Thermal Processing Market Analysis, Insights and Forecast, 2020-2032
- 8.1. Market Analysis, Insights and Forecast - by Technology
- 8.1.1. HPP
- 8.1.2. UV Processing
- 8.1.3. Pulsed Electrical Fields
- 8.1.4. Ultrasonic
- 8.1.5. Irradiation
- 8.1.6. Others
- 8.2. Market Analysis, Insights and Forecast - by Food Type
- 8.2.1. Beverages
- 8.2.2. Meat
- 8.2.3. Dairy
- 8.2.4. Fruits and Vegetables
- 8.2.5. Others
- 8.1. Market Analysis, Insights and Forecast - by Technology
- 9. Rest of the World Non Thermal Processing Market Analysis, Insights and Forecast, 2020-2032
- 9.1. Market Analysis, Insights and Forecast - by Technology
- 9.1.1. HPP
- 9.1.2. UV Processing
- 9.1.3. Pulsed Electrical Fields
- 9.1.4. Ultrasonic
- 9.1.5. Irradiation
- 9.1.6. Others
- 9.2. Market Analysis, Insights and Forecast - by Food Type
- 9.2.1. Beverages
- 9.2.2. Meat
- 9.2.3. Dairy
- 9.2.4. Fruits and Vegetables
- 9.2.5. Others
- 9.1. Market Analysis, Insights and Forecast - by Technology
- 10. Competitive Analysis
- 10.1. Global Market Share Analysis 2025
- 10.2. Company Profiles
- 10.2.1 Dukane
- 10.2.1.1. Overview
- 10.2.1.2. Products
- 10.2.1.3. SWOT Analysis
- 10.2.1.4. Recent Developments
- 10.2.1.5. Financials (Based on Availability)
- 10.2.2 Elea Technology
- 10.2.2.1. Overview
- 10.2.2.2. Products
- 10.2.2.3. SWOT Analysis
- 10.2.2.4. Recent Developments
- 10.2.2.5. Financials (Based on Availability)
- 10.2.3 Hiperbaric
- 10.2.3.1. Overview
- 10.2.3.2. Products
- 10.2.3.3. SWOT Analysis
- 10.2.3.4. Recent Developments
- 10.2.3.5. Financials (Based on Availability)
- 10.2.4 Pulsemaster
- 10.2.4.1. Overview
- 10.2.4.2. Products
- 10.2.4.3. SWOT Analysis
- 10.2.4.4. Recent Developments
- 10.2.4.5. Financials (Based on Availability)
- 10.2.5 Nordion (Canada) Inc
- 10.2.5.1. Overview
- 10.2.5.2. Products
- 10.2.5.3. SWOT Analysis
- 10.2.5.4. Recent Developments
- 10.2.5.5. Financials (Based on Availability)
- 10.2.6 CHIC Group
- 10.2.6.1. Overview
- 10.2.6.2. Products
- 10.2.6.3. SWOT Analysis
- 10.2.6.4. Recent Developments
- 10.2.6.5. Financials (Based on Availability)
- 10.2.7 Symbios Technologies
- 10.2.7.1. Overview
- 10.2.7.2. Products
- 10.2.7.3. SWOT Analysis
- 10.2.7.4. Recent Developments
- 10.2.7.5. Financials (Based on Availability)
- 10.2.8 GRAY*STAR Inc *List Not Exhaustive
- 10.2.8.1. Overview
- 10.2.8.2. Products
- 10.2.8.3. SWOT Analysis
- 10.2.8.4. Recent Developments
- 10.2.8.5. Financials (Based on Availability)
- 10.2.1 Dukane
List of Figures
- Figure 1: Global Non Thermal Processing Market Revenue Breakdown (billion, %) by Region 2025 & 2033
- Figure 2: North America Non Thermal Processing Market Revenue (billion), by Technology 2025 & 2033
- Figure 3: North America Non Thermal Processing Market Revenue Share (%), by Technology 2025 & 2033
- Figure 4: North America Non Thermal Processing Market Revenue (billion), by Food Type 2025 & 2033
- Figure 5: North America Non Thermal Processing Market Revenue Share (%), by Food Type 2025 & 2033
- Figure 6: North America Non Thermal Processing Market Revenue (billion), by Country 2025 & 2033
- Figure 7: North America Non Thermal Processing Market Revenue Share (%), by Country 2025 & 2033
- Figure 8: Europe Non Thermal Processing Market Revenue (billion), by Technology 2025 & 2033
- Figure 9: Europe Non Thermal Processing Market Revenue Share (%), by Technology 2025 & 2033
- Figure 10: Europe Non Thermal Processing Market Revenue (billion), by Food Type 2025 & 2033
- Figure 11: Europe Non Thermal Processing Market Revenue Share (%), by Food Type 2025 & 2033
- Figure 12: Europe Non Thermal Processing Market Revenue (billion), by Country 2025 & 2033
- Figure 13: Europe Non Thermal Processing Market Revenue Share (%), by Country 2025 & 2033
- Figure 14: Asia Pacific Non Thermal Processing Market Revenue (billion), by Technology 2025 & 2033
- Figure 15: Asia Pacific Non Thermal Processing Market Revenue Share (%), by Technology 2025 & 2033
- Figure 16: Asia Pacific Non Thermal Processing Market Revenue (billion), by Food Type 2025 & 2033
- Figure 17: Asia Pacific Non Thermal Processing Market Revenue Share (%), by Food Type 2025 & 2033
- Figure 18: Asia Pacific Non Thermal Processing Market Revenue (billion), by Country 2025 & 2033
- Figure 19: Asia Pacific Non Thermal Processing Market Revenue Share (%), by Country 2025 & 2033
- Figure 20: Rest of the World Non Thermal Processing Market Revenue (billion), by Technology 2025 & 2033
- Figure 21: Rest of the World Non Thermal Processing Market Revenue Share (%), by Technology 2025 & 2033
- Figure 22: Rest of the World Non Thermal Processing Market Revenue (billion), by Food Type 2025 & 2033
- Figure 23: Rest of the World Non Thermal Processing Market Revenue Share (%), by Food Type 2025 & 2033
- Figure 24: Rest of the World Non Thermal Processing Market Revenue (billion), by Country 2025 & 2033
- Figure 25: Rest of the World Non Thermal Processing Market Revenue Share (%), by Country 2025 & 2033
List of Tables
- Table 1: Global Non Thermal Processing Market Revenue billion Forecast, by Technology 2020 & 2033
- Table 2: Global Non Thermal Processing Market Revenue billion Forecast, by Food Type 2020 & 2033
- Table 3: Global Non Thermal Processing Market Revenue billion Forecast, by Region 2020 & 2033
- Table 4: Global Non Thermal Processing Market Revenue billion Forecast, by Technology 2020 & 2033
- Table 5: Global Non Thermal Processing Market Revenue billion Forecast, by Food Type 2020 & 2033
- Table 6: Global Non Thermal Processing Market Revenue billion Forecast, by Country 2020 & 2033
- Table 7: United States Non Thermal Processing Market Revenue (billion) Forecast, by Application 2020 & 2033
- Table 8: Canada Non Thermal Processing Market Revenue (billion) Forecast, by Application 2020 & 2033
- Table 9: Mexico Non Thermal Processing Market Revenue (billion) Forecast, by Application 2020 & 2033
- Table 10: Rest of North America Non Thermal Processing Market Revenue (billion) Forecast, by Application 2020 & 2033
- Table 11: Global Non Thermal Processing Market Revenue billion Forecast, by Technology 2020 & 2033
- Table 12: Global Non Thermal Processing Market Revenue billion Forecast, by Food Type 2020 & 2033
- Table 13: Global Non Thermal Processing Market Revenue billion Forecast, by Country 2020 & 2033
- Table 14: Spain Non Thermal Processing Market Revenue (billion) Forecast, by Application 2020 & 2033
- Table 15: United Kingdom Non Thermal Processing Market Revenue (billion) Forecast, by Application 2020 & 2033
- Table 16: Germany Non Thermal Processing Market Revenue (billion) Forecast, by Application 2020 & 2033
- Table 17: France Non Thermal Processing Market Revenue (billion) Forecast, by Application 2020 & 2033
- Table 18: Italy Non Thermal Processing Market Revenue (billion) Forecast, by Application 2020 & 2033
- Table 19: Russia Non Thermal Processing Market Revenue (billion) Forecast, by Application 2020 & 2033
- Table 20: Rest of Europe Non Thermal Processing Market Revenue (billion) Forecast, by Application 2020 & 2033
- Table 21: Global Non Thermal Processing Market Revenue billion Forecast, by Technology 2020 & 2033
- Table 22: Global Non Thermal Processing Market Revenue billion Forecast, by Food Type 2020 & 2033
- Table 23: Global Non Thermal Processing Market Revenue billion Forecast, by Country 2020 & 2033
- Table 24: China Non Thermal Processing Market Revenue (billion) Forecast, by Application 2020 & 2033
- Table 25: Japan Non Thermal Processing Market Revenue (billion) Forecast, by Application 2020 & 2033
- Table 26: India Non Thermal Processing Market Revenue (billion) Forecast, by Application 2020 & 2033
- Table 27: Australia Non Thermal Processing Market Revenue (billion) Forecast, by Application 2020 & 2033
- Table 28: Rest of Asia Pacific Non Thermal Processing Market Revenue (billion) Forecast, by Application 2020 & 2033
- Table 29: Global Non Thermal Processing Market Revenue billion Forecast, by Technology 2020 & 2033
- Table 30: Global Non Thermal Processing Market Revenue billion Forecast, by Food Type 2020 & 2033
- Table 31: Global Non Thermal Processing Market Revenue billion Forecast, by Country 2020 & 2033
Frequently Asked Questions
1. What is the projected Compound Annual Growth Rate (CAGR) of the Non Thermal Processing Market?
The projected CAGR is approximately 8.53%.
2. Which companies are prominent players in the Non Thermal Processing Market?
Key companies in the market include Dukane, Elea Technology, Hiperbaric, Pulsemaster, Nordion (Canada) Inc, CHIC Group, Symbios Technologies, GRAY*STAR Inc *List Not Exhaustive.
3. What are the main segments of the Non Thermal Processing Market?
The market segments include Technology, Food Type.
4. Can you provide details about the market size?
The market size is estimated to be USD 2.07 billion as of 2022.
5. What are some drivers contributing to market growth?
Rising Health & Wellness Trends; Strategic Initiatives By Key Players.
6. What are the notable trends driving market growth?
Growing Demand For High Quality Foods.
7. Are there any restraints impacting market growth?
Cost Considerations Coupled With Availability Of Alternatives.
8. Can you provide examples of recent developments in the market?
N/A
9. What pricing options are available for accessing the report?
Pricing options include single-user, multi-user, and enterprise licenses priced at USD 4750, USD 5250, and USD 8750 respectively.
10. Is the market size provided in terms of value or volume?
The market size is provided in terms of value, measured in billion.
11. Are there any specific market keywords associated with the report?
Yes, the market keyword associated with the report is "Non Thermal Processing Market," which aids in identifying and referencing the specific market segment covered.
12. How do I determine which pricing option suits my needs best?
The pricing options vary based on user requirements and access needs. Individual users may opt for single-user licenses, while businesses requiring broader access may choose multi-user or enterprise licenses for cost-effective access to the report.
13. Are there any additional resources or data provided in the Non Thermal Processing Market report?
While the report offers comprehensive insights, it's advisable to review the specific contents or supplementary materials provided to ascertain if additional resources or data are available.
14. How can I stay updated on further developments or reports in the Non Thermal Processing Market?
To stay informed about further developments, trends, and reports in the Non Thermal Processing Market, consider subscribing to industry newsletters, following relevant companies and organizations, or regularly checking reputable industry news sources and publications.
Methodology
Step 1 - Identification of Relevant Samples Size from Population Database


Step 2 - Approaches for Defining Global Market Size (Value, Volume* & Price*)

Note*: In applicable scenarios
Step 3 - Data Sources
Primary Research
- Web Analytics
- Survey Reports
- Research Institute
- Latest Research Reports
- Opinion Leaders
Secondary Research
- Annual Reports
- White Paper
- Latest Press Release
- Industry Association
- Paid Database
- Investor Presentations

Step 4 - Data Triangulation
Involves using different sources of information in order to increase the validity of a study
These sources are likely to be stakeholders in a program - participants, other researchers, program staff, other community members, and so on.
Then we put all data in single framework & apply various statistical tools to find out the dynamic on the market.
During the analysis stage, feedback from the stakeholder groups would be compared to determine areas of agreement as well as areas of divergence