

Key Insights
The global Natural Food Additives market is poised for robust expansion, with an estimated market size of $128.14 billion in 2025. This growth trajectory is underpinned by a projected Compound Annual Growth Rate (CAGR) of 5.6% from 2019 to 2033, indicating sustained and significant market development. Consumer preference for healthier, cleaner-label products is a primary driver, pushing manufacturers to replace synthetic additives with natural alternatives derived from sources like fruits, vegetables, nuts, grains, and herbs. This trend is particularly pronounced in the food and beverage industries, where natural colors, flavors, and preservatives are increasingly sought after to meet evolving consumer demands for transparency and perceived health benefits. The market's expansion is also fueled by advancements in extraction technologies, enabling more efficient and cost-effective production of a wider range of natural additives.
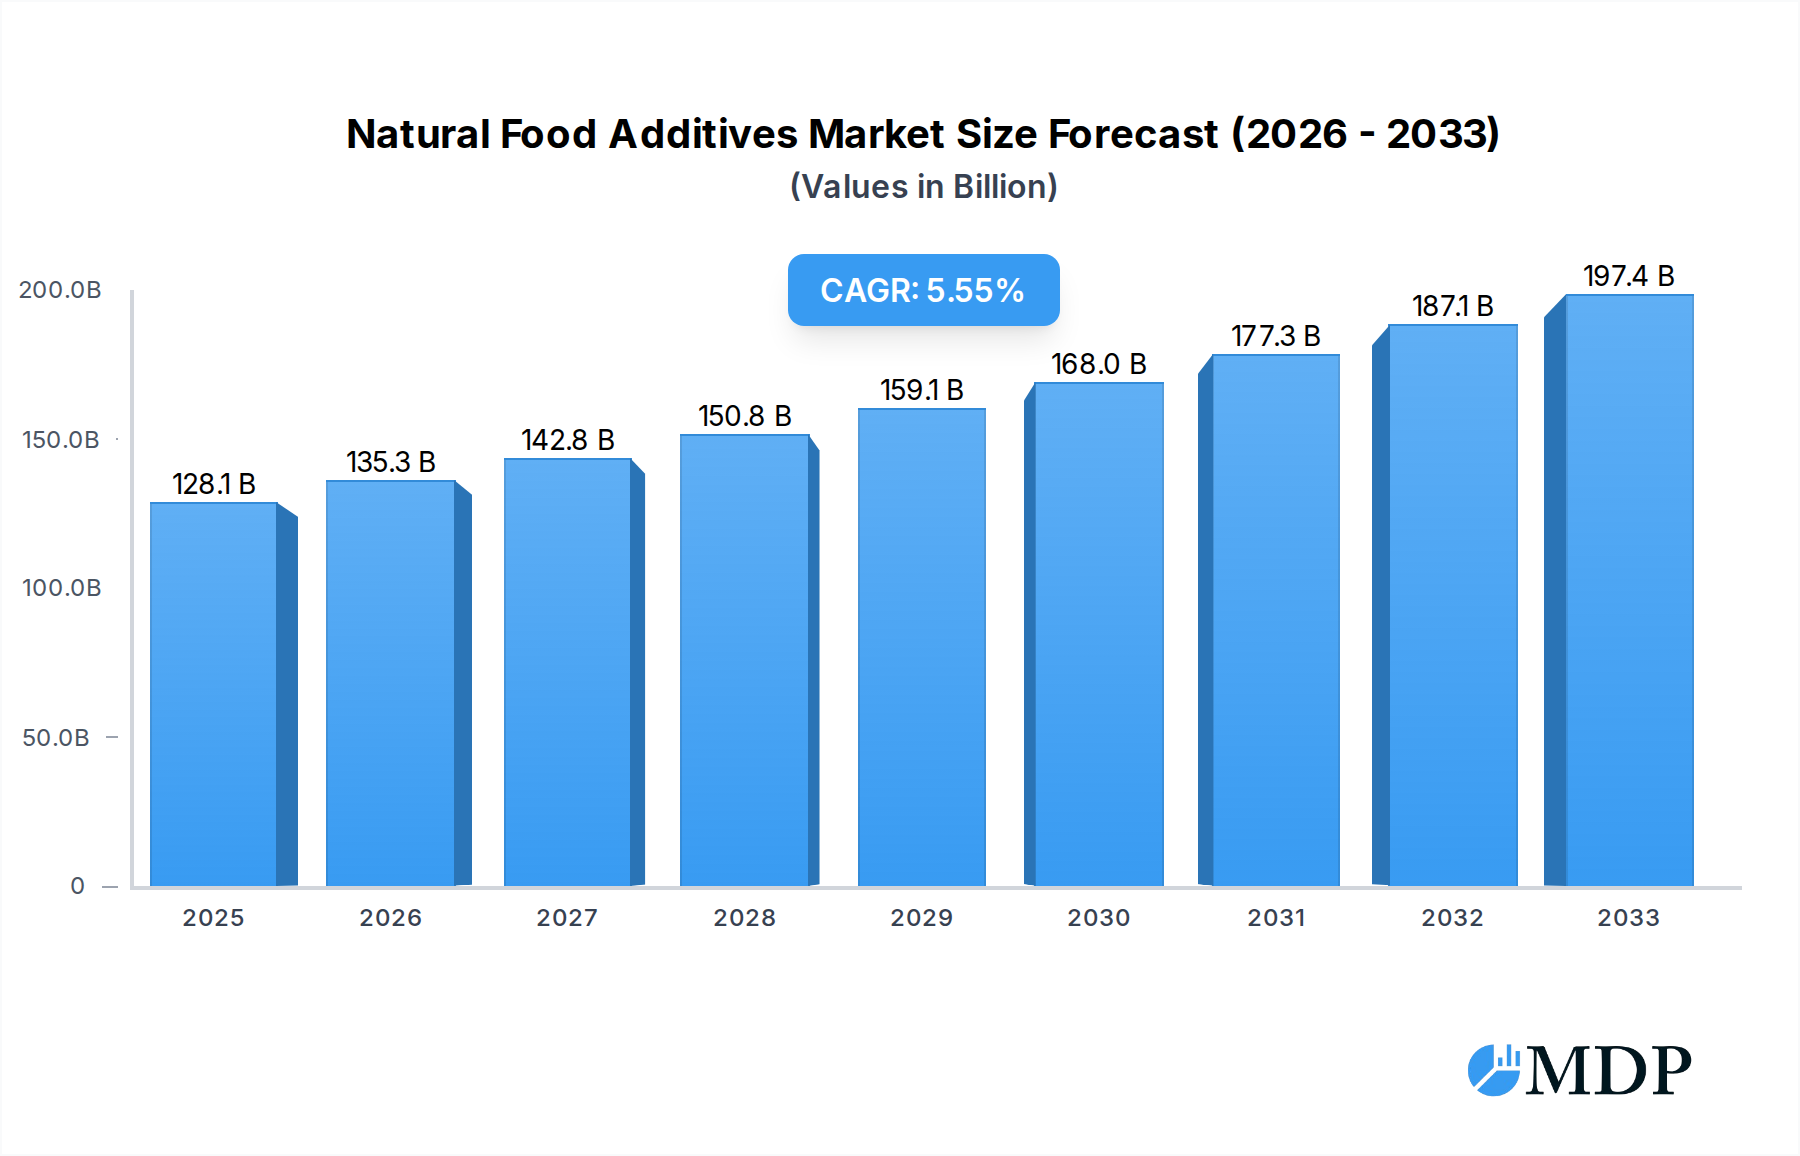
Natural Food Additives Market Size (In Billion)
The market's expansion is anticipated to be influenced by several key drivers. Growing health consciousness among consumers, coupled with increasing regulatory support for natural ingredients, provides a fertile ground for market growth. The demand for naturally derived colors and flavors, in particular, is expected to surge as consumers actively seek to avoid artificial ingredients. While the market presents substantial opportunities, certain restraints may temper its growth. The relatively higher cost of natural additives compared to their synthetic counterparts, along with potential challenges in achieving consistent quality and stability, could pose hurdles. However, ongoing research and development, along with economies of scale, are expected to mitigate these concerns over time. Key segments within the market include applications in food and beverages, with distinct types such as nuts extract, grains and pulses extract, and herbs and spices extract playing crucial roles in shaping market dynamics and innovation.

Natural Food Additives Company Market Share
Natural Food Additives Market Report: Unlocking Sustainable Growth & Consumer Demand
This comprehensive report, Natural Food Additives: Market Dynamics, Trends, and Opportunities 2025-2033, provides an in-depth analysis of the global natural food additives market, projected to reach hundreds of billions in value by 2033. The study encompasses a critical Study Period (2019–2033), with a Base Year (2025) and Forecast Period (2025–2033), building upon the Historical Period (2019–2024). It offers actionable insights for industry stakeholders, including manufacturers, suppliers, formulators, and investors, navigating the burgeoning demand for clean-label ingredients. Explore market concentration, innovation drivers, regulatory frameworks, and end-user trends, alongside detailed analysis of market growth drivers, technological disruptions, consumer preferences, and competitive dynamics. Discover leading regional markets, segment dominance, product innovations, growth catalysts, market challenges, and emerging opportunities. This report features key players like Kanegrade, GNT International, Kalsec, Naturex, RAHO, Sensient Flavors, Dohler Group, Vinayak Ingredients, Puhua Stevia Sugar Development, and Nanyang Plant Essence Extraction, alongside critical industry milestones and strategic outlooks.
Natural Food Additives Market Dynamics & Concentration
The global natural food additives market exhibits a moderately consolidated landscape, with a few key players holding substantial market share, estimated at billions of dollars in the base year 2025. Innovation remains a paramount driver, fueled by continuous research and development into novel extraction techniques and the identification of new botanical sources for additives. Stringent regulatory frameworks, particularly in North America and Europe, are shaping product development and market entry, emphasizing safety, efficacy, and transparent labeling. The increasing consumer preference for clean-label products and the avoidance of synthetic ingredients are also significant forces influencing market dynamics. Product substitutes, while present, are becoming less competitive as natural alternatives gain consumer trust and regulatory acceptance. End-user trends point towards a growing demand for functional natural food additives that offer health benefits beyond basic preservation or coloring. Mergers and acquisitions (M&A) activities are expected to continue, with an estimated xx significant deals projected within the forecast period, aimed at expanding product portfolios, market reach, and technological capabilities. These strategic moves are crucial for larger entities to consolidate their position and for smaller innovators to gain access to broader distribution networks.
Natural Food Additives Industry Trends & Analysis
The natural food additives industry is experiencing robust growth, driven by a confluence of factors that are fundamentally reshaping the food and beverage landscape. The primary growth driver is the escalating consumer demand for healthier and more transparently sourced food products. This "clean label" movement, characterized by a preference for ingredients that are recognizable and perceived as natural, has pushed manufacturers to reformulate their products, leading to an increased adoption of natural alternatives to synthetic additives. The projected Compound Annual Growth Rate (CAGR) for the natural food additives market is estimated at a strong xx% between 2025 and 2033, indicating significant expansion. Market penetration of natural food additives is steadily increasing across various food and beverage categories, moving beyond niche applications to mainstream products. Technological disruptions are playing a pivotal role, with advancements in extraction, purification, and encapsulation technologies enabling the efficient and cost-effective production of a wider range of natural additives with improved stability and functionality. For instance, supercritical fluid extraction and enzyme-assisted extraction are gaining traction for their ability to preserve the delicate compounds in botanicals. Consumer preferences are evolving rapidly, with a particular focus on natural colorants derived from fruits, vegetables, and spices, as well as natural preservatives that offer extended shelf life without compromising consumer perception of health. This has spurred innovation in areas like anthocyanins, carotenoids, and microbial-based preservatives. The competitive dynamics within the industry are intensifying, with established players investing heavily in R&D and strategic partnerships to secure a strong market position. New entrants are also emerging, particularly those specializing in niche natural ingredients or innovative processing techniques. The growing awareness of the potential health benefits associated with certain natural additives, such as antioxidant or antimicrobial properties, is further fueling market growth. Regulatory support for natural ingredients, where applicable, also contributes to market expansion by creating a more favorable environment for their adoption. The global natural food additives market is projected to reach hundreds of billions by the end of the forecast period, demonstrating its significant economic impact and ongoing evolution.
Leading Markets & Segments in Natural Food Additives
The Asia Pacific region is emerging as a dominant market for natural food additives, driven by a rapidly expanding middle class with increasing disposable incomes and a growing awareness of health and wellness. China, in particular, is a significant contributor due to its vast population and a burgeoning food processing industry actively seeking natural ingredients to meet domestic and international demand. Economic policies promoting food safety and ingredient traceability further bolster the market in this region. Within this dynamic region, the Food application segment commands the largest market share, accounting for an estimated xx% of the total market value in 2025. This dominance is attributed to the widespread integration of natural additives across a broad spectrum of food products, including bakery, dairy, confectionery, and savory items.
Key drivers for the dominance of the food segment include:
- Consumer Demand for Healthier Options: Consumers are actively seeking food products with fewer artificial ingredients and perceived health benefits, leading manufacturers to prioritize natural additives.
- Product Innovation: The continuous introduction of new food products incorporating natural colors, flavors, and preservatives fuels demand.
- Regulatory Push for Clean Labels: Governments are increasingly encouraging or mandating clearer ingredient labeling, pushing food manufacturers towards natural alternatives.
- Advancements in Ingredient Functionality: Improved extraction and processing technologies have enhanced the performance and stability of natural food additives, making them viable replacements for synthetic counterparts.
Among the Type segments, Herbs and Spices Extract holds a significant position. This category is valued at billions and is projected to witness substantial growth due to its versatile applications in flavoring, coloring, and preservation. The inherent health properties associated with many herbs and spices further amplify their appeal. The Nuts Extract segment also shows strong potential, driven by the rising popularity of nut-based flavors and functional ingredients. The Grains and Pulses Extract segment, though currently smaller, is gaining traction with the growing trend of plant-based diets and the demand for natural starches and fibers. The "Others" segment, encompassing a diverse range of botanical extracts and natural compounds, is also expected to contribute to market expansion as research uncovers new applications.
Natural Food Additives Product Developments
Product innovation in natural food additives is characterized by a focus on enhancing functionality, stability, and cost-effectiveness. Key developments include novel extraction techniques that yield higher concentrations of desired compounds with minimal degradation, such as advanced methods for isolating natural pigments like anthocyanins and carotenoids. Furthermore, there is a significant trend towards developing natural preservatives derived from botanical sources that offer broad-spectrum antimicrobial activity, addressing the growing concern over food spoilage and extending shelf life without synthetic chemicals. Encapsulation technologies are also playing a crucial role in protecting sensitive natural additives from environmental factors and improving their controlled release in food matrices. These innovations provide manufacturers with competitive advantages by enabling them to create cleaner labels, meet evolving consumer demands, and adhere to stricter regulatory standards.
Key Drivers of Natural Food Additives Growth
The growth of the natural food additives market is propelled by several interconnected factors. Consumer demand for clean-label products is the foremost driver, with an increasing preference for ingredients perceived as natural and healthy. Technological advancements in extraction and processing are enabling the efficient and cost-effective production of a wider array of natural additives, making them more accessible and competitive. Supportive regulatory frameworks, which encourage transparency and the use of safe, natural ingredients, also play a crucial role. For example, regulations in regions like the EU and North America are progressively favoring naturally derived ingredients. Furthermore, the rising awareness of the health benefits associated with natural additives, such as antioxidant and anti-inflammatory properties, is influencing purchasing decisions and driving market demand.
Challenges in the Natural Food Additives Market
Despite the robust growth, the natural food additives market faces several significant challenges. Variability in raw material supply and quality due to agricultural factors and seasonal availability can impact consistency and cost. Higher production costs compared to synthetic alternatives can also be a barrier for some manufacturers, especially for large-scale applications. Regulatory hurdles and evolving standards across different regions can create complexities in market entry and product compliance. Limited shelf life and stability of some natural additives compared to their synthetic counterparts require ongoing innovation in processing and formulation. Finally, intense competition from established synthetic additive providers and emerging natural ingredient suppliers necessitates continuous investment in research and development to maintain a competitive edge.
Emerging Opportunities in Natural Food Additives
Emerging opportunities in the natural food additives market are abundant, driven by technological breakthroughs and evolving consumer needs. The development of novel natural sweeteners derived from sources like stevia and monk fruit, offering reduced-calorie alternatives to sugar, presents a significant growth avenue. The expanding demand for plant-based foods and beverages is creating opportunities for natural emulsifiers, stabilizers, and preservatives derived from botanical sources. Strategic partnerships between ingredient suppliers and food manufacturers are accelerating the adoption of these innovative solutions. Furthermore, geographic expansion into emerging economies where clean-label trends are gaining momentum offers substantial untapped market potential.
Leading Players in the Natural Food Additives Sector
- Kanegrade
- GNT International
- Kalsec
- Naturex
- RAHO
- Sensient Flavors
- Dohler Group
- Vinayak Ingredients
- Puhua Stevia Sugar Development
- Nanyang Plant Essence Extraction
Key Milestones in Natural Food Additives Industry
- 2019: Increased consumer demand for "free-from" labels spurs initial reformulations with natural alternatives.
- 2020: Advancements in supercritical CO2 extraction technology lead to higher purity and yield of botanical extracts.
- 2021: Significant M&A activity as larger food ingredient companies acquire specialized natural additive providers, valued in the billions.
- 2022: Enhanced regulatory scrutiny on artificial ingredients in key markets like the US and EU further boosts adoption of natural options.
- 2023: Development of new natural food coloring agents with improved light and heat stability enters the market.
- 2024: Growing interest in functional natural additives with proven health benefits like gut health support gains traction.
- 2025: Launch of innovative natural preservatives offering extended shelf life for dairy and bakery products.
- 2026: Projected introduction of cost-effective natural sweetener blends catering to a wider demographic.
- 2027: Expansion of natural flavor profiles derived from exotic fruits and botanicals to cater to global palates.
- 2028-2033: Continued innovation in bio-based ingredients and sustainable sourcing practices to meet long-term market demand.
Strategic Outlook for Natural Food Additives Market
The strategic outlook for the natural food additives market remains exceptionally positive, driven by enduring consumer preferences for health and wellness. Key growth accelerators include the continuous innovation in extraction and processing technologies that enhance the functionality and cost-effectiveness of natural ingredients, making them more accessible to a broader range of food and beverage applications. Strategic partnerships between ingredient manufacturers and food brands will be crucial for co-creating and launching new products that align with clean-label demands. Furthermore, the increasing global awareness of sustainability and ethical sourcing will provide a competitive advantage to companies that prioritize environmentally responsible practices throughout their supply chains. The market is poised for sustained expansion, offering significant opportunities for stakeholders willing to invest in research, development, and strategic market penetration.
Natural Food Additives Segmentation
-
1. Application
- 1.1. Food
- 1.2. Beverage
-
2. Type
- 2.1. Nuts Extract
- 2.2. Grains and Pulses Extract
- 2.3. Herbs and Spices Extract
- 2.4. Others
Natural Food Additives Segmentation By Geography
-
1. North America
- 1.1. United States
- 1.2. Canada
- 1.3. Mexico
-
2. South America
- 2.1. Brazil
- 2.2. Argentina
- 2.3. Rest of South America
-
3. Europe
- 3.1. United Kingdom
- 3.2. Germany
- 3.3. France
- 3.4. Italy
- 3.5. Spain
- 3.6. Russia
- 3.7. Benelux
- 3.8. Nordics
- 3.9. Rest of Europe
-
4. Middle East & Africa
- 4.1. Turkey
- 4.2. Israel
- 4.3. GCC
- 4.4. North Africa
- 4.5. South Africa
- 4.6. Rest of Middle East & Africa
-
5. Asia Pacific
- 5.1. China
- 5.2. India
- 5.3. Japan
- 5.4. South Korea
- 5.5. ASEAN
- 5.6. Oceania
- 5.7. Rest of Asia Pacific
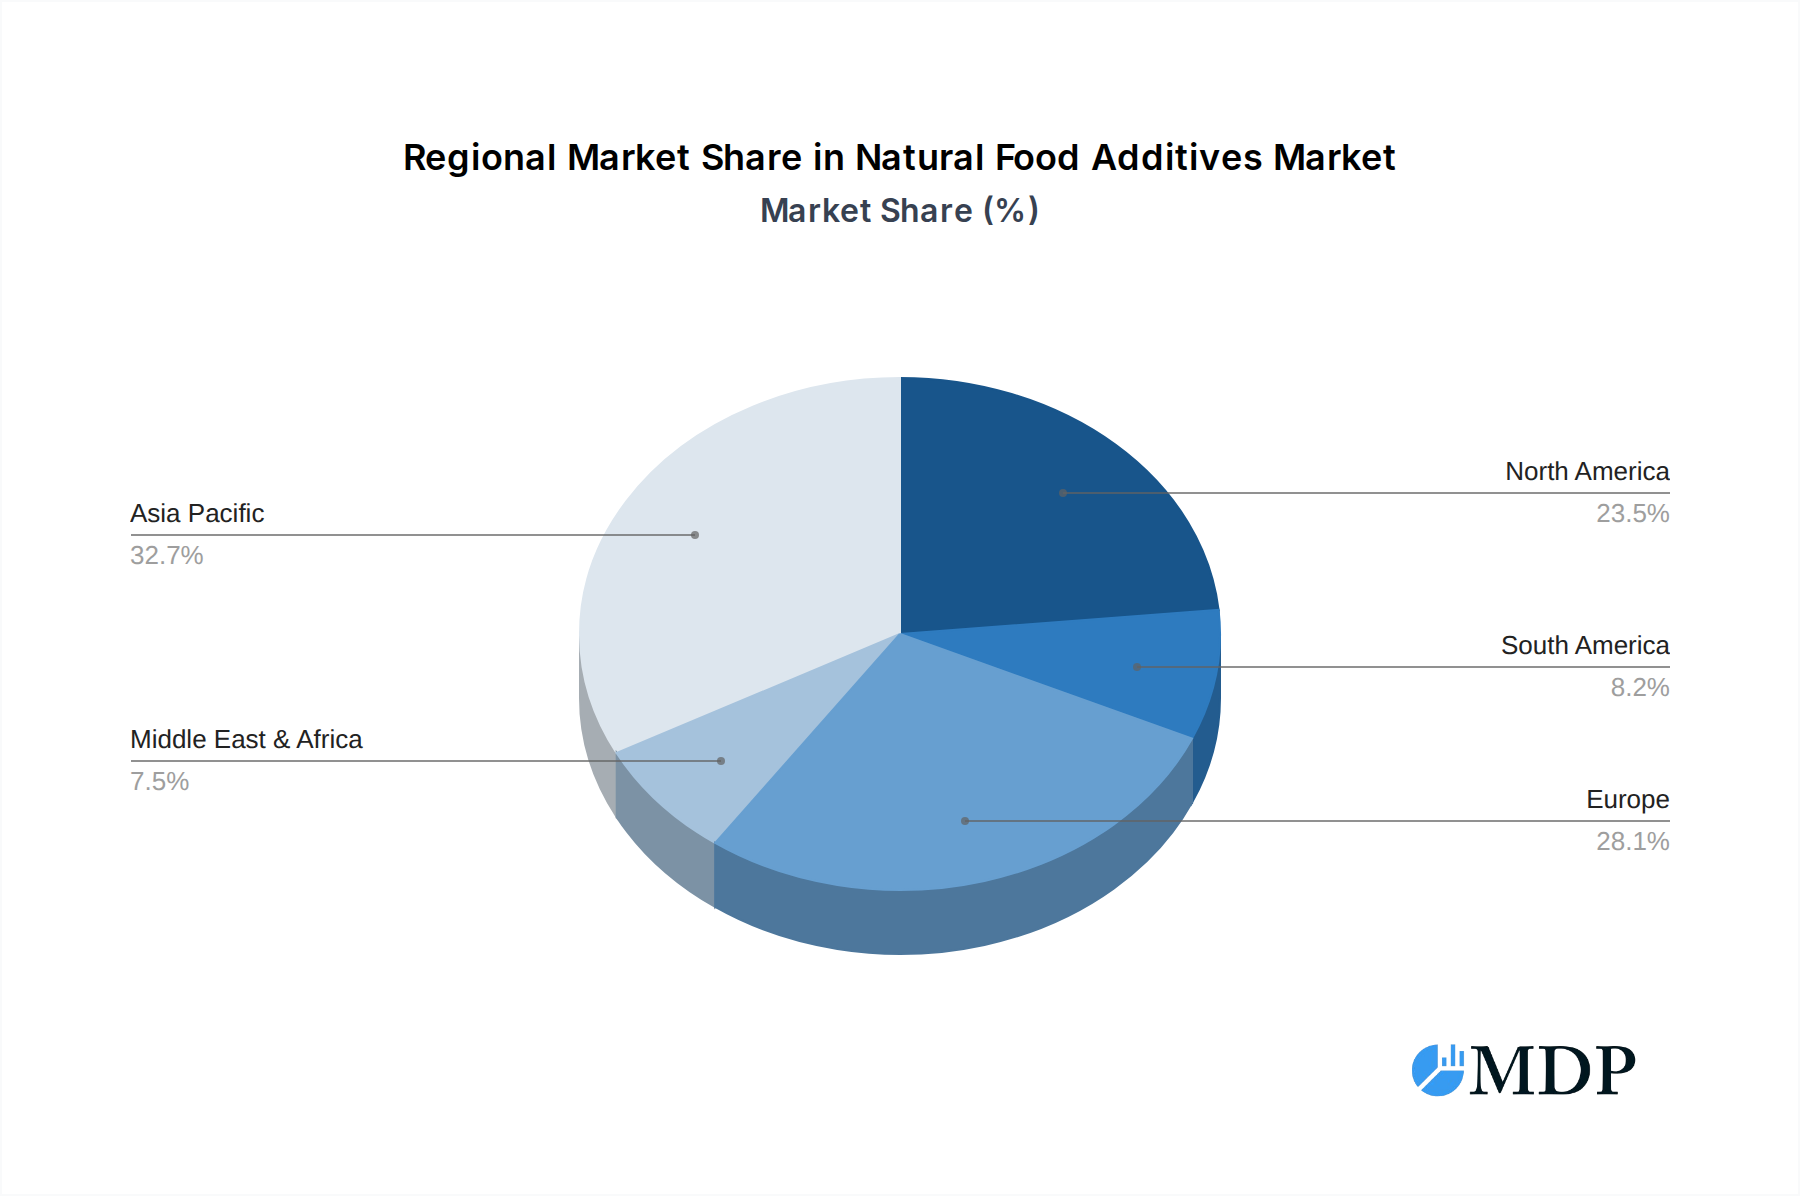
Natural Food Additives Regional Market Share
Geographic Coverage of Natural Food Additives
Natural Food Additives REPORT HIGHLIGHTS
| Aspects | Details |
|---|---|
| Study Period | 2020-2034 |
| Base Year | 2025 |
| Estimated Year | 2026 |
| Forecast Period | 2026-2034 |
| Historical Period | 2020-2025 |
| Growth Rate | CAGR of 5.6% from 2020-2034 |
| Segmentation |
|
Table of Contents
- 1. Introduction
- 1.1. Research Scope
- 1.2. Market Segmentation
- 1.3. Research Methodology
- 1.4. Definitions and Assumptions
- 2. Executive Summary
- 2.1. Introduction
- 3. Market Dynamics
- 3.1. Introduction
- 3.2. Market Drivers
- 3.3. Market Restrains
- 3.4. Market Trends
- 4. Market Factor Analysis
- 4.1. Porters Five Forces
- 4.2. Supply/Value Chain
- 4.3. PESTEL analysis
- 4.4. Market Entropy
- 4.5. Patent/Trademark Analysis
- 5. Global Natural Food Additives Analysis, Insights and Forecast, 2020-2032
- 5.1. Market Analysis, Insights and Forecast - by Application
- 5.1.1. Food
- 5.1.2. Beverage
- 5.2. Market Analysis, Insights and Forecast - by Type
- 5.2.1. Nuts Extract
- 5.2.2. Grains and Pulses Extract
- 5.2.3. Herbs and Spices Extract
- 5.2.4. Others
- 5.3. Market Analysis, Insights and Forecast - by Region
- 5.3.1. North America
- 5.3.2. South America
- 5.3.3. Europe
- 5.3.4. Middle East & Africa
- 5.3.5. Asia Pacific
- 5.1. Market Analysis, Insights and Forecast - by Application
- 6. North America Natural Food Additives Analysis, Insights and Forecast, 2020-2032
- 6.1. Market Analysis, Insights and Forecast - by Application
- 6.1.1. Food
- 6.1.2. Beverage
- 6.2. Market Analysis, Insights and Forecast - by Type
- 6.2.1. Nuts Extract
- 6.2.2. Grains and Pulses Extract
- 6.2.3. Herbs and Spices Extract
- 6.2.4. Others
- 6.1. Market Analysis, Insights and Forecast - by Application
- 7. South America Natural Food Additives Analysis, Insights and Forecast, 2020-2032
- 7.1. Market Analysis, Insights and Forecast - by Application
- 7.1.1. Food
- 7.1.2. Beverage
- 7.2. Market Analysis, Insights and Forecast - by Type
- 7.2.1. Nuts Extract
- 7.2.2. Grains and Pulses Extract
- 7.2.3. Herbs and Spices Extract
- 7.2.4. Others
- 7.1. Market Analysis, Insights and Forecast - by Application
- 8. Europe Natural Food Additives Analysis, Insights and Forecast, 2020-2032
- 8.1. Market Analysis, Insights and Forecast - by Application
- 8.1.1. Food
- 8.1.2. Beverage
- 8.2. Market Analysis, Insights and Forecast - by Type
- 8.2.1. Nuts Extract
- 8.2.2. Grains and Pulses Extract
- 8.2.3. Herbs and Spices Extract
- 8.2.4. Others
- 8.1. Market Analysis, Insights and Forecast - by Application
- 9. Middle East & Africa Natural Food Additives Analysis, Insights and Forecast, 2020-2032
- 9.1. Market Analysis, Insights and Forecast - by Application
- 9.1.1. Food
- 9.1.2. Beverage
- 9.2. Market Analysis, Insights and Forecast - by Type
- 9.2.1. Nuts Extract
- 9.2.2. Grains and Pulses Extract
- 9.2.3. Herbs and Spices Extract
- 9.2.4. Others
- 9.1. Market Analysis, Insights and Forecast - by Application
- 10. Asia Pacific Natural Food Additives Analysis, Insights and Forecast, 2020-2032
- 10.1. Market Analysis, Insights and Forecast - by Application
- 10.1.1. Food
- 10.1.2. Beverage
- 10.2. Market Analysis, Insights and Forecast - by Type
- 10.2.1. Nuts Extract
- 10.2.2. Grains and Pulses Extract
- 10.2.3. Herbs and Spices Extract
- 10.2.4. Others
- 10.1. Market Analysis, Insights and Forecast - by Application
- 11. Competitive Analysis
- 11.1. Global Market Share Analysis 2025
- 11.2. Company Profiles
- 11.2.1 Kanegrade
- 11.2.1.1. Overview
- 11.2.1.2. Products
- 11.2.1.3. SWOT Analysis
- 11.2.1.4. Recent Developments
- 11.2.1.5. Financials (Based on Availability)
- 11.2.2 GNT International
- 11.2.2.1. Overview
- 11.2.2.2. Products
- 11.2.2.3. SWOT Analysis
- 11.2.2.4. Recent Developments
- 11.2.2.5. Financials (Based on Availability)
- 11.2.3 Kalsec
- 11.2.3.1. Overview
- 11.2.3.2. Products
- 11.2.3.3. SWOT Analysis
- 11.2.3.4. Recent Developments
- 11.2.3.5. Financials (Based on Availability)
- 11.2.4 Naturex
- 11.2.4.1. Overview
- 11.2.4.2. Products
- 11.2.4.3. SWOT Analysis
- 11.2.4.4. Recent Developments
- 11.2.4.5. Financials (Based on Availability)
- 11.2.5 RAHO
- 11.2.5.1. Overview
- 11.2.5.2. Products
- 11.2.5.3. SWOT Analysis
- 11.2.5.4. Recent Developments
- 11.2.5.5. Financials (Based on Availability)
- 11.2.6 Sensient Flavors
- 11.2.6.1. Overview
- 11.2.6.2. Products
- 11.2.6.3. SWOT Analysis
- 11.2.6.4. Recent Developments
- 11.2.6.5. Financials (Based on Availability)
- 11.2.7 Dohler Group
- 11.2.7.1. Overview
- 11.2.7.2. Products
- 11.2.7.3. SWOT Analysis
- 11.2.7.4. Recent Developments
- 11.2.7.5. Financials (Based on Availability)
- 11.2.8 Vinayak Ingredients
- 11.2.8.1. Overview
- 11.2.8.2. Products
- 11.2.8.3. SWOT Analysis
- 11.2.8.4. Recent Developments
- 11.2.8.5. Financials (Based on Availability)
- 11.2.9 Puhua Stevia Sugar Development
- 11.2.9.1. Overview
- 11.2.9.2. Products
- 11.2.9.3. SWOT Analysis
- 11.2.9.4. Recent Developments
- 11.2.9.5. Financials (Based on Availability)
- 11.2.10 Nanyang Plant Essence Extraction
- 11.2.10.1. Overview
- 11.2.10.2. Products
- 11.2.10.3. SWOT Analysis
- 11.2.10.4. Recent Developments
- 11.2.10.5. Financials (Based on Availability)
- 11.2.1 Kanegrade
List of Figures
- Figure 1: Global Natural Food Additives Revenue Breakdown (undefined, %) by Region 2025 & 2033
- Figure 2: Global Natural Food Additives Volume Breakdown (K, %) by Region 2025 & 2033
- Figure 3: North America Natural Food Additives Revenue (undefined), by Application 2025 & 2033
- Figure 4: North America Natural Food Additives Volume (K), by Application 2025 & 2033
- Figure 5: North America Natural Food Additives Revenue Share (%), by Application 2025 & 2033
- Figure 6: North America Natural Food Additives Volume Share (%), by Application 2025 & 2033
- Figure 7: North America Natural Food Additives Revenue (undefined), by Type 2025 & 2033
- Figure 8: North America Natural Food Additives Volume (K), by Type 2025 & 2033
- Figure 9: North America Natural Food Additives Revenue Share (%), by Type 2025 & 2033
- Figure 10: North America Natural Food Additives Volume Share (%), by Type 2025 & 2033
- Figure 11: North America Natural Food Additives Revenue (undefined), by Country 2025 & 2033
- Figure 12: North America Natural Food Additives Volume (K), by Country 2025 & 2033
- Figure 13: North America Natural Food Additives Revenue Share (%), by Country 2025 & 2033
- Figure 14: North America Natural Food Additives Volume Share (%), by Country 2025 & 2033
- Figure 15: South America Natural Food Additives Revenue (undefined), by Application 2025 & 2033
- Figure 16: South America Natural Food Additives Volume (K), by Application 2025 & 2033
- Figure 17: South America Natural Food Additives Revenue Share (%), by Application 2025 & 2033
- Figure 18: South America Natural Food Additives Volume Share (%), by Application 2025 & 2033
- Figure 19: South America Natural Food Additives Revenue (undefined), by Type 2025 & 2033
- Figure 20: South America Natural Food Additives Volume (K), by Type 2025 & 2033
- Figure 21: South America Natural Food Additives Revenue Share (%), by Type 2025 & 2033
- Figure 22: South America Natural Food Additives Volume Share (%), by Type 2025 & 2033
- Figure 23: South America Natural Food Additives Revenue (undefined), by Country 2025 & 2033
- Figure 24: South America Natural Food Additives Volume (K), by Country 2025 & 2033
- Figure 25: South America Natural Food Additives Revenue Share (%), by Country 2025 & 2033
- Figure 26: South America Natural Food Additives Volume Share (%), by Country 2025 & 2033
- Figure 27: Europe Natural Food Additives Revenue (undefined), by Application 2025 & 2033
- Figure 28: Europe Natural Food Additives Volume (K), by Application 2025 & 2033
- Figure 29: Europe Natural Food Additives Revenue Share (%), by Application 2025 & 2033
- Figure 30: Europe Natural Food Additives Volume Share (%), by Application 2025 & 2033
- Figure 31: Europe Natural Food Additives Revenue (undefined), by Type 2025 & 2033
- Figure 32: Europe Natural Food Additives Volume (K), by Type 2025 & 2033
- Figure 33: Europe Natural Food Additives Revenue Share (%), by Type 2025 & 2033
- Figure 34: Europe Natural Food Additives Volume Share (%), by Type 2025 & 2033
- Figure 35: Europe Natural Food Additives Revenue (undefined), by Country 2025 & 2033
- Figure 36: Europe Natural Food Additives Volume (K), by Country 2025 & 2033
- Figure 37: Europe Natural Food Additives Revenue Share (%), by Country 2025 & 2033
- Figure 38: Europe Natural Food Additives Volume Share (%), by Country 2025 & 2033
- Figure 39: Middle East & Africa Natural Food Additives Revenue (undefined), by Application 2025 & 2033
- Figure 40: Middle East & Africa Natural Food Additives Volume (K), by Application 2025 & 2033
- Figure 41: Middle East & Africa Natural Food Additives Revenue Share (%), by Application 2025 & 2033
- Figure 42: Middle East & Africa Natural Food Additives Volume Share (%), by Application 2025 & 2033
- Figure 43: Middle East & Africa Natural Food Additives Revenue (undefined), by Type 2025 & 2033
- Figure 44: Middle East & Africa Natural Food Additives Volume (K), by Type 2025 & 2033
- Figure 45: Middle East & Africa Natural Food Additives Revenue Share (%), by Type 2025 & 2033
- Figure 46: Middle East & Africa Natural Food Additives Volume Share (%), by Type 2025 & 2033
- Figure 47: Middle East & Africa Natural Food Additives Revenue (undefined), by Country 2025 & 2033
- Figure 48: Middle East & Africa Natural Food Additives Volume (K), by Country 2025 & 2033
- Figure 49: Middle East & Africa Natural Food Additives Revenue Share (%), by Country 2025 & 2033
- Figure 50: Middle East & Africa Natural Food Additives Volume Share (%), by Country 2025 & 2033
- Figure 51: Asia Pacific Natural Food Additives Revenue (undefined), by Application 2025 & 2033
- Figure 52: Asia Pacific Natural Food Additives Volume (K), by Application 2025 & 2033
- Figure 53: Asia Pacific Natural Food Additives Revenue Share (%), by Application 2025 & 2033
- Figure 54: Asia Pacific Natural Food Additives Volume Share (%), by Application 2025 & 2033
- Figure 55: Asia Pacific Natural Food Additives Revenue (undefined), by Type 2025 & 2033
- Figure 56: Asia Pacific Natural Food Additives Volume (K), by Type 2025 & 2033
- Figure 57: Asia Pacific Natural Food Additives Revenue Share (%), by Type 2025 & 2033
- Figure 58: Asia Pacific Natural Food Additives Volume Share (%), by Type 2025 & 2033
- Figure 59: Asia Pacific Natural Food Additives Revenue (undefined), by Country 2025 & 2033
- Figure 60: Asia Pacific Natural Food Additives Volume (K), by Country 2025 & 2033
- Figure 61: Asia Pacific Natural Food Additives Revenue Share (%), by Country 2025 & 2033
- Figure 62: Asia Pacific Natural Food Additives Volume Share (%), by Country 2025 & 2033
List of Tables
- Table 1: Global Natural Food Additives Revenue undefined Forecast, by Application 2020 & 2033
- Table 2: Global Natural Food Additives Volume K Forecast, by Application 2020 & 2033
- Table 3: Global Natural Food Additives Revenue undefined Forecast, by Type 2020 & 2033
- Table 4: Global Natural Food Additives Volume K Forecast, by Type 2020 & 2033
- Table 5: Global Natural Food Additives Revenue undefined Forecast, by Region 2020 & 2033
- Table 6: Global Natural Food Additives Volume K Forecast, by Region 2020 & 2033
- Table 7: Global Natural Food Additives Revenue undefined Forecast, by Application 2020 & 2033
- Table 8: Global Natural Food Additives Volume K Forecast, by Application 2020 & 2033
- Table 9: Global Natural Food Additives Revenue undefined Forecast, by Type 2020 & 2033
- Table 10: Global Natural Food Additives Volume K Forecast, by Type 2020 & 2033
- Table 11: Global Natural Food Additives Revenue undefined Forecast, by Country 2020 & 2033
- Table 12: Global Natural Food Additives Volume K Forecast, by Country 2020 & 2033
- Table 13: United States Natural Food Additives Revenue (undefined) Forecast, by Application 2020 & 2033
- Table 14: United States Natural Food Additives Volume (K) Forecast, by Application 2020 & 2033
- Table 15: Canada Natural Food Additives Revenue (undefined) Forecast, by Application 2020 & 2033
- Table 16: Canada Natural Food Additives Volume (K) Forecast, by Application 2020 & 2033
- Table 17: Mexico Natural Food Additives Revenue (undefined) Forecast, by Application 2020 & 2033
- Table 18: Mexico Natural Food Additives Volume (K) Forecast, by Application 2020 & 2033
- Table 19: Global Natural Food Additives Revenue undefined Forecast, by Application 2020 & 2033
- Table 20: Global Natural Food Additives Volume K Forecast, by Application 2020 & 2033
- Table 21: Global Natural Food Additives Revenue undefined Forecast, by Type 2020 & 2033
- Table 22: Global Natural Food Additives Volume K Forecast, by Type 2020 & 2033
- Table 23: Global Natural Food Additives Revenue undefined Forecast, by Country 2020 & 2033
- Table 24: Global Natural Food Additives Volume K Forecast, by Country 2020 & 2033
- Table 25: Brazil Natural Food Additives Revenue (undefined) Forecast, by Application 2020 & 2033
- Table 26: Brazil Natural Food Additives Volume (K) Forecast, by Application 2020 & 2033
- Table 27: Argentina Natural Food Additives Revenue (undefined) Forecast, by Application 2020 & 2033
- Table 28: Argentina Natural Food Additives Volume (K) Forecast, by Application 2020 & 2033
- Table 29: Rest of South America Natural Food Additives Revenue (undefined) Forecast, by Application 2020 & 2033
- Table 30: Rest of South America Natural Food Additives Volume (K) Forecast, by Application 2020 & 2033
- Table 31: Global Natural Food Additives Revenue undefined Forecast, by Application 2020 & 2033
- Table 32: Global Natural Food Additives Volume K Forecast, by Application 2020 & 2033
- Table 33: Global Natural Food Additives Revenue undefined Forecast, by Type 2020 & 2033
- Table 34: Global Natural Food Additives Volume K Forecast, by Type 2020 & 2033
- Table 35: Global Natural Food Additives Revenue undefined Forecast, by Country 2020 & 2033
- Table 36: Global Natural Food Additives Volume K Forecast, by Country 2020 & 2033
- Table 37: United Kingdom Natural Food Additives Revenue (undefined) Forecast, by Application 2020 & 2033
- Table 38: United Kingdom Natural Food Additives Volume (K) Forecast, by Application 2020 & 2033
- Table 39: Germany Natural Food Additives Revenue (undefined) Forecast, by Application 2020 & 2033
- Table 40: Germany Natural Food Additives Volume (K) Forecast, by Application 2020 & 2033
- Table 41: France Natural Food Additives Revenue (undefined) Forecast, by Application 2020 & 2033
- Table 42: France Natural Food Additives Volume (K) Forecast, by Application 2020 & 2033
- Table 43: Italy Natural Food Additives Revenue (undefined) Forecast, by Application 2020 & 2033
- Table 44: Italy Natural Food Additives Volume (K) Forecast, by Application 2020 & 2033
- Table 45: Spain Natural Food Additives Revenue (undefined) Forecast, by Application 2020 & 2033
- Table 46: Spain Natural Food Additives Volume (K) Forecast, by Application 2020 & 2033
- Table 47: Russia Natural Food Additives Revenue (undefined) Forecast, by Application 2020 & 2033
- Table 48: Russia Natural Food Additives Volume (K) Forecast, by Application 2020 & 2033
- Table 49: Benelux Natural Food Additives Revenue (undefined) Forecast, by Application 2020 & 2033
- Table 50: Benelux Natural Food Additives Volume (K) Forecast, by Application 2020 & 2033
- Table 51: Nordics Natural Food Additives Revenue (undefined) Forecast, by Application 2020 & 2033
- Table 52: Nordics Natural Food Additives Volume (K) Forecast, by Application 2020 & 2033
- Table 53: Rest of Europe Natural Food Additives Revenue (undefined) Forecast, by Application 2020 & 2033
- Table 54: Rest of Europe Natural Food Additives Volume (K) Forecast, by Application 2020 & 2033
- Table 55: Global Natural Food Additives Revenue undefined Forecast, by Application 2020 & 2033
- Table 56: Global Natural Food Additives Volume K Forecast, by Application 2020 & 2033
- Table 57: Global Natural Food Additives Revenue undefined Forecast, by Type 2020 & 2033
- Table 58: Global Natural Food Additives Volume K Forecast, by Type 2020 & 2033
- Table 59: Global Natural Food Additives Revenue undefined Forecast, by Country 2020 & 2033
- Table 60: Global Natural Food Additives Volume K Forecast, by Country 2020 & 2033
- Table 61: Turkey Natural Food Additives Revenue (undefined) Forecast, by Application 2020 & 2033
- Table 62: Turkey Natural Food Additives Volume (K) Forecast, by Application 2020 & 2033
- Table 63: Israel Natural Food Additives Revenue (undefined) Forecast, by Application 2020 & 2033
- Table 64: Israel Natural Food Additives Volume (K) Forecast, by Application 2020 & 2033
- Table 65: GCC Natural Food Additives Revenue (undefined) Forecast, by Application 2020 & 2033
- Table 66: GCC Natural Food Additives Volume (K) Forecast, by Application 2020 & 2033
- Table 67: North Africa Natural Food Additives Revenue (undefined) Forecast, by Application 2020 & 2033
- Table 68: North Africa Natural Food Additives Volume (K) Forecast, by Application 2020 & 2033
- Table 69: South Africa Natural Food Additives Revenue (undefined) Forecast, by Application 2020 & 2033
- Table 70: South Africa Natural Food Additives Volume (K) Forecast, by Application 2020 & 2033
- Table 71: Rest of Middle East & Africa Natural Food Additives Revenue (undefined) Forecast, by Application 2020 & 2033
- Table 72: Rest of Middle East & Africa Natural Food Additives Volume (K) Forecast, by Application 2020 & 2033
- Table 73: Global Natural Food Additives Revenue undefined Forecast, by Application 2020 & 2033
- Table 74: Global Natural Food Additives Volume K Forecast, by Application 2020 & 2033
- Table 75: Global Natural Food Additives Revenue undefined Forecast, by Type 2020 & 2033
- Table 76: Global Natural Food Additives Volume K Forecast, by Type 2020 & 2033
- Table 77: Global Natural Food Additives Revenue undefined Forecast, by Country 2020 & 2033
- Table 78: Global Natural Food Additives Volume K Forecast, by Country 2020 & 2033
- Table 79: China Natural Food Additives Revenue (undefined) Forecast, by Application 2020 & 2033
- Table 80: China Natural Food Additives Volume (K) Forecast, by Application 2020 & 2033
- Table 81: India Natural Food Additives Revenue (undefined) Forecast, by Application 2020 & 2033
- Table 82: India Natural Food Additives Volume (K) Forecast, by Application 2020 & 2033
- Table 83: Japan Natural Food Additives Revenue (undefined) Forecast, by Application 2020 & 2033
- Table 84: Japan Natural Food Additives Volume (K) Forecast, by Application 2020 & 2033
- Table 85: South Korea Natural Food Additives Revenue (undefined) Forecast, by Application 2020 & 2033
- Table 86: South Korea Natural Food Additives Volume (K) Forecast, by Application 2020 & 2033
- Table 87: ASEAN Natural Food Additives Revenue (undefined) Forecast, by Application 2020 & 2033
- Table 88: ASEAN Natural Food Additives Volume (K) Forecast, by Application 2020 & 2033
- Table 89: Oceania Natural Food Additives Revenue (undefined) Forecast, by Application 2020 & 2033
- Table 90: Oceania Natural Food Additives Volume (K) Forecast, by Application 2020 & 2033
- Table 91: Rest of Asia Pacific Natural Food Additives Revenue (undefined) Forecast, by Application 2020 & 2033
- Table 92: Rest of Asia Pacific Natural Food Additives Volume (K) Forecast, by Application 2020 & 2033
Frequently Asked Questions
1. What is the projected Compound Annual Growth Rate (CAGR) of the Natural Food Additives?
The projected CAGR is approximately 5.6%.
2. Which companies are prominent players in the Natural Food Additives?
Key companies in the market include Kanegrade, GNT International, Kalsec, Naturex, RAHO, Sensient Flavors, Dohler Group, Vinayak Ingredients, Puhua Stevia Sugar Development, Nanyang Plant Essence Extraction.
3. What are the main segments of the Natural Food Additives?
The market segments include Application, Type.
4. Can you provide details about the market size?
The market size is estimated to be USD XXX N/A as of 2022.
5. What are some drivers contributing to market growth?
N/A
6. What are the notable trends driving market growth?
N/A
7. Are there any restraints impacting market growth?
N/A
8. Can you provide examples of recent developments in the market?
N/A
9. What pricing options are available for accessing the report?
Pricing options include single-user, multi-user, and enterprise licenses priced at USD 3950.00, USD 5925.00, and USD 7900.00 respectively.
10. Is the market size provided in terms of value or volume?
The market size is provided in terms of value, measured in N/A and volume, measured in K.
11. Are there any specific market keywords associated with the report?
Yes, the market keyword associated with the report is "Natural Food Additives," which aids in identifying and referencing the specific market segment covered.
12. How do I determine which pricing option suits my needs best?
The pricing options vary based on user requirements and access needs. Individual users may opt for single-user licenses, while businesses requiring broader access may choose multi-user or enterprise licenses for cost-effective access to the report.
13. Are there any additional resources or data provided in the Natural Food Additives report?
While the report offers comprehensive insights, it's advisable to review the specific contents or supplementary materials provided to ascertain if additional resources or data are available.
14. How can I stay updated on further developments or reports in the Natural Food Additives?
To stay informed about further developments, trends, and reports in the Natural Food Additives, consider subscribing to industry newsletters, following relevant companies and organizations, or regularly checking reputable industry news sources and publications.
Methodology
Step 1 - Identification of Relevant Samples Size from Population Database


Step 2 - Approaches for Defining Global Market Size (Value, Volume* & Price*)

Note*: In applicable scenarios
Step 3 - Data Sources
Primary Research
- Web Analytics
- Survey Reports
- Research Institute
- Latest Research Reports
- Opinion Leaders
Secondary Research
- Annual Reports
- White Paper
- Latest Press Release
- Industry Association
- Paid Database
- Investor Presentations

Step 4 - Data Triangulation
Involves using different sources of information in order to increase the validity of a study
These sources are likely to be stakeholders in a program - participants, other researchers, program staff, other community members, and so on.
Then we put all data in single framework & apply various statistical tools to find out the dynamic on the market.
During the analysis stage, feedback from the stakeholder groups would be compared to determine areas of agreement as well as areas of divergence