

Key Insights
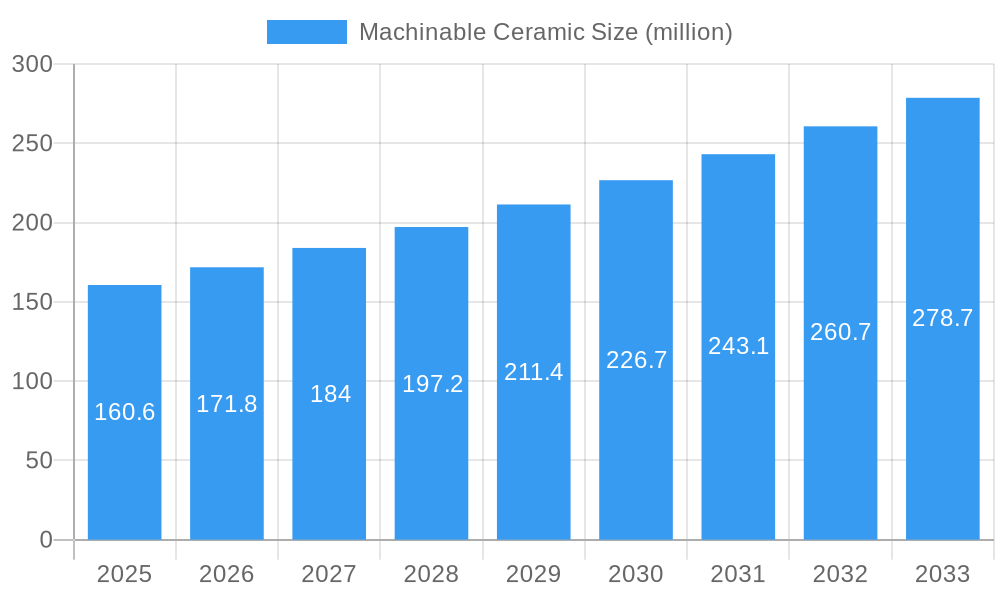
The machinable ceramic market, valued at $160.6 million in 2025, is projected to experience robust growth, driven by increasing demand across diverse sectors. A compound annual growth rate (CAGR) of 7% from 2025 to 2033 indicates a significant expansion, reaching an estimated $278.7 million by 2033. Key drivers include the burgeoning aerospace industry's need for lightweight, high-performance materials in aircraft and spacecraft components, the expanding medical device sector requiring biocompatible and machinable ceramics for implants and instruments, and the continuous advancements in semiconductor manufacturing demanding precise and durable ceramic substrates. The market is segmented by application (aerospace, vacuum environments, medical, welding nozzles, semiconductors, others) and type (fluorophlogopite glass ceramic, non-oxide ceramic, others), each exhibiting unique growth trajectories influenced by technological advancements and specific industry requirements. Growth in the semiconductor industry, particularly in advanced packaging and high-power electronics, is expected to be a major contributor to market expansion. The adoption of machinable ceramics in high-vacuum applications, driven by the growing demand for precision instruments and components in scientific research and industrial processes, will also fuel market expansion.
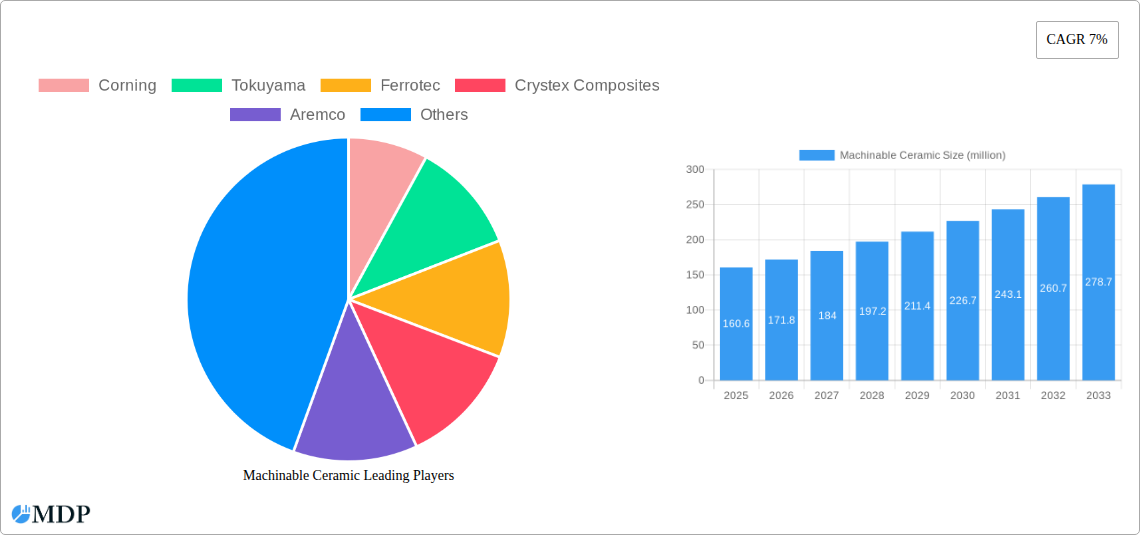
Machinable Ceramic Market Size (In Million)
While the market enjoys strong growth prospects, potential restraints include the relatively high cost of machinable ceramics compared to alternative materials and the complexities associated with machining these materials, necessitating specialized equipment and expertise. However, ongoing research and development efforts focused on improving machinability and reducing manufacturing costs are mitigating these challenges. The competitive landscape is marked by established players like Corning, Tokuyama, and Ferrotec, along with several regional and specialized manufacturers. Regional market dynamics vary, with North America and Europe currently holding significant market shares, but the Asia-Pacific region, particularly China and India, is poised for substantial growth due to increasing industrialization and technological advancements.
Machinable Ceramic Company Market Share
Machinable Ceramic Market Report: A Comprehensive Analysis 2019-2033
This comprehensive report provides an in-depth analysis of the machinable ceramic market, projecting a market value of $XX million by 2033. The study covers the period from 2019 to 2033, with 2025 serving as the base and estimated year. It offers crucial insights for industry stakeholders, investors, and businesses looking to navigate this dynamic sector. Benefit from detailed segmentation analysis, competitive landscaping, and future market projections to gain a strategic advantage.
Machinable Ceramic Market Dynamics & Concentration
The global machinable ceramic market, valued at $XX million in 2025, is characterized by moderate concentration, with key players like Corning, Tokuyama, Ferrotec, Crystex Composites, Aremco, Ariake Materials, Wuxi Creative Ceramic, and INNOVACERA holding significant market share. The market is driven by continuous innovation in material science, leading to the development of high-performance ceramics with enhanced machinability and properties. Stringent regulatory frameworks regarding material safety and environmental impact influence manufacturing processes and product development. The presence of substitute materials, such as advanced polymers and composites, poses a competitive challenge. End-user trends toward lightweighting, high-temperature resistance, and improved durability drive demand. The market has witnessed a moderate level of M&A activity in recent years, with approximately XX deals recorded between 2019 and 2024, further consolidating the market landscape.
- Market Share: Corning holds an estimated XX% market share, followed by Tokuyama with XX%, and Ferrotec with XX%. The remaining market share is distributed among other players.
- M&A Activity: The average annual M&A deal count between 2019 and 2024 was approximately XX, indicating a moderate level of consolidation.
- Innovation Drivers: Research and development efforts focusing on improved machinability, enhanced thermal conductivity, and superior chemical resistance are driving market growth.
- Regulatory Frameworks: Compliance with environmental regulations and safety standards is crucial for manufacturers, influencing material selection and production methods.
Machinable Ceramic Industry Trends & Analysis
The machinable ceramic market exhibits a robust CAGR of XX% during the forecast period (2025-2033), fueled by increasing demand across diverse sectors. Technological advancements such as additive manufacturing (3D printing) are revolutionizing the production process, enabling complex shapes and customized designs. Consumer preferences lean towards high-performance materials offering improved durability, thermal shock resistance, and biocompatibility. Intense competition among established players and new entrants drives continuous improvement in product quality and performance. Market penetration in emerging economies is also a significant growth driver, although the current penetration rate is only at XX%.
Leading Markets & Segments in Machinable Ceramic
The Semi-Conductor industry currently dominates the machinable ceramic market, accounting for approximately XX% of the total market value in 2025. Strong growth is also anticipated in the Aerospace and Medical industries.
- Dominant Regions: North America and Asia-Pacific are the leading regions, driven by robust industrial activity and technological advancements.
- Key Drivers by Segment:
- Aerospace: Demand for lightweight yet strong components for aircraft and spacecraft.
- Constant and Ultra-high Vacuum Environments: Applications in scientific research and semiconductor manufacturing.
- Medical Industry: Biocompatibility and sterilizability requirements for medical implants and devices.
- Welding Nozzles: Resistance to high temperatures and wear.
- Semi-Conductor Industry: High demand for substrates and components in chip manufacturing.
- Dominant Types: Fluorophlogopite glass ceramic currently holds the largest market share due to its excellent machinability and thermal properties.
Machinable Ceramic Product Developments
Recent advancements have focused on developing machinable ceramics with enhanced strength, thermal conductivity, and biocompatibility. Innovations in processing techniques such as 3D printing are enabling the creation of complex shapes and customized designs. These advancements cater to the growing demand for high-performance materials across various applications, creating a competitive advantage for manufacturers who can offer superior product quality and functionality.
Key Drivers of Machinable Ceramic Growth
The machinable ceramic market's growth is propelled by several key factors. Technological advancements in material science continuously improve the properties of machinable ceramics. The increasing demand for high-performance materials in diverse sectors like aerospace and semiconductors is a significant growth driver. Favorable government policies promoting technological innovation and adoption of advanced materials further stimulate market expansion.
Challenges in the Machinable Ceramic Market
The market faces challenges, including high production costs and the availability of suitable raw materials. Stringent regulatory requirements for environmental compliance and product safety increase manufacturing costs. Competition from substitute materials like advanced polymers and composites adds pressure on pricing and market share. These factors potentially limit market growth if not effectively addressed.
Emerging Opportunities in Machinable Ceramic
Significant opportunities exist in expanding applications of machinable ceramics in emerging sectors such as renewable energy and electric vehicles. Technological breakthroughs in material science, combined with strategic partnerships between manufacturers and end-users, will unlock new market segments. The development of sustainable and eco-friendly manufacturing processes will also present a significant opportunity for growth.
Leading Players in the Machinable Ceramic Sector
- Corning
- Tokuyama
- Ferrotec
- Crystex Composites
- Aremco
- Ariake Materials
- Wuxi Creative Ceramic
- INNOVACERA
Key Milestones in Machinable Ceramic Industry
- 2020: Introduction of a new high-strength machinable ceramic by Corning.
- 2022: Tokuyama announces a strategic partnership to expand its distribution network.
- 2023: Ferrotec launches a new line of machinable ceramics for the medical industry.
Strategic Outlook for Machinable Ceramic Market
The machinable ceramic market is poised for continued growth, driven by technological innovation and increasing demand across diverse sectors. Strategic partnerships, focused R&D initiatives, and expansion into new applications will be key to success. Companies that can offer superior product quality, competitive pricing, and sustainable manufacturing processes are expected to gain a significant market advantage.
Machinable Ceramic Segmentation
-
1. Application
- 1.1. Aerospace Industry
- 1.2. Constant and Ultra-high Vacuum Environments
- 1.3. Medical Industry
- 1.4. Welding Nozzles
- 1.5. Semi-Conductor Industry
- 1.6. Others
-
2. Types
- 2.1. Fluorophlogopite Glass Ceramic
- 2.2. Non-oxide Ceramic
- 2.3. Others
Machinable Ceramic Segmentation By Geography
-
1. North America
- 1.1. United States
- 1.2. Canada
- 1.3. Mexico
-
2. South America
- 2.1. Brazil
- 2.2. Argentina
- 2.3. Rest of South America
-
3. Europe
- 3.1. United Kingdom
- 3.2. Germany
- 3.3. France
- 3.4. Italy
- 3.5. Spain
- 3.6. Russia
- 3.7. Benelux
- 3.8. Nordics
- 3.9. Rest of Europe
-
4. Middle East & Africa
- 4.1. Turkey
- 4.2. Israel
- 4.3. GCC
- 4.4. North Africa
- 4.5. South Africa
- 4.6. Rest of Middle East & Africa
-
5. Asia Pacific
- 5.1. China
- 5.2. India
- 5.3. Japan
- 5.4. South Korea
- 5.5. ASEAN
- 5.6. Oceania
- 5.7. Rest of Asia Pacific

Machinable Ceramic Regional Market Share
Geographic Coverage of Machinable Ceramic
Machinable Ceramic REPORT HIGHLIGHTS
| Aspects | Details |
|---|---|
| Study Period | 2020-2034 |
| Base Year | 2025 |
| Estimated Year | 2026 |
| Forecast Period | 2026-2034 |
| Historical Period | 2020-2025 |
| Growth Rate | CAGR of 7.6% from 2020-2034 |
| Segmentation |
|
Table of Contents
- 1. Introduction
- 1.1. Research Scope
- 1.2. Market Segmentation
- 1.3. Research Methodology
- 1.4. Definitions and Assumptions
- 2. Executive Summary
- 2.1. Introduction
- 3. Market Dynamics
- 3.1. Introduction
- 3.2. Market Drivers
- 3.3. Market Restrains
- 3.4. Market Trends
- 4. Market Factor Analysis
- 4.1. Porters Five Forces
- 4.2. Supply/Value Chain
- 4.3. PESTEL analysis
- 4.4. Market Entropy
- 4.5. Patent/Trademark Analysis
- 5. Global Machinable Ceramic Analysis, Insights and Forecast, 2020-2032
- 5.1. Market Analysis, Insights and Forecast - by Application
- 5.1.1. Aerospace Industry
- 5.1.2. Constant and Ultra-high Vacuum Environments
- 5.1.3. Medical Industry
- 5.1.4. Welding Nozzles
- 5.1.5. Semi-Conductor Industry
- 5.1.6. Others
- 5.2. Market Analysis, Insights and Forecast - by Types
- 5.2.1. Fluorophlogopite Glass Ceramic
- 5.2.2. Non-oxide Ceramic
- 5.2.3. Others
- 5.3. Market Analysis, Insights and Forecast - by Region
- 5.3.1. North America
- 5.3.2. South America
- 5.3.3. Europe
- 5.3.4. Middle East & Africa
- 5.3.5. Asia Pacific
- 5.1. Market Analysis, Insights and Forecast - by Application
- 6. North America Machinable Ceramic Analysis, Insights and Forecast, 2020-2032
- 6.1. Market Analysis, Insights and Forecast - by Application
- 6.1.1. Aerospace Industry
- 6.1.2. Constant and Ultra-high Vacuum Environments
- 6.1.3. Medical Industry
- 6.1.4. Welding Nozzles
- 6.1.5. Semi-Conductor Industry
- 6.1.6. Others
- 6.2. Market Analysis, Insights and Forecast - by Types
- 6.2.1. Fluorophlogopite Glass Ceramic
- 6.2.2. Non-oxide Ceramic
- 6.2.3. Others
- 6.1. Market Analysis, Insights and Forecast - by Application
- 7. South America Machinable Ceramic Analysis, Insights and Forecast, 2020-2032
- 7.1. Market Analysis, Insights and Forecast - by Application
- 7.1.1. Aerospace Industry
- 7.1.2. Constant and Ultra-high Vacuum Environments
- 7.1.3. Medical Industry
- 7.1.4. Welding Nozzles
- 7.1.5. Semi-Conductor Industry
- 7.1.6. Others
- 7.2. Market Analysis, Insights and Forecast - by Types
- 7.2.1. Fluorophlogopite Glass Ceramic
- 7.2.2. Non-oxide Ceramic
- 7.2.3. Others
- 7.1. Market Analysis, Insights and Forecast - by Application
- 8. Europe Machinable Ceramic Analysis, Insights and Forecast, 2020-2032
- 8.1. Market Analysis, Insights and Forecast - by Application
- 8.1.1. Aerospace Industry
- 8.1.2. Constant and Ultra-high Vacuum Environments
- 8.1.3. Medical Industry
- 8.1.4. Welding Nozzles
- 8.1.5. Semi-Conductor Industry
- 8.1.6. Others
- 8.2. Market Analysis, Insights and Forecast - by Types
- 8.2.1. Fluorophlogopite Glass Ceramic
- 8.2.2. Non-oxide Ceramic
- 8.2.3. Others
- 8.1. Market Analysis, Insights and Forecast - by Application
- 9. Middle East & Africa Machinable Ceramic Analysis, Insights and Forecast, 2020-2032
- 9.1. Market Analysis, Insights and Forecast - by Application
- 9.1.1. Aerospace Industry
- 9.1.2. Constant and Ultra-high Vacuum Environments
- 9.1.3. Medical Industry
- 9.1.4. Welding Nozzles
- 9.1.5. Semi-Conductor Industry
- 9.1.6. Others
- 9.2. Market Analysis, Insights and Forecast - by Types
- 9.2.1. Fluorophlogopite Glass Ceramic
- 9.2.2. Non-oxide Ceramic
- 9.2.3. Others
- 9.1. Market Analysis, Insights and Forecast - by Application
- 10. Asia Pacific Machinable Ceramic Analysis, Insights and Forecast, 2020-2032
- 10.1. Market Analysis, Insights and Forecast - by Application
- 10.1.1. Aerospace Industry
- 10.1.2. Constant and Ultra-high Vacuum Environments
- 10.1.3. Medical Industry
- 10.1.4. Welding Nozzles
- 10.1.5. Semi-Conductor Industry
- 10.1.6. Others
- 10.2. Market Analysis, Insights and Forecast - by Types
- 10.2.1. Fluorophlogopite Glass Ceramic
- 10.2.2. Non-oxide Ceramic
- 10.2.3. Others
- 10.1. Market Analysis, Insights and Forecast - by Application
- 11. Competitive Analysis
- 11.1. Global Market Share Analysis 2025
- 11.2. Company Profiles
- 11.2.1 Corning
- 11.2.1.1. Overview
- 11.2.1.2. Products
- 11.2.1.3. SWOT Analysis
- 11.2.1.4. Recent Developments
- 11.2.1.5. Financials (Based on Availability)
- 11.2.2 Tokuyama
- 11.2.2.1. Overview
- 11.2.2.2. Products
- 11.2.2.3. SWOT Analysis
- 11.2.2.4. Recent Developments
- 11.2.2.5. Financials (Based on Availability)
- 11.2.3 Ferrotec
- 11.2.3.1. Overview
- 11.2.3.2. Products
- 11.2.3.3. SWOT Analysis
- 11.2.3.4. Recent Developments
- 11.2.3.5. Financials (Based on Availability)
- 11.2.4 Crystex Composites
- 11.2.4.1. Overview
- 11.2.4.2. Products
- 11.2.4.3. SWOT Analysis
- 11.2.4.4. Recent Developments
- 11.2.4.5. Financials (Based on Availability)
- 11.2.5 Aremco
- 11.2.5.1. Overview
- 11.2.5.2. Products
- 11.2.5.3. SWOT Analysis
- 11.2.5.4. Recent Developments
- 11.2.5.5. Financials (Based on Availability)
- 11.2.6 Ariake Materials
- 11.2.6.1. Overview
- 11.2.6.2. Products
- 11.2.6.3. SWOT Analysis
- 11.2.6.4. Recent Developments
- 11.2.6.5. Financials (Based on Availability)
- 11.2.7 Wuxi Creative Ceramic
- 11.2.7.1. Overview
- 11.2.7.2. Products
- 11.2.7.3. SWOT Analysis
- 11.2.7.4. Recent Developments
- 11.2.7.5. Financials (Based on Availability)
- 11.2.8 INNOVACERA
- 11.2.8.1. Overview
- 11.2.8.2. Products
- 11.2.8.3. SWOT Analysis
- 11.2.8.4. Recent Developments
- 11.2.8.5. Financials (Based on Availability)
- 11.2.1 Corning
List of Figures
- Figure 1: Global Machinable Ceramic Revenue Breakdown (undefined, %) by Region 2025 & 2033
- Figure 2: North America Machinable Ceramic Revenue (undefined), by Application 2025 & 2033
- Figure 3: North America Machinable Ceramic Revenue Share (%), by Application 2025 & 2033
- Figure 4: North America Machinable Ceramic Revenue (undefined), by Types 2025 & 2033
- Figure 5: North America Machinable Ceramic Revenue Share (%), by Types 2025 & 2033
- Figure 6: North America Machinable Ceramic Revenue (undefined), by Country 2025 & 2033
- Figure 7: North America Machinable Ceramic Revenue Share (%), by Country 2025 & 2033
- Figure 8: South America Machinable Ceramic Revenue (undefined), by Application 2025 & 2033
- Figure 9: South America Machinable Ceramic Revenue Share (%), by Application 2025 & 2033
- Figure 10: South America Machinable Ceramic Revenue (undefined), by Types 2025 & 2033
- Figure 11: South America Machinable Ceramic Revenue Share (%), by Types 2025 & 2033
- Figure 12: South America Machinable Ceramic Revenue (undefined), by Country 2025 & 2033
- Figure 13: South America Machinable Ceramic Revenue Share (%), by Country 2025 & 2033
- Figure 14: Europe Machinable Ceramic Revenue (undefined), by Application 2025 & 2033
- Figure 15: Europe Machinable Ceramic Revenue Share (%), by Application 2025 & 2033
- Figure 16: Europe Machinable Ceramic Revenue (undefined), by Types 2025 & 2033
- Figure 17: Europe Machinable Ceramic Revenue Share (%), by Types 2025 & 2033
- Figure 18: Europe Machinable Ceramic Revenue (undefined), by Country 2025 & 2033
- Figure 19: Europe Machinable Ceramic Revenue Share (%), by Country 2025 & 2033
- Figure 20: Middle East & Africa Machinable Ceramic Revenue (undefined), by Application 2025 & 2033
- Figure 21: Middle East & Africa Machinable Ceramic Revenue Share (%), by Application 2025 & 2033
- Figure 22: Middle East & Africa Machinable Ceramic Revenue (undefined), by Types 2025 & 2033
- Figure 23: Middle East & Africa Machinable Ceramic Revenue Share (%), by Types 2025 & 2033
- Figure 24: Middle East & Africa Machinable Ceramic Revenue (undefined), by Country 2025 & 2033
- Figure 25: Middle East & Africa Machinable Ceramic Revenue Share (%), by Country 2025 & 2033
- Figure 26: Asia Pacific Machinable Ceramic Revenue (undefined), by Application 2025 & 2033
- Figure 27: Asia Pacific Machinable Ceramic Revenue Share (%), by Application 2025 & 2033
- Figure 28: Asia Pacific Machinable Ceramic Revenue (undefined), by Types 2025 & 2033
- Figure 29: Asia Pacific Machinable Ceramic Revenue Share (%), by Types 2025 & 2033
- Figure 30: Asia Pacific Machinable Ceramic Revenue (undefined), by Country 2025 & 2033
- Figure 31: Asia Pacific Machinable Ceramic Revenue Share (%), by Country 2025 & 2033
List of Tables
- Table 1: Global Machinable Ceramic Revenue undefined Forecast, by Application 2020 & 2033
- Table 2: Global Machinable Ceramic Revenue undefined Forecast, by Types 2020 & 2033
- Table 3: Global Machinable Ceramic Revenue undefined Forecast, by Region 2020 & 2033
- Table 4: Global Machinable Ceramic Revenue undefined Forecast, by Application 2020 & 2033
- Table 5: Global Machinable Ceramic Revenue undefined Forecast, by Types 2020 & 2033
- Table 6: Global Machinable Ceramic Revenue undefined Forecast, by Country 2020 & 2033
- Table 7: United States Machinable Ceramic Revenue (undefined) Forecast, by Application 2020 & 2033
- Table 8: Canada Machinable Ceramic Revenue (undefined) Forecast, by Application 2020 & 2033
- Table 9: Mexico Machinable Ceramic Revenue (undefined) Forecast, by Application 2020 & 2033
- Table 10: Global Machinable Ceramic Revenue undefined Forecast, by Application 2020 & 2033
- Table 11: Global Machinable Ceramic Revenue undefined Forecast, by Types 2020 & 2033
- Table 12: Global Machinable Ceramic Revenue undefined Forecast, by Country 2020 & 2033
- Table 13: Brazil Machinable Ceramic Revenue (undefined) Forecast, by Application 2020 & 2033
- Table 14: Argentina Machinable Ceramic Revenue (undefined) Forecast, by Application 2020 & 2033
- Table 15: Rest of South America Machinable Ceramic Revenue (undefined) Forecast, by Application 2020 & 2033
- Table 16: Global Machinable Ceramic Revenue undefined Forecast, by Application 2020 & 2033
- Table 17: Global Machinable Ceramic Revenue undefined Forecast, by Types 2020 & 2033
- Table 18: Global Machinable Ceramic Revenue undefined Forecast, by Country 2020 & 2033
- Table 19: United Kingdom Machinable Ceramic Revenue (undefined) Forecast, by Application 2020 & 2033
- Table 20: Germany Machinable Ceramic Revenue (undefined) Forecast, by Application 2020 & 2033
- Table 21: France Machinable Ceramic Revenue (undefined) Forecast, by Application 2020 & 2033
- Table 22: Italy Machinable Ceramic Revenue (undefined) Forecast, by Application 2020 & 2033
- Table 23: Spain Machinable Ceramic Revenue (undefined) Forecast, by Application 2020 & 2033
- Table 24: Russia Machinable Ceramic Revenue (undefined) Forecast, by Application 2020 & 2033
- Table 25: Benelux Machinable Ceramic Revenue (undefined) Forecast, by Application 2020 & 2033
- Table 26: Nordics Machinable Ceramic Revenue (undefined) Forecast, by Application 2020 & 2033
- Table 27: Rest of Europe Machinable Ceramic Revenue (undefined) Forecast, by Application 2020 & 2033
- Table 28: Global Machinable Ceramic Revenue undefined Forecast, by Application 2020 & 2033
- Table 29: Global Machinable Ceramic Revenue undefined Forecast, by Types 2020 & 2033
- Table 30: Global Machinable Ceramic Revenue undefined Forecast, by Country 2020 & 2033
- Table 31: Turkey Machinable Ceramic Revenue (undefined) Forecast, by Application 2020 & 2033
- Table 32: Israel Machinable Ceramic Revenue (undefined) Forecast, by Application 2020 & 2033
- Table 33: GCC Machinable Ceramic Revenue (undefined) Forecast, by Application 2020 & 2033
- Table 34: North Africa Machinable Ceramic Revenue (undefined) Forecast, by Application 2020 & 2033
- Table 35: South Africa Machinable Ceramic Revenue (undefined) Forecast, by Application 2020 & 2033
- Table 36: Rest of Middle East & Africa Machinable Ceramic Revenue (undefined) Forecast, by Application 2020 & 2033
- Table 37: Global Machinable Ceramic Revenue undefined Forecast, by Application 2020 & 2033
- Table 38: Global Machinable Ceramic Revenue undefined Forecast, by Types 2020 & 2033
- Table 39: Global Machinable Ceramic Revenue undefined Forecast, by Country 2020 & 2033
- Table 40: China Machinable Ceramic Revenue (undefined) Forecast, by Application 2020 & 2033
- Table 41: India Machinable Ceramic Revenue (undefined) Forecast, by Application 2020 & 2033
- Table 42: Japan Machinable Ceramic Revenue (undefined) Forecast, by Application 2020 & 2033
- Table 43: South Korea Machinable Ceramic Revenue (undefined) Forecast, by Application 2020 & 2033
- Table 44: ASEAN Machinable Ceramic Revenue (undefined) Forecast, by Application 2020 & 2033
- Table 45: Oceania Machinable Ceramic Revenue (undefined) Forecast, by Application 2020 & 2033
- Table 46: Rest of Asia Pacific Machinable Ceramic Revenue (undefined) Forecast, by Application 2020 & 2033
Frequently Asked Questions
1. What is the projected Compound Annual Growth Rate (CAGR) of the Machinable Ceramic?
The projected CAGR is approximately 7.6%.
2. Which companies are prominent players in the Machinable Ceramic?
Key companies in the market include Corning, Tokuyama, Ferrotec, Crystex Composites, Aremco, Ariake Materials, Wuxi Creative Ceramic, INNOVACERA.
3. What are the main segments of the Machinable Ceramic?
The market segments include Application, Types.
4. Can you provide details about the market size?
The market size is estimated to be USD XXX N/A as of 2022.
5. What are some drivers contributing to market growth?
N/A
6. What are the notable trends driving market growth?
N/A
7. Are there any restraints impacting market growth?
N/A
8. Can you provide examples of recent developments in the market?
N/A
9. What pricing options are available for accessing the report?
Pricing options include single-user, multi-user, and enterprise licenses priced at USD 4900.00, USD 7350.00, and USD 9800.00 respectively.
10. Is the market size provided in terms of value or volume?
The market size is provided in terms of value, measured in N/A.
11. Are there any specific market keywords associated with the report?
Yes, the market keyword associated with the report is "Machinable Ceramic," which aids in identifying and referencing the specific market segment covered.
12. How do I determine which pricing option suits my needs best?
The pricing options vary based on user requirements and access needs. Individual users may opt for single-user licenses, while businesses requiring broader access may choose multi-user or enterprise licenses for cost-effective access to the report.
13. Are there any additional resources or data provided in the Machinable Ceramic report?
While the report offers comprehensive insights, it's advisable to review the specific contents or supplementary materials provided to ascertain if additional resources or data are available.
14. How can I stay updated on further developments or reports in the Machinable Ceramic?
To stay informed about further developments, trends, and reports in the Machinable Ceramic, consider subscribing to industry newsletters, following relevant companies and organizations, or regularly checking reputable industry news sources and publications.
Methodology
Step 1 - Identification of Relevant Samples Size from Population Database


Step 2 - Approaches for Defining Global Market Size (Value, Volume* & Price*)

Note*: In applicable scenarios
Step 3 - Data Sources
Primary Research
- Web Analytics
- Survey Reports
- Research Institute
- Latest Research Reports
- Opinion Leaders
Secondary Research
- Annual Reports
- White Paper
- Latest Press Release
- Industry Association
- Paid Database
- Investor Presentations

Step 4 - Data Triangulation
Involves using different sources of information in order to increase the validity of a study
These sources are likely to be stakeholders in a program - participants, other researchers, program staff, other community members, and so on.
Then we put all data in single framework & apply various statistical tools to find out the dynamic on the market.
During the analysis stage, feedback from the stakeholder groups would be compared to determine areas of agreement as well as areas of divergence