

Key Insights
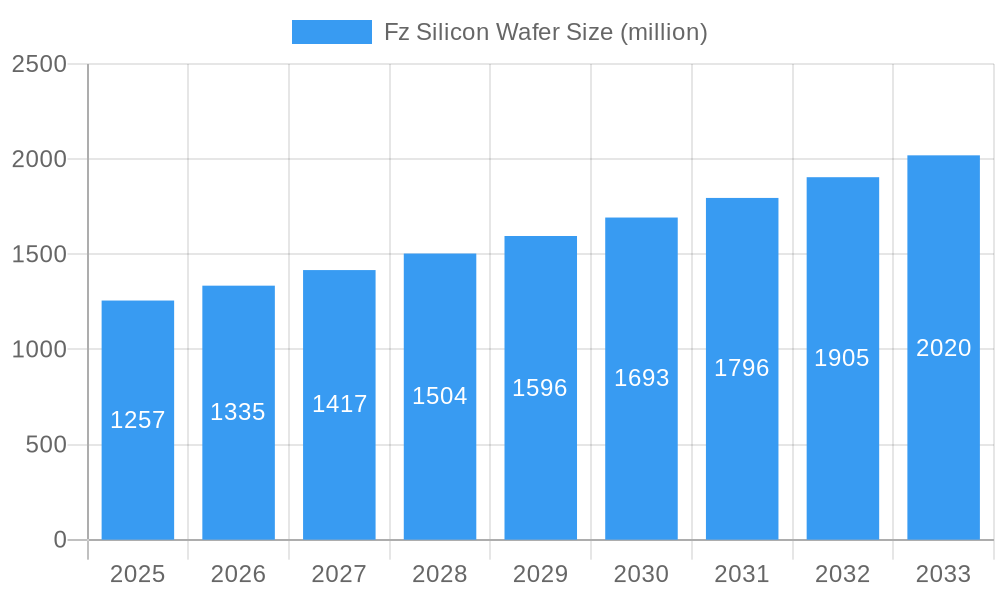
The FZ silicon wafer market, currently valued at $1257 million in 2025, is projected to experience robust growth, driven primarily by the increasing demand for high-performance electronics across diverse applications. The Compound Annual Growth Rate (CAGR) of 5.9% from 2025 to 2033 indicates a significant expansion of this market. Key application segments like power discrete devices, optoelectronic devices, and RF devices are fueling this growth, with power discrete devices currently holding the largest market share due to the rising adoption of electric vehicles and renewable energy technologies. The prevalent use of 8-inch wafers currently dominates the market, however, a gradual shift towards larger diameters is anticipated to meet the increasing need for higher yields and improved cost-efficiency in semiconductor manufacturing. Geographic distribution reveals strong market presence across North America and Asia-Pacific, with China and the United States emerging as major consumers. Continued technological advancements in silicon wafer manufacturing, coupled with supportive government policies and rising investments in the semiconductor industry, are poised to further propel market expansion. However, factors such as raw material price fluctuations and geopolitical uncertainties could potentially pose challenges to market growth in the coming years.
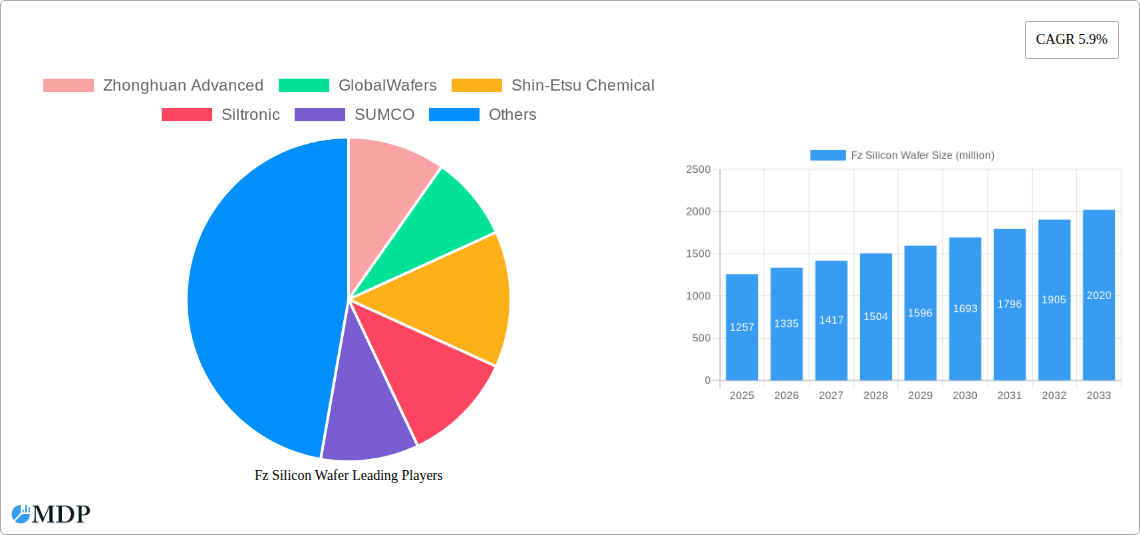
Fz Silicon Wafer Market Size (In Billion)
The competitive landscape is characterized by the presence of both established industry giants like GlobalWafers and Shin-Etsu Chemical, and emerging players like Beijing Jingyuntong Technology. These companies are engaged in continuous research and development to improve wafer quality, enhance production capacity, and develop innovative solutions to cater to the evolving needs of the semiconductor industry. The strategic partnerships and mergers and acquisitions within the industry are likely to reshape the market dynamics further, leading to increased consolidation and technological advancements. The market segmentation by type (less than 6 inch, 8 inch) reveals a clear preference for 8-inch wafers, although the demand for larger diameter wafers is expected to increase. This shift reflects the ongoing trend towards higher integration and miniaturization in semiconductor devices.
Fz Silicon Wafer Company Market Share
Fz Silicon Wafer Market Report: 2019-2033 – A Comprehensive Analysis
This comprehensive report provides an in-depth analysis of the global Fz Silicon Wafer market, covering the period 2019-2033. With a focus on market dynamics, industry trends, leading players, and future opportunities, this report is an essential resource for industry stakeholders, investors, and researchers seeking actionable insights into this rapidly evolving sector. The report leverages extensive data analysis to forecast a market valued at xx million by 2033, showcasing significant growth potential.
Fz Silicon Wafer Market Dynamics & Concentration
The Fz Silicon Wafer market is characterized by a moderate level of concentration, with key players like GlobalWafers, Shin-Etsu Chemical, Siltronic, and SUMCO holding significant market share. The combined market share of these top four players is estimated at xx%, as of 2025. Market dynamics are driven by continuous innovation in wafer manufacturing techniques, stringent regulatory frameworks governing semiconductor production, and the growing demand from diverse end-use sectors. Product substitution is minimal due to the specialized nature of Fz silicon wafers. End-user trends, particularly in the power electronics and optoelectronics sectors, significantly influence market demand. M&A activity has been relatively moderate in recent years, with approximately xx major deals recorded between 2019 and 2024. Future consolidation is anticipated, driven by the pursuit of economies of scale and technological leadership.
- Market Share: Top 4 players hold approximately xx% of the market share (2025).
- M&A Activity: Approximately xx major deals recorded between 2019 and 2024.
- Innovation Drivers: Advancements in crystal growth techniques and surface finishing processes.
- Regulatory Frameworks: Stringent environmental regulations impacting manufacturing processes.
Fz Silicon Wafer Industry Trends & Analysis
The Fz Silicon Wafer market exhibits a robust growth trajectory, projected to achieve a CAGR of xx% during the forecast period (2025-2033). This growth is primarily fueled by the escalating demand for high-performance electronic devices across various application segments. Technological advancements, such as the adoption of larger diameter wafers (e.g., 8-inch and beyond), are significantly contributing to improved efficiency and reduced costs. Consumer preferences for miniaturized, high-power, and energy-efficient devices are further driving the market expansion. The competitive landscape is characterized by intense rivalry among established players and emerging entrants, leading to continuous innovation and price competition. Market penetration of Fz silicon wafers in niche applications, such as RF devices, is steadily increasing. The increasing adoption of electric vehicles and renewable energy systems is also expected to significantly boost the demand for Fz silicon wafers in the coming years.
Leading Markets & Segments in Fz Silicon Wafer
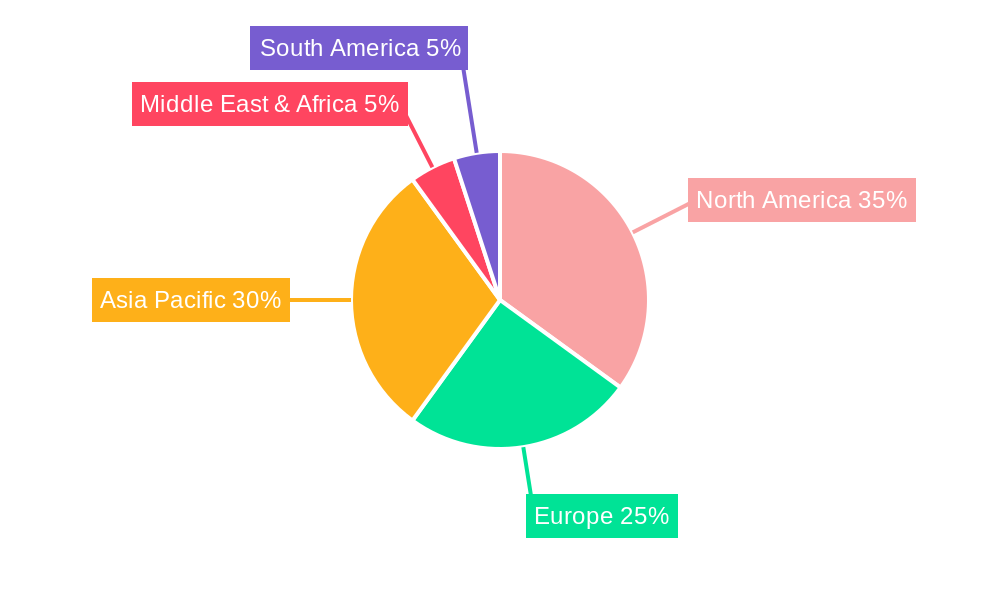
The Asia-Pacific region, particularly China, dominates the global Fz Silicon Wafer market, driven by the rapid expansion of the semiconductor industry in the region and supportive government policies promoting technological advancements. Within applications, Power Discrete Devices currently represents the largest segment, accounting for xx% of the market, followed by Optoelectronic Devices at xx%. The 8-inch wafer segment holds a significant market share due to its widespread adoption in high-volume manufacturing processes.
- Key Drivers (Asia-Pacific): Government incentives, strong domestic demand for electronics, robust infrastructure for semiconductor manufacturing.
- Dominant Application Segment: Power Discrete Devices (xx% market share).
- Dominant Wafer Type: 8-inch wafers.
Fz Silicon Wafer Product Developments
Recent product developments focus on enhancing wafer quality, improving defect density, and optimizing surface finish. Advancements in crystal growth techniques, such as magnetic Czochralski (MCZ) growth, are leading to improved wafer uniformity and yield. New applications are constantly emerging, particularly in high-frequency devices and advanced power electronics. These innovations are enhancing the competitive advantage of leading players and expanding the market's overall addressable market.
Key Drivers of Fz Silicon Wafer Growth
Several factors contribute to the market's robust growth. Technological advancements in wafer processing and material science are key drivers, enabling higher performance and efficiency in electronic devices. The growing demand for high-power electronics in electric vehicles, renewable energy systems, and industrial automation sectors fuels market growth. Government support and investment in semiconductor industries in various regions further stimulate demand.
Challenges in the Fz Silicon Wafer Market
The Fz Silicon Wafer market faces challenges, including fluctuations in raw material prices, complex and costly manufacturing processes, and intense competition among manufacturers. Supply chain disruptions can significantly impact production and availability, while stringent environmental regulations add to manufacturing costs. Geopolitical factors also pose a risk to market stability. These factors can lead to unpredictable price volatility and potential production bottlenecks.
Emerging Opportunities in Fz Silicon Wafer
Several emerging opportunities exist for growth. Advancements in materials science may lead to the development of novel Fz silicon wafer types with superior performance characteristics. Strategic partnerships between wafer manufacturers and device manufacturers can drive innovation and cost reduction. Expansion into new, high-growth application areas, such as 5G communication and sensor technologies, holds immense potential.
Leading Players in the Fz Silicon Wafer Sector
- Zhonghuan Advanced
- GlobalWafers
- Shin-Etsu Chemical
- Siltronic
- SUMCO
- Beijing Jingyuntong Technology
- Luoyang Hongtai Semiconductor
- Chengdu Qingyang Electronic
- GRINM Semiconductor Materials
- WaferPro
- PlutoSemi
Key Milestones in Fz Silicon Wafer Industry
- 2020: Introduction of a new generation of 8-inch Fz silicon wafers with improved defect density by Shin-Etsu Chemical.
- 2022: GlobalWafers announces significant investment in expanding its 300mm wafer production capacity.
- 2023: Several mergers and acquisitions among smaller players in the Fz silicon wafer industry.
Strategic Outlook for Fz Silicon Wafer Market
The Fz Silicon Wafer market holds substantial long-term growth potential, driven by continuous technological advancements, increasing demand from key application segments, and supportive government policies. Strategic opportunities exist for companies focusing on innovation, cost reduction, and strategic partnerships. The market is expected to witness increased consolidation, further shaping the competitive landscape in the coming years.
Fz Silicon Wafer Segmentation
-
1. Application
- 1.1. Power Discrete Devices
- 1.2. Optoelectronic Devices
- 1.3. RF Device
- 1.4. Other
-
2. Type
- 2.1. Less than 6 inch
- 2.2. 8 inch
Fz Silicon Wafer Segmentation By Geography
-
1. North America
- 1.1. United States
- 1.2. Canada
- 1.3. Mexico
-
2. South America
- 2.1. Brazil
- 2.2. Argentina
- 2.3. Rest of South America
-
3. Europe
- 3.1. United Kingdom
- 3.2. Germany
- 3.3. France
- 3.4. Italy
- 3.5. Spain
- 3.6. Russia
- 3.7. Benelux
- 3.8. Nordics
- 3.9. Rest of Europe
-
4. Middle East & Africa
- 4.1. Turkey
- 4.2. Israel
- 4.3. GCC
- 4.4. North Africa
- 4.5. South Africa
- 4.6. Rest of Middle East & Africa
-
5. Asia Pacific
- 5.1. China
- 5.2. India
- 5.3. Japan
- 5.4. South Korea
- 5.5. ASEAN
- 5.6. Oceania
- 5.7. Rest of Asia Pacific
Fz Silicon Wafer Regional Market Share
Geographic Coverage of Fz Silicon Wafer
Fz Silicon Wafer REPORT HIGHLIGHTS
| Aspects | Details |
|---|---|
| Study Period | 2020-2034 |
| Base Year | 2025 |
| Estimated Year | 2026 |
| Forecast Period | 2026-2034 |
| Historical Period | 2020-2025 |
| Growth Rate | CAGR of 5.9% from 2020-2034 |
| Segmentation |
|
Table of Contents
- 1. Introduction
- 1.1. Research Scope
- 1.2. Market Segmentation
- 1.3. Research Methodology
- 1.4. Definitions and Assumptions
- 2. Executive Summary
- 2.1. Introduction
- 3. Market Dynamics
- 3.1. Introduction
- 3.2. Market Drivers
- 3.3. Market Restrains
- 3.4. Market Trends
- 4. Market Factor Analysis
- 4.1. Porters Five Forces
- 4.2. Supply/Value Chain
- 4.3. PESTEL analysis
- 4.4. Market Entropy
- 4.5. Patent/Trademark Analysis
- 5. Global Fz Silicon Wafer Analysis, Insights and Forecast, 2020-2032
- 5.1. Market Analysis, Insights and Forecast - by Application
- 5.1.1. Power Discrete Devices
- 5.1.2. Optoelectronic Devices
- 5.1.3. RF Device
- 5.1.4. Other
- 5.2. Market Analysis, Insights and Forecast - by Type
- 5.2.1. Less than 6 inch
- 5.2.2. 8 inch
- 5.3. Market Analysis, Insights and Forecast - by Region
- 5.3.1. North America
- 5.3.2. South America
- 5.3.3. Europe
- 5.3.4. Middle East & Africa
- 5.3.5. Asia Pacific
- 5.1. Market Analysis, Insights and Forecast - by Application
- 6. North America Fz Silicon Wafer Analysis, Insights and Forecast, 2020-2032
- 6.1. Market Analysis, Insights and Forecast - by Application
- 6.1.1. Power Discrete Devices
- 6.1.2. Optoelectronic Devices
- 6.1.3. RF Device
- 6.1.4. Other
- 6.2. Market Analysis, Insights and Forecast - by Type
- 6.2.1. Less than 6 inch
- 6.2.2. 8 inch
- 6.1. Market Analysis, Insights and Forecast - by Application
- 7. South America Fz Silicon Wafer Analysis, Insights and Forecast, 2020-2032
- 7.1. Market Analysis, Insights and Forecast - by Application
- 7.1.1. Power Discrete Devices
- 7.1.2. Optoelectronic Devices
- 7.1.3. RF Device
- 7.1.4. Other
- 7.2. Market Analysis, Insights and Forecast - by Type
- 7.2.1. Less than 6 inch
- 7.2.2. 8 inch
- 7.1. Market Analysis, Insights and Forecast - by Application
- 8. Europe Fz Silicon Wafer Analysis, Insights and Forecast, 2020-2032
- 8.1. Market Analysis, Insights and Forecast - by Application
- 8.1.1. Power Discrete Devices
- 8.1.2. Optoelectronic Devices
- 8.1.3. RF Device
- 8.1.4. Other
- 8.2. Market Analysis, Insights and Forecast - by Type
- 8.2.1. Less than 6 inch
- 8.2.2. 8 inch
- 8.1. Market Analysis, Insights and Forecast - by Application
- 9. Middle East & Africa Fz Silicon Wafer Analysis, Insights and Forecast, 2020-2032
- 9.1. Market Analysis, Insights and Forecast - by Application
- 9.1.1. Power Discrete Devices
- 9.1.2. Optoelectronic Devices
- 9.1.3. RF Device
- 9.1.4. Other
- 9.2. Market Analysis, Insights and Forecast - by Type
- 9.2.1. Less than 6 inch
- 9.2.2. 8 inch
- 9.1. Market Analysis, Insights and Forecast - by Application
- 10. Asia Pacific Fz Silicon Wafer Analysis, Insights and Forecast, 2020-2032
- 10.1. Market Analysis, Insights and Forecast - by Application
- 10.1.1. Power Discrete Devices
- 10.1.2. Optoelectronic Devices
- 10.1.3. RF Device
- 10.1.4. Other
- 10.2. Market Analysis, Insights and Forecast - by Type
- 10.2.1. Less than 6 inch
- 10.2.2. 8 inch
- 10.1. Market Analysis, Insights and Forecast - by Application
- 11. Competitive Analysis
- 11.1. Global Market Share Analysis 2025
- 11.2. Company Profiles
- 11.2.1 Zhonghuan Advanced
- 11.2.1.1. Overview
- 11.2.1.2. Products
- 11.2.1.3. SWOT Analysis
- 11.2.1.4. Recent Developments
- 11.2.1.5. Financials (Based on Availability)
- 11.2.2 GlobalWafers
- 11.2.2.1. Overview
- 11.2.2.2. Products
- 11.2.2.3. SWOT Analysis
- 11.2.2.4. Recent Developments
- 11.2.2.5. Financials (Based on Availability)
- 11.2.3 Shin-Etsu Chemical
- 11.2.3.1. Overview
- 11.2.3.2. Products
- 11.2.3.3. SWOT Analysis
- 11.2.3.4. Recent Developments
- 11.2.3.5. Financials (Based on Availability)
- 11.2.4 Siltronic
- 11.2.4.1. Overview
- 11.2.4.2. Products
- 11.2.4.3. SWOT Analysis
- 11.2.4.4. Recent Developments
- 11.2.4.5. Financials (Based on Availability)
- 11.2.5 SUMCO
- 11.2.5.1. Overview
- 11.2.5.2. Products
- 11.2.5.3. SWOT Analysis
- 11.2.5.4. Recent Developments
- 11.2.5.5. Financials (Based on Availability)
- 11.2.6 Beijing Jingyuntong Technology
- 11.2.6.1. Overview
- 11.2.6.2. Products
- 11.2.6.3. SWOT Analysis
- 11.2.6.4. Recent Developments
- 11.2.6.5. Financials (Based on Availability)
- 11.2.7 Luoyang Hongtai Semiconductor
- 11.2.7.1. Overview
- 11.2.7.2. Products
- 11.2.7.3. SWOT Analysis
- 11.2.7.4. Recent Developments
- 11.2.7.5. Financials (Based on Availability)
- 11.2.8 Chengdu Qingyang Electronic
- 11.2.8.1. Overview
- 11.2.8.2. Products
- 11.2.8.3. SWOT Analysis
- 11.2.8.4. Recent Developments
- 11.2.8.5. Financials (Based on Availability)
- 11.2.9 GRINM Semiconductor Materials
- 11.2.9.1. Overview
- 11.2.9.2. Products
- 11.2.9.3. SWOT Analysis
- 11.2.9.4. Recent Developments
- 11.2.9.5. Financials (Based on Availability)
- 11.2.10 WaferPro
- 11.2.10.1. Overview
- 11.2.10.2. Products
- 11.2.10.3. SWOT Analysis
- 11.2.10.4. Recent Developments
- 11.2.10.5. Financials (Based on Availability)
- 11.2.11 PlutoSemi
- 11.2.11.1. Overview
- 11.2.11.2. Products
- 11.2.11.3. SWOT Analysis
- 11.2.11.4. Recent Developments
- 11.2.11.5. Financials (Based on Availability)
- 11.2.1 Zhonghuan Advanced
List of Figures
- Figure 1: Global Fz Silicon Wafer Revenue Breakdown (million, %) by Region 2025 & 2033
- Figure 2: Global Fz Silicon Wafer Volume Breakdown (K, %) by Region 2025 & 2033
- Figure 3: North America Fz Silicon Wafer Revenue (million), by Application 2025 & 2033
- Figure 4: North America Fz Silicon Wafer Volume (K), by Application 2025 & 2033
- Figure 5: North America Fz Silicon Wafer Revenue Share (%), by Application 2025 & 2033
- Figure 6: North America Fz Silicon Wafer Volume Share (%), by Application 2025 & 2033
- Figure 7: North America Fz Silicon Wafer Revenue (million), by Type 2025 & 2033
- Figure 8: North America Fz Silicon Wafer Volume (K), by Type 2025 & 2033
- Figure 9: North America Fz Silicon Wafer Revenue Share (%), by Type 2025 & 2033
- Figure 10: North America Fz Silicon Wafer Volume Share (%), by Type 2025 & 2033
- Figure 11: North America Fz Silicon Wafer Revenue (million), by Country 2025 & 2033
- Figure 12: North America Fz Silicon Wafer Volume (K), by Country 2025 & 2033
- Figure 13: North America Fz Silicon Wafer Revenue Share (%), by Country 2025 & 2033
- Figure 14: North America Fz Silicon Wafer Volume Share (%), by Country 2025 & 2033
- Figure 15: South America Fz Silicon Wafer Revenue (million), by Application 2025 & 2033
- Figure 16: South America Fz Silicon Wafer Volume (K), by Application 2025 & 2033
- Figure 17: South America Fz Silicon Wafer Revenue Share (%), by Application 2025 & 2033
- Figure 18: South America Fz Silicon Wafer Volume Share (%), by Application 2025 & 2033
- Figure 19: South America Fz Silicon Wafer Revenue (million), by Type 2025 & 2033
- Figure 20: South America Fz Silicon Wafer Volume (K), by Type 2025 & 2033
- Figure 21: South America Fz Silicon Wafer Revenue Share (%), by Type 2025 & 2033
- Figure 22: South America Fz Silicon Wafer Volume Share (%), by Type 2025 & 2033
- Figure 23: South America Fz Silicon Wafer Revenue (million), by Country 2025 & 2033
- Figure 24: South America Fz Silicon Wafer Volume (K), by Country 2025 & 2033
- Figure 25: South America Fz Silicon Wafer Revenue Share (%), by Country 2025 & 2033
- Figure 26: South America Fz Silicon Wafer Volume Share (%), by Country 2025 & 2033
- Figure 27: Europe Fz Silicon Wafer Revenue (million), by Application 2025 & 2033
- Figure 28: Europe Fz Silicon Wafer Volume (K), by Application 2025 & 2033
- Figure 29: Europe Fz Silicon Wafer Revenue Share (%), by Application 2025 & 2033
- Figure 30: Europe Fz Silicon Wafer Volume Share (%), by Application 2025 & 2033
- Figure 31: Europe Fz Silicon Wafer Revenue (million), by Type 2025 & 2033
- Figure 32: Europe Fz Silicon Wafer Volume (K), by Type 2025 & 2033
- Figure 33: Europe Fz Silicon Wafer Revenue Share (%), by Type 2025 & 2033
- Figure 34: Europe Fz Silicon Wafer Volume Share (%), by Type 2025 & 2033
- Figure 35: Europe Fz Silicon Wafer Revenue (million), by Country 2025 & 2033
- Figure 36: Europe Fz Silicon Wafer Volume (K), by Country 2025 & 2033
- Figure 37: Europe Fz Silicon Wafer Revenue Share (%), by Country 2025 & 2033
- Figure 38: Europe Fz Silicon Wafer Volume Share (%), by Country 2025 & 2033
- Figure 39: Middle East & Africa Fz Silicon Wafer Revenue (million), by Application 2025 & 2033
- Figure 40: Middle East & Africa Fz Silicon Wafer Volume (K), by Application 2025 & 2033
- Figure 41: Middle East & Africa Fz Silicon Wafer Revenue Share (%), by Application 2025 & 2033
- Figure 42: Middle East & Africa Fz Silicon Wafer Volume Share (%), by Application 2025 & 2033
- Figure 43: Middle East & Africa Fz Silicon Wafer Revenue (million), by Type 2025 & 2033
- Figure 44: Middle East & Africa Fz Silicon Wafer Volume (K), by Type 2025 & 2033
- Figure 45: Middle East & Africa Fz Silicon Wafer Revenue Share (%), by Type 2025 & 2033
- Figure 46: Middle East & Africa Fz Silicon Wafer Volume Share (%), by Type 2025 & 2033
- Figure 47: Middle East & Africa Fz Silicon Wafer Revenue (million), by Country 2025 & 2033
- Figure 48: Middle East & Africa Fz Silicon Wafer Volume (K), by Country 2025 & 2033
- Figure 49: Middle East & Africa Fz Silicon Wafer Revenue Share (%), by Country 2025 & 2033
- Figure 50: Middle East & Africa Fz Silicon Wafer Volume Share (%), by Country 2025 & 2033
- Figure 51: Asia Pacific Fz Silicon Wafer Revenue (million), by Application 2025 & 2033
- Figure 52: Asia Pacific Fz Silicon Wafer Volume (K), by Application 2025 & 2033
- Figure 53: Asia Pacific Fz Silicon Wafer Revenue Share (%), by Application 2025 & 2033
- Figure 54: Asia Pacific Fz Silicon Wafer Volume Share (%), by Application 2025 & 2033
- Figure 55: Asia Pacific Fz Silicon Wafer Revenue (million), by Type 2025 & 2033
- Figure 56: Asia Pacific Fz Silicon Wafer Volume (K), by Type 2025 & 2033
- Figure 57: Asia Pacific Fz Silicon Wafer Revenue Share (%), by Type 2025 & 2033
- Figure 58: Asia Pacific Fz Silicon Wafer Volume Share (%), by Type 2025 & 2033
- Figure 59: Asia Pacific Fz Silicon Wafer Revenue (million), by Country 2025 & 2033
- Figure 60: Asia Pacific Fz Silicon Wafer Volume (K), by Country 2025 & 2033
- Figure 61: Asia Pacific Fz Silicon Wafer Revenue Share (%), by Country 2025 & 2033
- Figure 62: Asia Pacific Fz Silicon Wafer Volume Share (%), by Country 2025 & 2033
List of Tables
- Table 1: Global Fz Silicon Wafer Revenue million Forecast, by Application 2020 & 2033
- Table 2: Global Fz Silicon Wafer Volume K Forecast, by Application 2020 & 2033
- Table 3: Global Fz Silicon Wafer Revenue million Forecast, by Type 2020 & 2033
- Table 4: Global Fz Silicon Wafer Volume K Forecast, by Type 2020 & 2033
- Table 5: Global Fz Silicon Wafer Revenue million Forecast, by Region 2020 & 2033
- Table 6: Global Fz Silicon Wafer Volume K Forecast, by Region 2020 & 2033
- Table 7: Global Fz Silicon Wafer Revenue million Forecast, by Application 2020 & 2033
- Table 8: Global Fz Silicon Wafer Volume K Forecast, by Application 2020 & 2033
- Table 9: Global Fz Silicon Wafer Revenue million Forecast, by Type 2020 & 2033
- Table 10: Global Fz Silicon Wafer Volume K Forecast, by Type 2020 & 2033
- Table 11: Global Fz Silicon Wafer Revenue million Forecast, by Country 2020 & 2033
- Table 12: Global Fz Silicon Wafer Volume K Forecast, by Country 2020 & 2033
- Table 13: United States Fz Silicon Wafer Revenue (million) Forecast, by Application 2020 & 2033
- Table 14: United States Fz Silicon Wafer Volume (K) Forecast, by Application 2020 & 2033
- Table 15: Canada Fz Silicon Wafer Revenue (million) Forecast, by Application 2020 & 2033
- Table 16: Canada Fz Silicon Wafer Volume (K) Forecast, by Application 2020 & 2033
- Table 17: Mexico Fz Silicon Wafer Revenue (million) Forecast, by Application 2020 & 2033
- Table 18: Mexico Fz Silicon Wafer Volume (K) Forecast, by Application 2020 & 2033
- Table 19: Global Fz Silicon Wafer Revenue million Forecast, by Application 2020 & 2033
- Table 20: Global Fz Silicon Wafer Volume K Forecast, by Application 2020 & 2033
- Table 21: Global Fz Silicon Wafer Revenue million Forecast, by Type 2020 & 2033
- Table 22: Global Fz Silicon Wafer Volume K Forecast, by Type 2020 & 2033
- Table 23: Global Fz Silicon Wafer Revenue million Forecast, by Country 2020 & 2033
- Table 24: Global Fz Silicon Wafer Volume K Forecast, by Country 2020 & 2033
- Table 25: Brazil Fz Silicon Wafer Revenue (million) Forecast, by Application 2020 & 2033
- Table 26: Brazil Fz Silicon Wafer Volume (K) Forecast, by Application 2020 & 2033
- Table 27: Argentina Fz Silicon Wafer Revenue (million) Forecast, by Application 2020 & 2033
- Table 28: Argentina Fz Silicon Wafer Volume (K) Forecast, by Application 2020 & 2033
- Table 29: Rest of South America Fz Silicon Wafer Revenue (million) Forecast, by Application 2020 & 2033
- Table 30: Rest of South America Fz Silicon Wafer Volume (K) Forecast, by Application 2020 & 2033
- Table 31: Global Fz Silicon Wafer Revenue million Forecast, by Application 2020 & 2033
- Table 32: Global Fz Silicon Wafer Volume K Forecast, by Application 2020 & 2033
- Table 33: Global Fz Silicon Wafer Revenue million Forecast, by Type 2020 & 2033
- Table 34: Global Fz Silicon Wafer Volume K Forecast, by Type 2020 & 2033
- Table 35: Global Fz Silicon Wafer Revenue million Forecast, by Country 2020 & 2033
- Table 36: Global Fz Silicon Wafer Volume K Forecast, by Country 2020 & 2033
- Table 37: United Kingdom Fz Silicon Wafer Revenue (million) Forecast, by Application 2020 & 2033
- Table 38: United Kingdom Fz Silicon Wafer Volume (K) Forecast, by Application 2020 & 2033
- Table 39: Germany Fz Silicon Wafer Revenue (million) Forecast, by Application 2020 & 2033
- Table 40: Germany Fz Silicon Wafer Volume (K) Forecast, by Application 2020 & 2033
- Table 41: France Fz Silicon Wafer Revenue (million) Forecast, by Application 2020 & 2033
- Table 42: France Fz Silicon Wafer Volume (K) Forecast, by Application 2020 & 2033
- Table 43: Italy Fz Silicon Wafer Revenue (million) Forecast, by Application 2020 & 2033
- Table 44: Italy Fz Silicon Wafer Volume (K) Forecast, by Application 2020 & 2033
- Table 45: Spain Fz Silicon Wafer Revenue (million) Forecast, by Application 2020 & 2033
- Table 46: Spain Fz Silicon Wafer Volume (K) Forecast, by Application 2020 & 2033
- Table 47: Russia Fz Silicon Wafer Revenue (million) Forecast, by Application 2020 & 2033
- Table 48: Russia Fz Silicon Wafer Volume (K) Forecast, by Application 2020 & 2033
- Table 49: Benelux Fz Silicon Wafer Revenue (million) Forecast, by Application 2020 & 2033
- Table 50: Benelux Fz Silicon Wafer Volume (K) Forecast, by Application 2020 & 2033
- Table 51: Nordics Fz Silicon Wafer Revenue (million) Forecast, by Application 2020 & 2033
- Table 52: Nordics Fz Silicon Wafer Volume (K) Forecast, by Application 2020 & 2033
- Table 53: Rest of Europe Fz Silicon Wafer Revenue (million) Forecast, by Application 2020 & 2033
- Table 54: Rest of Europe Fz Silicon Wafer Volume (K) Forecast, by Application 2020 & 2033
- Table 55: Global Fz Silicon Wafer Revenue million Forecast, by Application 2020 & 2033
- Table 56: Global Fz Silicon Wafer Volume K Forecast, by Application 2020 & 2033
- Table 57: Global Fz Silicon Wafer Revenue million Forecast, by Type 2020 & 2033
- Table 58: Global Fz Silicon Wafer Volume K Forecast, by Type 2020 & 2033
- Table 59: Global Fz Silicon Wafer Revenue million Forecast, by Country 2020 & 2033
- Table 60: Global Fz Silicon Wafer Volume K Forecast, by Country 2020 & 2033
- Table 61: Turkey Fz Silicon Wafer Revenue (million) Forecast, by Application 2020 & 2033
- Table 62: Turkey Fz Silicon Wafer Volume (K) Forecast, by Application 2020 & 2033
- Table 63: Israel Fz Silicon Wafer Revenue (million) Forecast, by Application 2020 & 2033
- Table 64: Israel Fz Silicon Wafer Volume (K) Forecast, by Application 2020 & 2033
- Table 65: GCC Fz Silicon Wafer Revenue (million) Forecast, by Application 2020 & 2033
- Table 66: GCC Fz Silicon Wafer Volume (K) Forecast, by Application 2020 & 2033
- Table 67: North Africa Fz Silicon Wafer Revenue (million) Forecast, by Application 2020 & 2033
- Table 68: North Africa Fz Silicon Wafer Volume (K) Forecast, by Application 2020 & 2033
- Table 69: South Africa Fz Silicon Wafer Revenue (million) Forecast, by Application 2020 & 2033
- Table 70: South Africa Fz Silicon Wafer Volume (K) Forecast, by Application 2020 & 2033
- Table 71: Rest of Middle East & Africa Fz Silicon Wafer Revenue (million) Forecast, by Application 2020 & 2033
- Table 72: Rest of Middle East & Africa Fz Silicon Wafer Volume (K) Forecast, by Application 2020 & 2033
- Table 73: Global Fz Silicon Wafer Revenue million Forecast, by Application 2020 & 2033
- Table 74: Global Fz Silicon Wafer Volume K Forecast, by Application 2020 & 2033
- Table 75: Global Fz Silicon Wafer Revenue million Forecast, by Type 2020 & 2033
- Table 76: Global Fz Silicon Wafer Volume K Forecast, by Type 2020 & 2033
- Table 77: Global Fz Silicon Wafer Revenue million Forecast, by Country 2020 & 2033
- Table 78: Global Fz Silicon Wafer Volume K Forecast, by Country 2020 & 2033
- Table 79: China Fz Silicon Wafer Revenue (million) Forecast, by Application 2020 & 2033
- Table 80: China Fz Silicon Wafer Volume (K) Forecast, by Application 2020 & 2033
- Table 81: India Fz Silicon Wafer Revenue (million) Forecast, by Application 2020 & 2033
- Table 82: India Fz Silicon Wafer Volume (K) Forecast, by Application 2020 & 2033
- Table 83: Japan Fz Silicon Wafer Revenue (million) Forecast, by Application 2020 & 2033
- Table 84: Japan Fz Silicon Wafer Volume (K) Forecast, by Application 2020 & 2033
- Table 85: South Korea Fz Silicon Wafer Revenue (million) Forecast, by Application 2020 & 2033
- Table 86: South Korea Fz Silicon Wafer Volume (K) Forecast, by Application 2020 & 2033
- Table 87: ASEAN Fz Silicon Wafer Revenue (million) Forecast, by Application 2020 & 2033
- Table 88: ASEAN Fz Silicon Wafer Volume (K) Forecast, by Application 2020 & 2033
- Table 89: Oceania Fz Silicon Wafer Revenue (million) Forecast, by Application 2020 & 2033
- Table 90: Oceania Fz Silicon Wafer Volume (K) Forecast, by Application 2020 & 2033
- Table 91: Rest of Asia Pacific Fz Silicon Wafer Revenue (million) Forecast, by Application 2020 & 2033
- Table 92: Rest of Asia Pacific Fz Silicon Wafer Volume (K) Forecast, by Application 2020 & 2033
Frequently Asked Questions
1. What is the projected Compound Annual Growth Rate (CAGR) of the Fz Silicon Wafer?
The projected CAGR is approximately 5.9%.
2. Which companies are prominent players in the Fz Silicon Wafer?
Key companies in the market include Zhonghuan Advanced, GlobalWafers, Shin-Etsu Chemical, Siltronic, SUMCO, Beijing Jingyuntong Technology, Luoyang Hongtai Semiconductor, Chengdu Qingyang Electronic, GRINM Semiconductor Materials, WaferPro, PlutoSemi.
3. What are the main segments of the Fz Silicon Wafer?
The market segments include Application, Type.
4. Can you provide details about the market size?
The market size is estimated to be USD 1257 million as of 2022.
5. What are some drivers contributing to market growth?
N/A
6. What are the notable trends driving market growth?
N/A
7. Are there any restraints impacting market growth?
N/A
8. Can you provide examples of recent developments in the market?
N/A
9. What pricing options are available for accessing the report?
Pricing options include single-user, multi-user, and enterprise licenses priced at USD 3950.00, USD 5925.00, and USD 7900.00 respectively.
10. Is the market size provided in terms of value or volume?
The market size is provided in terms of value, measured in million and volume, measured in K.
11. Are there any specific market keywords associated with the report?
Yes, the market keyword associated with the report is "Fz Silicon Wafer," which aids in identifying and referencing the specific market segment covered.
12. How do I determine which pricing option suits my needs best?
The pricing options vary based on user requirements and access needs. Individual users may opt for single-user licenses, while businesses requiring broader access may choose multi-user or enterprise licenses for cost-effective access to the report.
13. Are there any additional resources or data provided in the Fz Silicon Wafer report?
While the report offers comprehensive insights, it's advisable to review the specific contents or supplementary materials provided to ascertain if additional resources or data are available.
14. How can I stay updated on further developments or reports in the Fz Silicon Wafer?
To stay informed about further developments, trends, and reports in the Fz Silicon Wafer, consider subscribing to industry newsletters, following relevant companies and organizations, or regularly checking reputable industry news sources and publications.
Methodology
Step 1 - Identification of Relevant Samples Size from Population Database


Step 2 - Approaches for Defining Global Market Size (Value, Volume* & Price*)

Note*: In applicable scenarios
Step 3 - Data Sources
Primary Research
- Web Analytics
- Survey Reports
- Research Institute
- Latest Research Reports
- Opinion Leaders
Secondary Research
- Annual Reports
- White Paper
- Latest Press Release
- Industry Association
- Paid Database
- Investor Presentations

Step 4 - Data Triangulation
Involves using different sources of information in order to increase the validity of a study
These sources are likely to be stakeholders in a program - participants, other researchers, program staff, other community members, and so on.
Then we put all data in single framework & apply various statistical tools to find out the dynamic on the market.
During the analysis stage, feedback from the stakeholder groups would be compared to determine areas of agreement as well as areas of divergence