

Key Insights
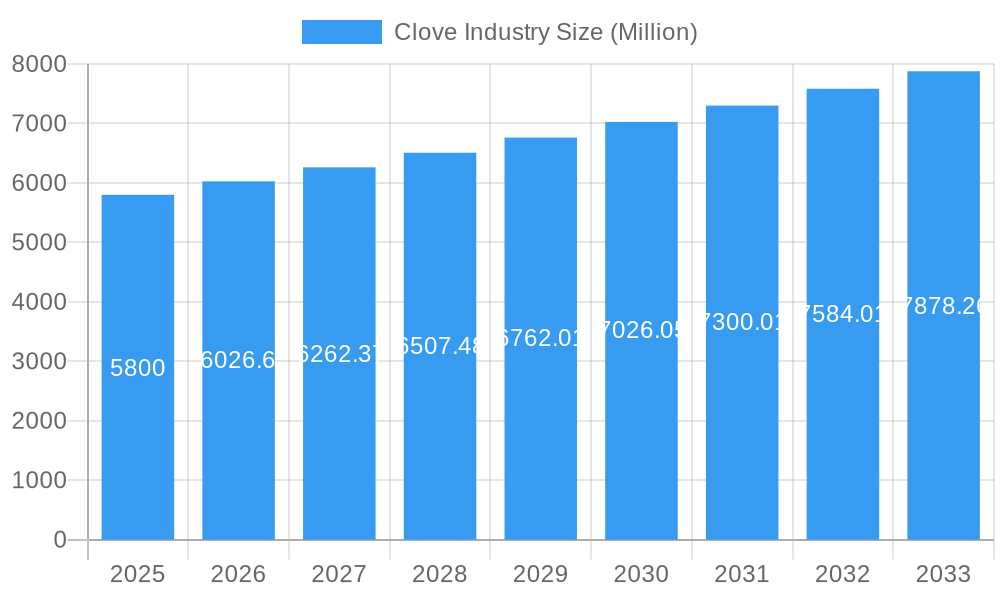
The global clove industry, valued at $5.80 billion in 2025, is projected to experience steady growth, driven primarily by increasing demand in the culinary and medicinal sectors. The compound annual growth rate (CAGR) of 3.70% from 2025 to 2033 indicates a robust market outlook. Growth is fueled by the rising popularity of clove-infused foods and beverages globally, alongside its traditional and increasingly recognized medicinal applications, including its antimicrobial and antioxidant properties. Furthermore, the expansion of the food processing industry and the increasing adoption of cloves as a natural flavoring and preservative are contributing significantly to market expansion. While challenges such as fluctuating clove prices due to weather patterns and variations in crop yields exist, innovation in clove extraction methods and the emergence of value-added clove products are mitigating these factors. The Asia-Pacific region, particularly Indonesia, is expected to remain a dominant player due to its significant clove production. However, increasing demand from North America and Europe presents promising growth opportunities for clove producers and exporters. The market segmentation, with clove buds and clove oil as key product types, caters to diverse consumer preferences and applications within the culinary and medicinal sectors. Competition among key players like PT Sartika Clove Trading and Tanjung Sari Clove Trading will likely remain intense, focusing on product quality, pricing strategies, and market reach.
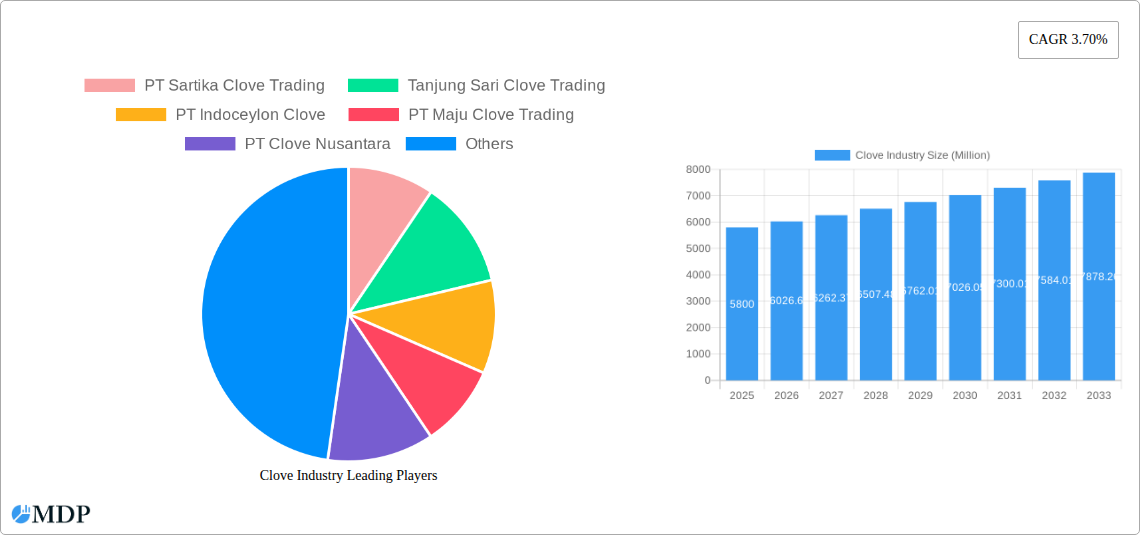
Clove Industry Market Size (In Billion)
The forecast period from 2025 to 2033 shows a continued expansion of the clove market, primarily due to increasing consumer awareness of clove's health benefits and its versatility as a culinary ingredient. Significant growth is anticipated in emerging markets with rising disposable incomes and a growing preference for natural and organic products. Companies are investing in research and development to explore new clove-based products and improve extraction techniques, leading to higher quality and more efficient production. Supply chain optimization and strategic partnerships with distributors are also crucial factors contributing to market expansion. The industry is also adapting to sustainable harvesting practices to ensure long-term market viability. Government regulations related to food safety and quality standards are expected to further influence market dynamics during the forecast period.
Clove Industry Company Market Share
Clove Industry Market Report: 2019-2033 - A Comprehensive Analysis
This in-depth report provides a comprehensive analysis of the global clove industry, offering crucial insights for stakeholders, investors, and industry professionals. From market dynamics and leading players to emerging opportunities and future trends, this report covers all aspects of the clove market, projecting a xx Million USD market value by 2033. The report uses data from the historical period (2019-2024), base year (2025), and estimated year (2025) to forecast market trends until 2033.
Clove Industry Market Dynamics & Concentration
This section analyzes the competitive landscape of the clove industry, focusing on market concentration, innovation, regulatory changes, substitutes, end-user trends, and mergers & acquisitions (M&A) activity from 2019-2033. The market is characterized by a moderate level of concentration, with key players such as PT Sartika Clove Trading, Tanjung Sari Clove Trading, PT Indoceylon Clove, PT Maju Clove Trading, and PT Clove Nusantara holding significant market share. However, the emergence of smaller players and potential for consolidation through M&A activities could reshape this landscape.
- Market Concentration: The Herfindahl-Hirschman Index (HHI) for the clove market is estimated at xx in 2025, indicating a moderately concentrated market. This is projected to slightly increase to xx by 2033, driven by anticipated M&A activity.
- Innovation Drivers: Increased demand for high-quality clove oil for medicinal and culinary applications is driving innovation in extraction methods and product development.
- Regulatory Frameworks: Government regulations regarding pesticide use and food safety standards significantly influence clove production and trade.
- Product Substitutes: Limited direct substitutes exist for cloves, although other spices can be used as alternatives in specific culinary applications. This creates a relatively stable market for clove producers.
- End-User Trends: Growing health consciousness and the increasing popularity of traditional and herbal medicines are key drivers of demand for clove products.
- M&A Activities: An estimated xx M&A deals occurred between 2019 and 2024 in the clove industry. We forecast xx deals during the forecast period (2025-2033), primarily driven by consolidation amongst smaller players.
Clove Industry Industry Trends & Analysis
This section delves into the key trends shaping the clove industry, encompassing market growth drivers, technological advancements, consumer preferences, and competitive dynamics. The global clove market experienced a CAGR of xx% during the historical period (2019-2024). We project a CAGR of xx% from 2025-2033, driven by factors such as the rising demand for organic cloves and the expanding applications of clove oil in various industries. Market penetration of clove products in emerging markets remains significant, with a projected penetration rate of xx% by 2033.
The competitive landscape is characterized by both established players and emerging businesses, each with its unique strengths and strategies. Technological advancements in clove cultivation, extraction techniques, and processing methods enhance efficiency and product quality. Changes in consumer preferences towards natural and organic products significantly impact market dynamics.
Leading Markets & Segments in Clove Industry
This section identifies the dominant regions, countries, and segments within the clove industry (Product Type: Clove Buds, Clove Oil; Application: Culinary, Medicinal). Indonesia is projected to remain the leading producer and exporter of cloves, holding xx% of the global market share in 2025.
- Key Drivers for Indonesia's Dominance:
- Favorable Climate and Soil Conditions: Ideal growing conditions contribute to high yields and superior quality cloves.
- Established Supply Chains: Well-established cultivation, processing, and export infrastructure supports efficient production and distribution.
- Government Support: Government policies and incentives promote clove cultivation and export.
Culinary applications currently hold the largest market share, driven by the widespread use of cloves in various cuisines worldwide. However, the medicinal segment is experiencing significant growth due to increasing consumer interest in natural remedies. The demand for clove oil is rising rapidly, due to its versatility in cosmetics, pharmaceuticals, and aromatherapy, and projects a CAGR of xx% from 2025-2033.
Clove Industry Product Developments
Recent years have witnessed significant advancements in clove product development, particularly in the areas of extraction methods and value-added products. Innovations include the development of sustainable and efficient clove oil extraction techniques that minimize environmental impact. The expansion of clove applications in functional foods, beverages, and personal care products reflects the increasing awareness of clove's health benefits. These developments contribute to the growth of the clove industry by providing consumers with a wider array of high-quality and value-added products.
Key Drivers of Clove Industry Growth
Several factors contribute to the sustained growth of the clove industry. The increasing demand for natural and organic ingredients in food and beverages is a primary driver. The growing popularity of traditional medicine and aromatherapy further boosts demand for clove oil. Technological advancements in clove cultivation, processing, and extraction techniques lead to increased efficiency and improved product quality. Favorable government policies and initiatives supporting the clove industry in key producing countries also contribute to market growth.
Challenges in the Clove Industry Market
The clove industry faces several challenges. Fluctuations in clove prices due to climate change and unpredictable weather patterns directly impact farmer incomes. Supply chain disruptions and logistical challenges can impede timely product delivery. Intense competition from other spice producers requires ongoing innovation and differentiation strategies to maintain market share. Meeting stringent food safety and quality standards necessitates significant investment in production and processing facilities.
Emerging Opportunities in Clove Industry
Several opportunities exist for long-term growth within the clove industry. The expanding application of clove extract in pharmaceuticals and nutraceuticals presents a promising avenue for growth. Strategic collaborations between clove producers and food and beverage companies can drive market penetration. The exploration of new markets in regions with growing demand for natural and organic products can unlock significant opportunities for expansion. Investment in sustainable and eco-friendly clove cultivation practices can enhance brand reputation and appeal to environmentally conscious consumers.
Leading Players in the Clove Industry Sector
- PT Sartika Clove Trading
- Tanjung Sari Clove Trading
- PT Indoceylon Clove
- PT Maju Clove Trading
- PT Clove Nusantara
Key Milestones in Clove Industry Industry
- 2020: Introduction of a new clove oil extraction method by PT Indoceylon Clove, improving yield and quality.
- 2022: Successful launch of a new organic clove product line by PT Maju Clove Trading.
- 2023: Acquisition of a smaller clove producer by PT Sartika Clove Trading, increasing its market share.
- 2024: Implementation of a new sustainable farming initiative by PT Clove Nusantara.
Strategic Outlook for Clove Industry Market
The future of the clove industry looks promising. The global market is expected to continue to expand, driven by increasing demand and ongoing product innovation. Strategic partnerships, sustainable practices, and effective marketing campaigns will play a crucial role in achieving long-term success. Companies that adapt to changing consumer preferences and technological advancements are well-positioned to capitalize on emerging opportunities within this dynamic market. The focus on value-added products, health and wellness benefits, and eco-friendly practices will be critical to fostering sustainable growth.
Clove Industry Segmentation
- 1. Production Analysis
- 2. Consumption Analysis
- 3. Import Market Analysis (Value & Volume)
- 4. Export Market Analysis (Value & Volume)
- 5. Price Trend Analysis
Clove Industry Segmentation By Geography
-
1. North America
- 1.1. United States
-
2. Europe
- 2.1. United Kingdom
- 2.2. Germany
- 2.3. France
-
3. Asia Pacific
- 3.1. Indonesia
- 3.2. China
- 3.3. India
- 3.4. Singapore
- 3.5. Malaysia
- 3.6. Sri Lanka
- 3.7. Vietnam
- 4. Middle East
-
5. Madagascar
- 5.1. Kingdom of Saudi Arabia
- 5.2. United Arab Emirates
- 5.3. Kenya
- 5.4. Comoros
- 5.5. Tanzania
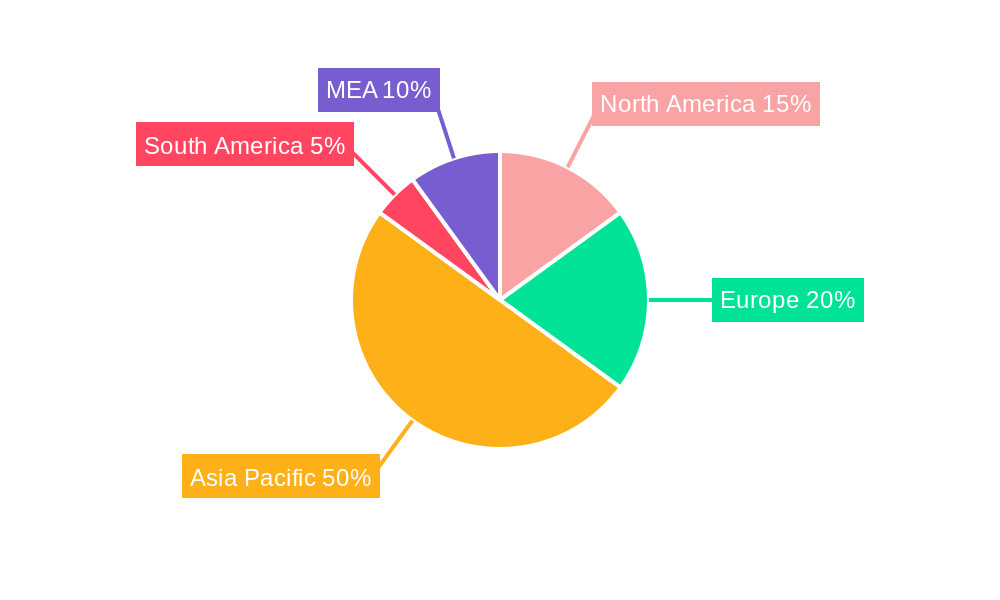
Clove Industry Regional Market Share
Geographic Coverage of Clove Industry
Clove Industry REPORT HIGHLIGHTS
| Aspects | Details |
|---|---|
| Study Period | 2020-2034 |
| Base Year | 2025 |
| Estimated Year | 2026 |
| Forecast Period | 2026-2034 |
| Historical Period | 2020-2025 |
| Growth Rate | CAGR of 3.70% from 2020-2034 |
| Segmentation |
|
Table of Contents
- 1. Introduction
- 1.1. Research Scope
- 1.2. Market Segmentation
- 1.3. Research Objective
- 1.4. Definitions and Assumptions
- 2. Executive Summary
- 2.1. Market Snapshot
- 3. Market Dynamics
- 3.1. Market Drivers
- 3.2. Market Restrains
- 3.3. Market Trends
- 3.4. Market Opportunities
- 4. Market Factor Analysis
- 4.1. Porters Five Forces
- 4.1.1. Bargaining Power of Suppliers
- 4.1.2. Bargaining Power of Buyers
- 4.1.3. Threat of New Entrants
- 4.1.4. Threat of Substitutes
- 4.1.5. Competitive Rivalry
- 4.2. PESTEL analysis
- 4.3. BCG Analysis
- 4.3.1. Stars (High Growth, High Market Share)
- 4.3.2. Cash Cows (Low Growth, High Market Share)
- 4.3.3. Question Mark (High Growth, Low Market Share)
- 4.3.4. Dogs (Low Growth, Low Market Share)
- 4.4. Ansoff Matrix Analysis
- 4.5. Supply Chain Analysis
- 4.6. Regulatory Landscape
- 4.7. Current Market Potential and Opportunity Assessment (TAM–SAM–SOM Framework)
- 4.8. MDP Analyst Note
- 4.1. Porters Five Forces
- 5. Market Analysis, Insights and Forecast 2021-2033
- 5.1. Market Analysis, Insights and Forecast - by Production Analysis
- 5.2. Market Analysis, Insights and Forecast - by Consumption Analysis
- 5.3. Market Analysis, Insights and Forecast - by Import Market Analysis (Value & Volume)
- 5.4. Market Analysis, Insights and Forecast - by Export Market Analysis (Value & Volume)
- 5.5. Market Analysis, Insights and Forecast - by Price Trend Analysis
- 5.6. Market Analysis, Insights and Forecast - by Region
- 5.6.1. North America
- 5.6.2. Europe
- 5.6.3. Asia Pacific
- 5.6.4. Middle East
- 5.6.5. Madagascar
- 6. Global Clove Industry Analysis, Insights and Forecast, 2021-2033
- 6.1. Market Analysis, Insights and Forecast - by Production Analysis
- 6.2. Market Analysis, Insights and Forecast - by Consumption Analysis
- 6.3. Market Analysis, Insights and Forecast - by Import Market Analysis (Value & Volume)
- 6.4. Market Analysis, Insights and Forecast - by Export Market Analysis (Value & Volume)
- 6.5. Market Analysis, Insights and Forecast - by Price Trend Analysis
- 7. North America Clove Industry Analysis, Insights and Forecast, 2020-2032
- 7.1. Market Analysis, Insights and Forecast - by Production Analysis
- 7.2. Market Analysis, Insights and Forecast - by Consumption Analysis
- 7.3. Market Analysis, Insights and Forecast - by Import Market Analysis (Value & Volume)
- 7.4. Market Analysis, Insights and Forecast - by Export Market Analysis (Value & Volume)
- 7.5. Market Analysis, Insights and Forecast - by Price Trend Analysis
- 8. Europe Clove Industry Analysis, Insights and Forecast, 2020-2032
- 8.1. Market Analysis, Insights and Forecast - by Production Analysis
- 8.2. Market Analysis, Insights and Forecast - by Consumption Analysis
- 8.3. Market Analysis, Insights and Forecast - by Import Market Analysis (Value & Volume)
- 8.4. Market Analysis, Insights and Forecast - by Export Market Analysis (Value & Volume)
- 8.5. Market Analysis, Insights and Forecast - by Price Trend Analysis
- 9. Asia Pacific Clove Industry Analysis, Insights and Forecast, 2020-2032
- 9.1. Market Analysis, Insights and Forecast - by Production Analysis
- 9.2. Market Analysis, Insights and Forecast - by Consumption Analysis
- 9.3. Market Analysis, Insights and Forecast - by Import Market Analysis (Value & Volume)
- 9.4. Market Analysis, Insights and Forecast - by Export Market Analysis (Value & Volume)
- 9.5. Market Analysis, Insights and Forecast - by Price Trend Analysis
- 10. Middle East Clove Industry Analysis, Insights and Forecast, 2020-2032
- 10.1. Market Analysis, Insights and Forecast - by Production Analysis
- 10.2. Market Analysis, Insights and Forecast - by Consumption Analysis
- 10.3. Market Analysis, Insights and Forecast - by Import Market Analysis (Value & Volume)
- 10.4. Market Analysis, Insights and Forecast - by Export Market Analysis (Value & Volume)
- 10.5. Market Analysis, Insights and Forecast - by Price Trend Analysis
- 11. Madagascar Clove Industry Analysis, Insights and Forecast, 2020-2032
- 11.1. Market Analysis, Insights and Forecast - by Production Analysis
- 11.2. Market Analysis, Insights and Forecast - by Consumption Analysis
- 11.3. Market Analysis, Insights and Forecast - by Import Market Analysis (Value & Volume)
- 11.4. Market Analysis, Insights and Forecast - by Export Market Analysis (Value & Volume)
- 11.5. Market Analysis, Insights and Forecast - by Price Trend Analysis
- 12. Competitive Analysis
- 12.1. Company Profiles
- 12.1.1 PT Sartika Clove Trading
- 12.1.1.1. Company Overview
- 12.1.1.2. Products
- 12.1.1.3. Company Financials
- 12.1.1.4. SWOT Analysis
- 12.1.2 Tanjung Sari Clove Trading
- 12.1.2.1. Company Overview
- 12.1.2.2. Products
- 12.1.2.3. Company Financials
- 12.1.2.4. SWOT Analysis
- 12.1.3 PT Indoceylon Clove
- 12.1.3.1. Company Overview
- 12.1.3.2. Products
- 12.1.3.3. Company Financials
- 12.1.3.4. SWOT Analysis
- 12.1.4 PT Maju Clove Trading
- 12.1.4.1. Company Overview
- 12.1.4.2. Products
- 12.1.4.3. Company Financials
- 12.1.4.4. SWOT Analysis
- 12.1.5 PT Clove Nusantara
- 12.1.5.1. Company Overview
- 12.1.5.2. Products
- 12.1.5.3. Company Financials
- 12.1.5.4. SWOT Analysis
- 12.1.1 PT Sartika Clove Trading
- 12.2. Market Entropy
- 12.2.1 Company's Key Areas Served
- 12.2.2 Recent Developments
- 12.3. Company Market Share Analysis 2025
- 12.3.1 Top 5 Companies Market Share Analysis
- 12.3.2 Top 3 Companies Market Share Analysis
- 12.4. List of Potential Customers
- 13. Research Methodology
List of Figures
- Figure 1: Global Clove Industry Revenue Breakdown (Million, %) by Region 2025 & 2033
- Figure 2: North America Clove Industry Revenue (Million), by Production Analysis 2025 & 2033
- Figure 3: North America Clove Industry Revenue Share (%), by Production Analysis 2025 & 2033
- Figure 4: North America Clove Industry Revenue (Million), by Consumption Analysis 2025 & 2033
- Figure 5: North America Clove Industry Revenue Share (%), by Consumption Analysis 2025 & 2033
- Figure 6: North America Clove Industry Revenue (Million), by Import Market Analysis (Value & Volume) 2025 & 2033
- Figure 7: North America Clove Industry Revenue Share (%), by Import Market Analysis (Value & Volume) 2025 & 2033
- Figure 8: North America Clove Industry Revenue (Million), by Export Market Analysis (Value & Volume) 2025 & 2033
- Figure 9: North America Clove Industry Revenue Share (%), by Export Market Analysis (Value & Volume) 2025 & 2033
- Figure 10: North America Clove Industry Revenue (Million), by Price Trend Analysis 2025 & 2033
- Figure 11: North America Clove Industry Revenue Share (%), by Price Trend Analysis 2025 & 2033
- Figure 12: North America Clove Industry Revenue (Million), by Country 2025 & 2033
- Figure 13: North America Clove Industry Revenue Share (%), by Country 2025 & 2033
- Figure 14: Europe Clove Industry Revenue (Million), by Production Analysis 2025 & 2033
- Figure 15: Europe Clove Industry Revenue Share (%), by Production Analysis 2025 & 2033
- Figure 16: Europe Clove Industry Revenue (Million), by Consumption Analysis 2025 & 2033
- Figure 17: Europe Clove Industry Revenue Share (%), by Consumption Analysis 2025 & 2033
- Figure 18: Europe Clove Industry Revenue (Million), by Import Market Analysis (Value & Volume) 2025 & 2033
- Figure 19: Europe Clove Industry Revenue Share (%), by Import Market Analysis (Value & Volume) 2025 & 2033
- Figure 20: Europe Clove Industry Revenue (Million), by Export Market Analysis (Value & Volume) 2025 & 2033
- Figure 21: Europe Clove Industry Revenue Share (%), by Export Market Analysis (Value & Volume) 2025 & 2033
- Figure 22: Europe Clove Industry Revenue (Million), by Price Trend Analysis 2025 & 2033
- Figure 23: Europe Clove Industry Revenue Share (%), by Price Trend Analysis 2025 & 2033
- Figure 24: Europe Clove Industry Revenue (Million), by Country 2025 & 2033
- Figure 25: Europe Clove Industry Revenue Share (%), by Country 2025 & 2033
- Figure 26: Asia Pacific Clove Industry Revenue (Million), by Production Analysis 2025 & 2033
- Figure 27: Asia Pacific Clove Industry Revenue Share (%), by Production Analysis 2025 & 2033
- Figure 28: Asia Pacific Clove Industry Revenue (Million), by Consumption Analysis 2025 & 2033
- Figure 29: Asia Pacific Clove Industry Revenue Share (%), by Consumption Analysis 2025 & 2033
- Figure 30: Asia Pacific Clove Industry Revenue (Million), by Import Market Analysis (Value & Volume) 2025 & 2033
- Figure 31: Asia Pacific Clove Industry Revenue Share (%), by Import Market Analysis (Value & Volume) 2025 & 2033
- Figure 32: Asia Pacific Clove Industry Revenue (Million), by Export Market Analysis (Value & Volume) 2025 & 2033
- Figure 33: Asia Pacific Clove Industry Revenue Share (%), by Export Market Analysis (Value & Volume) 2025 & 2033
- Figure 34: Asia Pacific Clove Industry Revenue (Million), by Price Trend Analysis 2025 & 2033
- Figure 35: Asia Pacific Clove Industry Revenue Share (%), by Price Trend Analysis 2025 & 2033
- Figure 36: Asia Pacific Clove Industry Revenue (Million), by Country 2025 & 2033
- Figure 37: Asia Pacific Clove Industry Revenue Share (%), by Country 2025 & 2033
- Figure 38: Middle East Clove Industry Revenue (Million), by Production Analysis 2025 & 2033
- Figure 39: Middle East Clove Industry Revenue Share (%), by Production Analysis 2025 & 2033
- Figure 40: Middle East Clove Industry Revenue (Million), by Consumption Analysis 2025 & 2033
- Figure 41: Middle East Clove Industry Revenue Share (%), by Consumption Analysis 2025 & 2033
- Figure 42: Middle East Clove Industry Revenue (Million), by Import Market Analysis (Value & Volume) 2025 & 2033
- Figure 43: Middle East Clove Industry Revenue Share (%), by Import Market Analysis (Value & Volume) 2025 & 2033
- Figure 44: Middle East Clove Industry Revenue (Million), by Export Market Analysis (Value & Volume) 2025 & 2033
- Figure 45: Middle East Clove Industry Revenue Share (%), by Export Market Analysis (Value & Volume) 2025 & 2033
- Figure 46: Middle East Clove Industry Revenue (Million), by Price Trend Analysis 2025 & 2033
- Figure 47: Middle East Clove Industry Revenue Share (%), by Price Trend Analysis 2025 & 2033
- Figure 48: Middle East Clove Industry Revenue (Million), by Country 2025 & 2033
- Figure 49: Middle East Clove Industry Revenue Share (%), by Country 2025 & 2033
- Figure 50: Madagascar Clove Industry Revenue (Million), by Production Analysis 2025 & 2033
- Figure 51: Madagascar Clove Industry Revenue Share (%), by Production Analysis 2025 & 2033
- Figure 52: Madagascar Clove Industry Revenue (Million), by Consumption Analysis 2025 & 2033
- Figure 53: Madagascar Clove Industry Revenue Share (%), by Consumption Analysis 2025 & 2033
- Figure 54: Madagascar Clove Industry Revenue (Million), by Import Market Analysis (Value & Volume) 2025 & 2033
- Figure 55: Madagascar Clove Industry Revenue Share (%), by Import Market Analysis (Value & Volume) 2025 & 2033
- Figure 56: Madagascar Clove Industry Revenue (Million), by Export Market Analysis (Value & Volume) 2025 & 2033
- Figure 57: Madagascar Clove Industry Revenue Share (%), by Export Market Analysis (Value & Volume) 2025 & 2033
- Figure 58: Madagascar Clove Industry Revenue (Million), by Price Trend Analysis 2025 & 2033
- Figure 59: Madagascar Clove Industry Revenue Share (%), by Price Trend Analysis 2025 & 2033
- Figure 60: Madagascar Clove Industry Revenue (Million), by Country 2025 & 2033
- Figure 61: Madagascar Clove Industry Revenue Share (%), by Country 2025 & 2033
List of Tables
- Table 1: Global Clove Industry Revenue Million Forecast, by Production Analysis 2020 & 2033
- Table 2: Global Clove Industry Revenue Million Forecast, by Consumption Analysis 2020 & 2033
- Table 3: Global Clove Industry Revenue Million Forecast, by Import Market Analysis (Value & Volume) 2020 & 2033
- Table 4: Global Clove Industry Revenue Million Forecast, by Export Market Analysis (Value & Volume) 2020 & 2033
- Table 5: Global Clove Industry Revenue Million Forecast, by Price Trend Analysis 2020 & 2033
- Table 6: Global Clove Industry Revenue Million Forecast, by Region 2020 & 2033
- Table 7: Global Clove Industry Revenue Million Forecast, by Production Analysis 2020 & 2033
- Table 8: Global Clove Industry Revenue Million Forecast, by Consumption Analysis 2020 & 2033
- Table 9: Global Clove Industry Revenue Million Forecast, by Import Market Analysis (Value & Volume) 2020 & 2033
- Table 10: Global Clove Industry Revenue Million Forecast, by Export Market Analysis (Value & Volume) 2020 & 2033
- Table 11: Global Clove Industry Revenue Million Forecast, by Price Trend Analysis 2020 & 2033
- Table 12: Global Clove Industry Revenue Million Forecast, by Country 2020 & 2033
- Table 13: United States Clove Industry Revenue (Million) Forecast, by Application 2020 & 2033
- Table 14: Global Clove Industry Revenue Million Forecast, by Production Analysis 2020 & 2033
- Table 15: Global Clove Industry Revenue Million Forecast, by Consumption Analysis 2020 & 2033
- Table 16: Global Clove Industry Revenue Million Forecast, by Import Market Analysis (Value & Volume) 2020 & 2033
- Table 17: Global Clove Industry Revenue Million Forecast, by Export Market Analysis (Value & Volume) 2020 & 2033
- Table 18: Global Clove Industry Revenue Million Forecast, by Price Trend Analysis 2020 & 2033
- Table 19: Global Clove Industry Revenue Million Forecast, by Country 2020 & 2033
- Table 20: United Kingdom Clove Industry Revenue (Million) Forecast, by Application 2020 & 2033
- Table 21: Germany Clove Industry Revenue (Million) Forecast, by Application 2020 & 2033
- Table 22: France Clove Industry Revenue (Million) Forecast, by Application 2020 & 2033
- Table 23: Global Clove Industry Revenue Million Forecast, by Production Analysis 2020 & 2033
- Table 24: Global Clove Industry Revenue Million Forecast, by Consumption Analysis 2020 & 2033
- Table 25: Global Clove Industry Revenue Million Forecast, by Import Market Analysis (Value & Volume) 2020 & 2033
- Table 26: Global Clove Industry Revenue Million Forecast, by Export Market Analysis (Value & Volume) 2020 & 2033
- Table 27: Global Clove Industry Revenue Million Forecast, by Price Trend Analysis 2020 & 2033
- Table 28: Global Clove Industry Revenue Million Forecast, by Country 2020 & 2033
- Table 29: Indonesia Clove Industry Revenue (Million) Forecast, by Application 2020 & 2033
- Table 30: China Clove Industry Revenue (Million) Forecast, by Application 2020 & 2033
- Table 31: India Clove Industry Revenue (Million) Forecast, by Application 2020 & 2033
- Table 32: Singapore Clove Industry Revenue (Million) Forecast, by Application 2020 & 2033
- Table 33: Malaysia Clove Industry Revenue (Million) Forecast, by Application 2020 & 2033
- Table 34: Sri Lanka Clove Industry Revenue (Million) Forecast, by Application 2020 & 2033
- Table 35: Vietnam Clove Industry Revenue (Million) Forecast, by Application 2020 & 2033
- Table 36: Global Clove Industry Revenue Million Forecast, by Production Analysis 2020 & 2033
- Table 37: Global Clove Industry Revenue Million Forecast, by Consumption Analysis 2020 & 2033
- Table 38: Global Clove Industry Revenue Million Forecast, by Import Market Analysis (Value & Volume) 2020 & 2033
- Table 39: Global Clove Industry Revenue Million Forecast, by Export Market Analysis (Value & Volume) 2020 & 2033
- Table 40: Global Clove Industry Revenue Million Forecast, by Price Trend Analysis 2020 & 2033
- Table 41: Global Clove Industry Revenue Million Forecast, by Country 2020 & 2033
- Table 42: Global Clove Industry Revenue Million Forecast, by Production Analysis 2020 & 2033
- Table 43: Global Clove Industry Revenue Million Forecast, by Consumption Analysis 2020 & 2033
- Table 44: Global Clove Industry Revenue Million Forecast, by Import Market Analysis (Value & Volume) 2020 & 2033
- Table 45: Global Clove Industry Revenue Million Forecast, by Export Market Analysis (Value & Volume) 2020 & 2033
- Table 46: Global Clove Industry Revenue Million Forecast, by Price Trend Analysis 2020 & 2033
- Table 47: Global Clove Industry Revenue Million Forecast, by Country 2020 & 2033
- Table 48: Kingdom of Saudi Arabia Clove Industry Revenue (Million) Forecast, by Application 2020 & 2033
- Table 49: United Arab Emirates Clove Industry Revenue (Million) Forecast, by Application 2020 & 2033
- Table 50: Kenya Clove Industry Revenue (Million) Forecast, by Application 2020 & 2033
- Table 51: Comoros Clove Industry Revenue (Million) Forecast, by Application 2020 & 2033
- Table 52: Tanzania Clove Industry Revenue (Million) Forecast, by Application 2020 & 2033
Frequently Asked Questions
1. What is the projected Compound Annual Growth Rate (CAGR) of the Clove Industry?
The projected CAGR is approximately 3.70%.
2. Which companies are prominent players in the Clove Industry?
Key companies in the market include PT Sartika Clove Trading , Tanjung Sari Clove Trading , PT Indoceylon Clove , PT Maju Clove Trading , PT Clove Nusantara.
3. What are the main segments of the Clove Industry?
The market segments include Production Analysis, Consumption Analysis, Import Market Analysis (Value & Volume), Export Market Analysis (Value & Volume), Price Trend Analysis.
4. Can you provide details about the market size?
The market size is estimated to be USD 5.80 Million as of 2022.
5. What are some drivers contributing to market growth?
Increasing Demand for Garlic Due to Various Uses in Industries; Rising Demad of Organic Garlic; Increasing Government Initiatives.
6. What are the notable trends driving market growth?
Increased Demand from Various Industries is Aiding the Production.
7. Are there any restraints impacting market growth?
Lack of Technical Knowledge of Farmers; Price Fluctuations.
8. Can you provide examples of recent developments in the market?
N/A
9. What pricing options are available for accessing the report?
Pricing options include single-user, multi-user, and enterprise licenses priced at USD 4750, USD 5250, and USD 8750 respectively.
10. Is the market size provided in terms of value or volume?
The market size is provided in terms of value, measured in Million.
11. Are there any specific market keywords associated with the report?
Yes, the market keyword associated with the report is "Clove Industry," which aids in identifying and referencing the specific market segment covered.
12. How do I determine which pricing option suits my needs best?
The pricing options vary based on user requirements and access needs. Individual users may opt for single-user licenses, while businesses requiring broader access may choose multi-user or enterprise licenses for cost-effective access to the report.
13. Are there any additional resources or data provided in the Clove Industry report?
While the report offers comprehensive insights, it's advisable to review the specific contents or supplementary materials provided to ascertain if additional resources or data are available.
14. How can I stay updated on further developments or reports in the Clove Industry?
To stay informed about further developments, trends, and reports in the Clove Industry, consider subscribing to industry newsletters, following relevant companies and organizations, or regularly checking reputable industry news sources and publications.
Methodology
Step 1 - Identification of Relevant Samples Size from Population Database


Step 2 - Approaches for Defining Global Market Size (Value, Volume* & Price*)

Note*: In applicable scenarios
Step 3 - Data Sources
Primary Research
- Web Analytics
- Survey Reports
- Research Institute
- Latest Research Reports
- Opinion Leaders
Secondary Research
- Annual Reports
- White Paper
- Latest Press Release
- Industry Association
- Paid Database
- Investor Presentations

Step 4 - Data Triangulation
Involves using different sources of information in order to increase the validity of a study
These sources are likely to be stakeholders in a program - participants, other researchers, program staff, other community members, and so on.
Then we put all data in single framework & apply various statistical tools to find out the dynamic on the market.
During the analysis stage, feedback from the stakeholder groups would be compared to determine areas of agreement as well as areas of divergence