

Key Insights
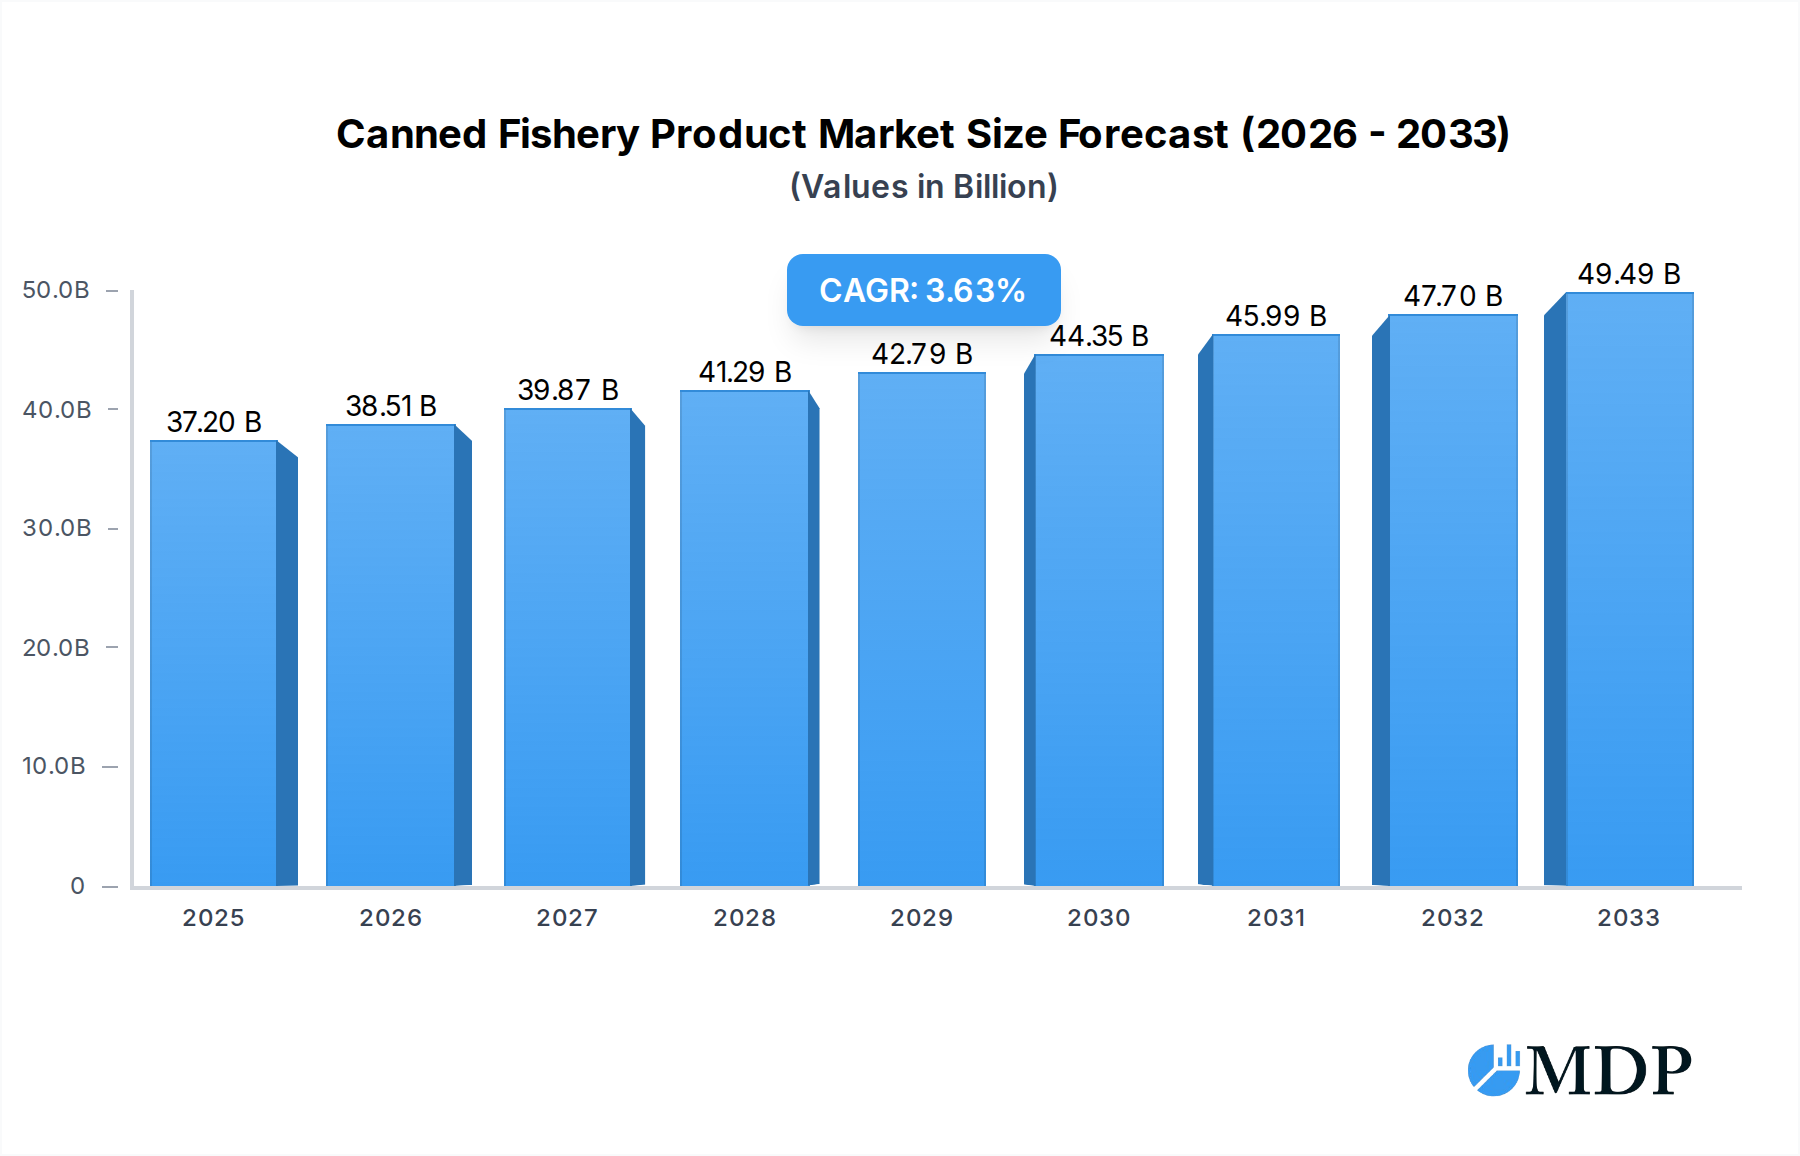
The global canned fishery product market is poised for steady expansion, with a projected market size of $37.2 billion in 2025. This growth is underpinned by a compound annual growth rate (CAGR) of 3.5%, indicating a robust and sustained upward trajectory throughout the forecast period of 2025-2033. This expansion is primarily driven by increasing consumer demand for convenient, protein-rich food options, especially in emerging economies. The accessibility and long shelf-life of canned fish make it an attractive choice for busy households and for stocking pantries. Furthermore, a growing awareness of the health benefits associated with consuming fish, such as omega-3 fatty acid intake, is also contributing to market buoyancy. The market is being shaped by evolving consumer preferences towards more sustainable and ethically sourced seafood, prompting manufacturers to highlight their sourcing practices.

Canned Fishery Product Market Size (In Billion)
The market is segmented into key product types, including canned tuna, canned sardines, and canned mackerel, with canned tuna often leading in volume due to its widespread popularity and versatility. Applications span across various retail channels, with supermarkets and hypermarkets forming a significant distribution base, complemented by the growing influence of online retailers offering wider selection and convenience. Convenience stores also play a crucial role in providing on-the-go options. Geographically, the Asia Pacific region is expected to be a major contributor to market growth, fueled by a large population and rising disposable incomes. North America and Europe, while mature markets, continue to exhibit consistent demand, driven by established consumer habits and a focus on healthy eating. Challenges such as fluctuating raw material prices and concerns regarding overfishing could present some headwinds, but innovation in product development and sustainable practices are expected to mitigate these restraints.
Canned Fishery Product Company Market Share
This report provides an in-depth analysis of the global canned fishery product market, offering critical insights for industry stakeholders, investors, and decision-makers. Examining historical data from 2019 to 2024 and projecting future trends up to 2033, this study delves into market dynamics, leading players, technological advancements, and emerging opportunities. With a base year of 2025 and a forecast period from 2025 to 2033, this report is an essential resource for understanding the evolving landscape of the canned seafood industry. The market is projected to reach a valuation of over $XX billion by 2033, demonstrating robust growth.
Canned Fishery Product Market Dynamics & Concentration
The global canned fishery product market exhibits a moderate to high concentration, with key players like Ayam Sarl, Kumpulan Cap Keluarga, Marina (FFM BERHAD), Adabi Consumer Industries, Pertima Trengganu Sdn Bhd, KING CUP (MCM), and PROTIGAM holding significant market share. Innovation drivers such as the development of premium and value-added canned fish products, including those with diverse flavor profiles and healthier formulations (e.g., omega-3 enriched), are propelling market growth. Regulatory frameworks, particularly those concerning food safety standards, sustainable sourcing, and labeling requirements, play a crucial role in shaping market entry and product development. The increasing availability of plant-based alternatives and fresh/frozen seafood presents product substitution challenges, necessitating a focus on convenience, shelf-life, and affordability. End-user trends are leaning towards demand for convenient, ready-to-eat meals and an increasing awareness of the nutritional benefits of fish. Mergers and acquisitions (M&A) activities are observed, with approximately XX deals recorded within the historical period, indicating strategic consolidation and expansion efforts by leading companies to enhance their product portfolios and market reach. The total market value in the base year 2025 is estimated to be around $XX billion.
Canned Fishery Product Industry Trends & Analysis
The canned fishery product industry is experiencing robust growth, driven by several key factors. A significant market growth driver is the increasing global demand for affordable and convenient protein sources, particularly in developing economies. Consumers are increasingly seeking ready-to-eat meal solutions that offer nutritional benefits and long shelf life, making canned fish an attractive option. Technological disruptions are playing a vital role, with advancements in canning processes ensuring enhanced product quality, safety, and extended shelf life. Innovations in packaging, such as easy-open lids and microwaveable containers, are further enhancing consumer convenience. Consumer preferences are evolving, with a rising demand for sustainably sourced and ethically produced seafood. This trend is pushing manufacturers to adopt responsible fishing practices and transparent sourcing. The market penetration of canned fishery products remains high, particularly in regions with established retail infrastructure. However, the competitive dynamics are intensifying, with both established brands and emerging players vying for market share. The compound annual growth rate (CAGR) for the forecast period is estimated to be around XX%. The total market value in the estimated year 2025 is approximately $XX billion.
Leading Markets & Segments in Canned Fishery Product
The canned fishery product market is dominated by certain regions and segments, reflecting diverse consumer behaviors and economic conditions.
Dominant Application Segment:
- Supermarkets/Hypermarkets: This remains the primary distribution channel due to their extensive reach, product variety, and promotional activities. Their ability to cater to a broad customer base and offer competitive pricing makes them crucial for market penetration. Economic policies that support large-scale retail operations and robust supply chain infrastructure further bolster their dominance. The sales volume through this channel is projected to exceed $XX billion annually by 2025.
- Online Retailers: Experiencing rapid growth, online retailers are becoming increasingly important, especially in urban areas. Factors contributing to their rise include convenience, wider selection, and targeted marketing. The expansion of e-commerce infrastructure and digital payment systems are key drivers. This segment is expected to contribute over $XX billion to the market by 2025.
- Convenience Stores: These outlets cater to impulse purchases and immediate consumption needs, making them significant for smaller pack sizes and snack-oriented canned fish products.
- Others: This includes traditional markets, specialized food stores, and institutional sales, which collectively hold a smaller but consistent share.
Dominant Type Segment:
- Canned Tuna: This segment leads the market due to its versatility, widespread consumer acceptance, and rich nutritional profile. Its application in salads, sandwiches, and as a main course contributes to its high demand. Favorable economic policies promoting seafood consumption and robust supply chains for tuna fishing are key drivers. The global demand for canned tuna is projected to reach over $XX billion by 2025.
- Canned Sardines: Known for their affordability and high calcium and omega-3 content, sardines are a staple in many households, especially in cost-conscious markets. Regulatory support for promoting healthy diets further boosts this segment.
- Canned Mackerel: While having a smaller market share than tuna or sardines, canned mackerel is gaining traction due to its nutritional benefits and potential for innovation in flavor profiles.
Canned Fishery Product Product Developments
Product innovation in the canned fishery sector is characterized by a focus on enhanced nutritional value, convenience, and diverse flavor profiles. Manufacturers are developing value-added products such as tuna chunks in olive oil, sardines with chili, and mackerel in various sauces, catering to evolving consumer tastes. The integration of sustainable sourcing certifications and clean-label formulations provides a competitive advantage. Technological advancements in processing and packaging are enabling the creation of ready-to-eat meals and single-serving options, aligning with modern lifestyles and market fit.
Key Drivers of Canned Fishery Product Growth
Several factors are propelling the growth of the canned fishery product market. The increasing global population and rising disposable incomes, particularly in emerging economies, are creating a larger consumer base for affordable protein. Furthermore, growing health consciousness among consumers is driving demand for nutrient-rich foods like canned fish, which are excellent sources of omega-3 fatty acids and protein. Technological advancements in preservation and packaging techniques ensure extended shelf life and improved product quality, further enhancing consumer appeal. Favorable government policies promoting seafood consumption and investment in sustainable aquaculture also contribute significantly to market expansion.
Challenges in the Canned Fishery Product Market
Despite the positive growth trajectory, the canned fishery product market faces several challenges. Fluctuations in the availability and price of raw fish due to environmental factors and overfishing can impact supply chain stability and production costs. Stringent regulatory requirements for food safety and labeling, while essential, can increase compliance burdens for manufacturers. Intense competition from fresh and frozen seafood alternatives, as well as growing consumer preference for plant-based proteins, presents a significant challenge. Moreover, negative perceptions regarding the quality and processing of some canned fish products can hinder market growth in certain segments.
Emerging Opportunities in Canned Fishery Product
The canned fishery product market is poised for significant growth fueled by emerging opportunities. The increasing demand for sustainable and ethically sourced seafood presents a major opportunity for companies that can demonstrate transparent and responsible fishing practices. Technological advancements in processing, such as retort pouch technology, offer potential for more convenient and innovative packaging formats. Expanding into untapped emerging markets with growing middle classes and increasing demand for convenient food options can unlock substantial growth. Furthermore, product diversification into gourmet and specialty canned fish with unique flavor profiles and premium ingredients can attract a higher-spending consumer segment.
Leading Players in the Canned Fishery Product Sector
- Ayam Sarl
- Kumpulan Cap Keluarga
- Marina (FFM BERHAD)
- Adabi Consumer Industries
- Pertima Trengganu Sdn Bhd
- KING CUP (MCM)
- PROTIGAM
Key Milestones in Canned Fishery Product Industry
- 2019: Increased adoption of sustainable fishing certifications by major manufacturers.
- 2020: Introduction of innovative flavor variants for canned tuna and sardines in response to evolving consumer preferences.
- 2021: Significant investment in R&D for enhanced canning technologies to improve shelf life and nutrient retention.
- 2022: Rise in e-commerce sales of canned fishery products, driven by increased online shopping habits.
- 2023: Growing emphasis on clean-label products with reduced additives and preservatives.
- 2024: Strategic partnerships formed for exploring new global markets and expanding distribution networks.
- 2025: Projected market valuation of $XX billion, with continued growth anticipated.
- 2026-2033: Forecasted steady growth driven by demand for convenience and nutritional benefits.
Strategic Outlook for Canned Fishery Product Market
The strategic outlook for the canned fishery product market is characterized by continued growth and adaptation. Key growth accelerators include the increasing demand for convenient, shelf-stable protein sources and the rising consumer focus on health and nutrition. Companies that invest in sustainable sourcing, innovative product development (e.g., plant-based alternatives, value-added products), and efficient supply chain management will be well-positioned for success. Expanding into emerging markets and leveraging e-commerce channels are crucial strategies. Furthermore, strategic collaborations and potential M&A activities will likely continue to shape the competitive landscape, driving consolidation and market expansion.
Canned Fishery Product Segmentation
-
1. Application
- 1.1. Supermarkets/ Hypermarkets
- 1.2. Convenience Stores
- 1.3. Online Retailers
- 1.4. Others
-
2. Type
- 2.1. Canned Sardines
- 2.2. Canned Tuna
- 2.3. Canned Mackerel
Canned Fishery Product Segmentation By Geography
-
1. North America
- 1.1. United States
- 1.2. Canada
- 1.3. Mexico
-
2. South America
- 2.1. Brazil
- 2.2. Argentina
- 2.3. Rest of South America
-
3. Europe
- 3.1. United Kingdom
- 3.2. Germany
- 3.3. France
- 3.4. Italy
- 3.5. Spain
- 3.6. Russia
- 3.7. Benelux
- 3.8. Nordics
- 3.9. Rest of Europe
-
4. Middle East & Africa
- 4.1. Turkey
- 4.2. Israel
- 4.3. GCC
- 4.4. North Africa
- 4.5. South Africa
- 4.6. Rest of Middle East & Africa
-
5. Asia Pacific
- 5.1. China
- 5.2. India
- 5.3. Japan
- 5.4. South Korea
- 5.5. ASEAN
- 5.6. Oceania
- 5.7. Rest of Asia Pacific
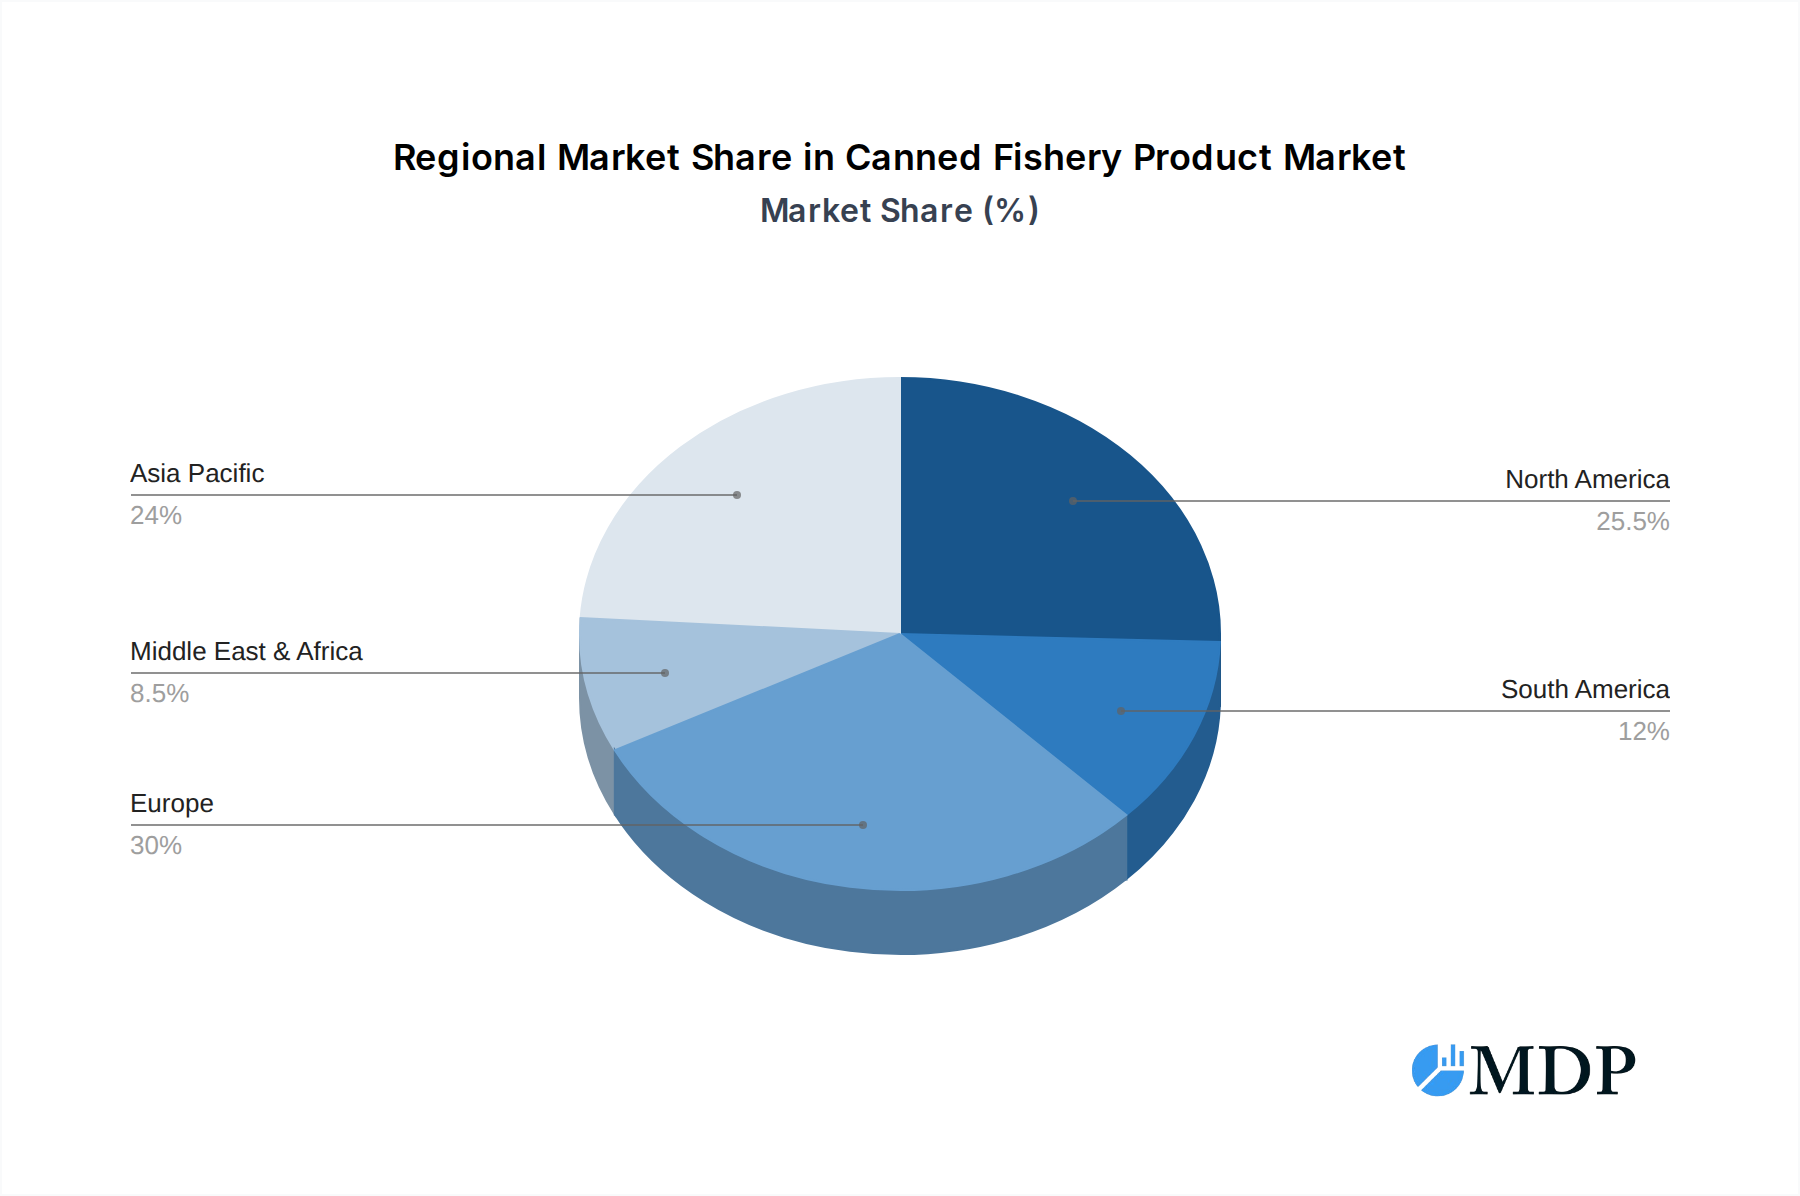
Canned Fishery Product Regional Market Share
Geographic Coverage of Canned Fishery Product
Canned Fishery Product REPORT HIGHLIGHTS
| Aspects | Details |
|---|---|
| Study Period | 2020-2034 |
| Base Year | 2025 |
| Estimated Year | 2026 |
| Forecast Period | 2026-2034 |
| Historical Period | 2020-2025 |
| Growth Rate | CAGR of 5% from 2020-2034 |
| Segmentation |
|
Table of Contents
- 1. Introduction
- 1.1. Research Scope
- 1.2. Market Segmentation
- 1.3. Research Methodology
- 1.4. Definitions and Assumptions
- 2. Executive Summary
- 2.1. Introduction
- 3. Market Dynamics
- 3.1. Introduction
- 3.2. Market Drivers
- 3.3. Market Restrains
- 3.4. Market Trends
- 4. Market Factor Analysis
- 4.1. Porters Five Forces
- 4.2. Supply/Value Chain
- 4.3. PESTEL analysis
- 4.4. Market Entropy
- 4.5. Patent/Trademark Analysis
- 5. Global Canned Fishery Product Analysis, Insights and Forecast, 2020-2032
- 5.1. Market Analysis, Insights and Forecast - by Application
- 5.1.1. Supermarkets/ Hypermarkets
- 5.1.2. Convenience Stores
- 5.1.3. Online Retailers
- 5.1.4. Others
- 5.2. Market Analysis, Insights and Forecast - by Type
- 5.2.1. Canned Sardines
- 5.2.2. Canned Tuna
- 5.2.3. Canned Mackerel
- 5.3. Market Analysis, Insights and Forecast - by Region
- 5.3.1. North America
- 5.3.2. South America
- 5.3.3. Europe
- 5.3.4. Middle East & Africa
- 5.3.5. Asia Pacific
- 5.1. Market Analysis, Insights and Forecast - by Application
- 6. North America Canned Fishery Product Analysis, Insights and Forecast, 2020-2032
- 6.1. Market Analysis, Insights and Forecast - by Application
- 6.1.1. Supermarkets/ Hypermarkets
- 6.1.2. Convenience Stores
- 6.1.3. Online Retailers
- 6.1.4. Others
- 6.2. Market Analysis, Insights and Forecast - by Type
- 6.2.1. Canned Sardines
- 6.2.2. Canned Tuna
- 6.2.3. Canned Mackerel
- 6.1. Market Analysis, Insights and Forecast - by Application
- 7. South America Canned Fishery Product Analysis, Insights and Forecast, 2020-2032
- 7.1. Market Analysis, Insights and Forecast - by Application
- 7.1.1. Supermarkets/ Hypermarkets
- 7.1.2. Convenience Stores
- 7.1.3. Online Retailers
- 7.1.4. Others
- 7.2. Market Analysis, Insights and Forecast - by Type
- 7.2.1. Canned Sardines
- 7.2.2. Canned Tuna
- 7.2.3. Canned Mackerel
- 7.1. Market Analysis, Insights and Forecast - by Application
- 8. Europe Canned Fishery Product Analysis, Insights and Forecast, 2020-2032
- 8.1. Market Analysis, Insights and Forecast - by Application
- 8.1.1. Supermarkets/ Hypermarkets
- 8.1.2. Convenience Stores
- 8.1.3. Online Retailers
- 8.1.4. Others
- 8.2. Market Analysis, Insights and Forecast - by Type
- 8.2.1. Canned Sardines
- 8.2.2. Canned Tuna
- 8.2.3. Canned Mackerel
- 8.1. Market Analysis, Insights and Forecast - by Application
- 9. Middle East & Africa Canned Fishery Product Analysis, Insights and Forecast, 2020-2032
- 9.1. Market Analysis, Insights and Forecast - by Application
- 9.1.1. Supermarkets/ Hypermarkets
- 9.1.2. Convenience Stores
- 9.1.3. Online Retailers
- 9.1.4. Others
- 9.2. Market Analysis, Insights and Forecast - by Type
- 9.2.1. Canned Sardines
- 9.2.2. Canned Tuna
- 9.2.3. Canned Mackerel
- 9.1. Market Analysis, Insights and Forecast - by Application
- 10. Asia Pacific Canned Fishery Product Analysis, Insights and Forecast, 2020-2032
- 10.1. Market Analysis, Insights and Forecast - by Application
- 10.1.1. Supermarkets/ Hypermarkets
- 10.1.2. Convenience Stores
- 10.1.3. Online Retailers
- 10.1.4. Others
- 10.2. Market Analysis, Insights and Forecast - by Type
- 10.2.1. Canned Sardines
- 10.2.2. Canned Tuna
- 10.2.3. Canned Mackerel
- 10.1. Market Analysis, Insights and Forecast - by Application
- 11. Competitive Analysis
- 11.1. Global Market Share Analysis 2025
- 11.2. Company Profiles
- 11.2.1 Ayam Sarl
- 11.2.1.1. Overview
- 11.2.1.2. Products
- 11.2.1.3. SWOT Analysis
- 11.2.1.4. Recent Developments
- 11.2.1.5. Financials (Based on Availability)
- 11.2.2 Kumpulan Cap Keluarga
- 11.2.2.1. Overview
- 11.2.2.2. Products
- 11.2.2.3. SWOT Analysis
- 11.2.2.4. Recent Developments
- 11.2.2.5. Financials (Based on Availability)
- 11.2.3 Marina (FFM BERHAD)
- 11.2.3.1. Overview
- 11.2.3.2. Products
- 11.2.3.3. SWOT Analysis
- 11.2.3.4. Recent Developments
- 11.2.3.5. Financials (Based on Availability)
- 11.2.4 Adabi Consumer Industries
- 11.2.4.1. Overview
- 11.2.4.2. Products
- 11.2.4.3. SWOT Analysis
- 11.2.4.4. Recent Developments
- 11.2.4.5. Financials (Based on Availability)
- 11.2.5 Pertima Trengganu Sdn Bhd
- 11.2.5.1. Overview
- 11.2.5.2. Products
- 11.2.5.3. SWOT Analysis
- 11.2.5.4. Recent Developments
- 11.2.5.5. Financials (Based on Availability)
- 11.2.6 KING CUP (MCM)
- 11.2.6.1. Overview
- 11.2.6.2. Products
- 11.2.6.3. SWOT Analysis
- 11.2.6.4. Recent Developments
- 11.2.6.5. Financials (Based on Availability)
- 11.2.7 PROTIGAM
- 11.2.7.1. Overview
- 11.2.7.2. Products
- 11.2.7.3. SWOT Analysis
- 11.2.7.4. Recent Developments
- 11.2.7.5. Financials (Based on Availability)
- 11.2.1 Ayam Sarl
List of Figures
- Figure 1: Global Canned Fishery Product Revenue Breakdown (undefined, %) by Region 2025 & 2033
- Figure 2: Global Canned Fishery Product Volume Breakdown (K, %) by Region 2025 & 2033
- Figure 3: North America Canned Fishery Product Revenue (undefined), by Application 2025 & 2033
- Figure 4: North America Canned Fishery Product Volume (K), by Application 2025 & 2033
- Figure 5: North America Canned Fishery Product Revenue Share (%), by Application 2025 & 2033
- Figure 6: North America Canned Fishery Product Volume Share (%), by Application 2025 & 2033
- Figure 7: North America Canned Fishery Product Revenue (undefined), by Type 2025 & 2033
- Figure 8: North America Canned Fishery Product Volume (K), by Type 2025 & 2033
- Figure 9: North America Canned Fishery Product Revenue Share (%), by Type 2025 & 2033
- Figure 10: North America Canned Fishery Product Volume Share (%), by Type 2025 & 2033
- Figure 11: North America Canned Fishery Product Revenue (undefined), by Country 2025 & 2033
- Figure 12: North America Canned Fishery Product Volume (K), by Country 2025 & 2033
- Figure 13: North America Canned Fishery Product Revenue Share (%), by Country 2025 & 2033
- Figure 14: North America Canned Fishery Product Volume Share (%), by Country 2025 & 2033
- Figure 15: South America Canned Fishery Product Revenue (undefined), by Application 2025 & 2033
- Figure 16: South America Canned Fishery Product Volume (K), by Application 2025 & 2033
- Figure 17: South America Canned Fishery Product Revenue Share (%), by Application 2025 & 2033
- Figure 18: South America Canned Fishery Product Volume Share (%), by Application 2025 & 2033
- Figure 19: South America Canned Fishery Product Revenue (undefined), by Type 2025 & 2033
- Figure 20: South America Canned Fishery Product Volume (K), by Type 2025 & 2033
- Figure 21: South America Canned Fishery Product Revenue Share (%), by Type 2025 & 2033
- Figure 22: South America Canned Fishery Product Volume Share (%), by Type 2025 & 2033
- Figure 23: South America Canned Fishery Product Revenue (undefined), by Country 2025 & 2033
- Figure 24: South America Canned Fishery Product Volume (K), by Country 2025 & 2033
- Figure 25: South America Canned Fishery Product Revenue Share (%), by Country 2025 & 2033
- Figure 26: South America Canned Fishery Product Volume Share (%), by Country 2025 & 2033
- Figure 27: Europe Canned Fishery Product Revenue (undefined), by Application 2025 & 2033
- Figure 28: Europe Canned Fishery Product Volume (K), by Application 2025 & 2033
- Figure 29: Europe Canned Fishery Product Revenue Share (%), by Application 2025 & 2033
- Figure 30: Europe Canned Fishery Product Volume Share (%), by Application 2025 & 2033
- Figure 31: Europe Canned Fishery Product Revenue (undefined), by Type 2025 & 2033
- Figure 32: Europe Canned Fishery Product Volume (K), by Type 2025 & 2033
- Figure 33: Europe Canned Fishery Product Revenue Share (%), by Type 2025 & 2033
- Figure 34: Europe Canned Fishery Product Volume Share (%), by Type 2025 & 2033
- Figure 35: Europe Canned Fishery Product Revenue (undefined), by Country 2025 & 2033
- Figure 36: Europe Canned Fishery Product Volume (K), by Country 2025 & 2033
- Figure 37: Europe Canned Fishery Product Revenue Share (%), by Country 2025 & 2033
- Figure 38: Europe Canned Fishery Product Volume Share (%), by Country 2025 & 2033
- Figure 39: Middle East & Africa Canned Fishery Product Revenue (undefined), by Application 2025 & 2033
- Figure 40: Middle East & Africa Canned Fishery Product Volume (K), by Application 2025 & 2033
- Figure 41: Middle East & Africa Canned Fishery Product Revenue Share (%), by Application 2025 & 2033
- Figure 42: Middle East & Africa Canned Fishery Product Volume Share (%), by Application 2025 & 2033
- Figure 43: Middle East & Africa Canned Fishery Product Revenue (undefined), by Type 2025 & 2033
- Figure 44: Middle East & Africa Canned Fishery Product Volume (K), by Type 2025 & 2033
- Figure 45: Middle East & Africa Canned Fishery Product Revenue Share (%), by Type 2025 & 2033
- Figure 46: Middle East & Africa Canned Fishery Product Volume Share (%), by Type 2025 & 2033
- Figure 47: Middle East & Africa Canned Fishery Product Revenue (undefined), by Country 2025 & 2033
- Figure 48: Middle East & Africa Canned Fishery Product Volume (K), by Country 2025 & 2033
- Figure 49: Middle East & Africa Canned Fishery Product Revenue Share (%), by Country 2025 & 2033
- Figure 50: Middle East & Africa Canned Fishery Product Volume Share (%), by Country 2025 & 2033
- Figure 51: Asia Pacific Canned Fishery Product Revenue (undefined), by Application 2025 & 2033
- Figure 52: Asia Pacific Canned Fishery Product Volume (K), by Application 2025 & 2033
- Figure 53: Asia Pacific Canned Fishery Product Revenue Share (%), by Application 2025 & 2033
- Figure 54: Asia Pacific Canned Fishery Product Volume Share (%), by Application 2025 & 2033
- Figure 55: Asia Pacific Canned Fishery Product Revenue (undefined), by Type 2025 & 2033
- Figure 56: Asia Pacific Canned Fishery Product Volume (K), by Type 2025 & 2033
- Figure 57: Asia Pacific Canned Fishery Product Revenue Share (%), by Type 2025 & 2033
- Figure 58: Asia Pacific Canned Fishery Product Volume Share (%), by Type 2025 & 2033
- Figure 59: Asia Pacific Canned Fishery Product Revenue (undefined), by Country 2025 & 2033
- Figure 60: Asia Pacific Canned Fishery Product Volume (K), by Country 2025 & 2033
- Figure 61: Asia Pacific Canned Fishery Product Revenue Share (%), by Country 2025 & 2033
- Figure 62: Asia Pacific Canned Fishery Product Volume Share (%), by Country 2025 & 2033
List of Tables
- Table 1: Global Canned Fishery Product Revenue undefined Forecast, by Application 2020 & 2033
- Table 2: Global Canned Fishery Product Volume K Forecast, by Application 2020 & 2033
- Table 3: Global Canned Fishery Product Revenue undefined Forecast, by Type 2020 & 2033
- Table 4: Global Canned Fishery Product Volume K Forecast, by Type 2020 & 2033
- Table 5: Global Canned Fishery Product Revenue undefined Forecast, by Region 2020 & 2033
- Table 6: Global Canned Fishery Product Volume K Forecast, by Region 2020 & 2033
- Table 7: Global Canned Fishery Product Revenue undefined Forecast, by Application 2020 & 2033
- Table 8: Global Canned Fishery Product Volume K Forecast, by Application 2020 & 2033
- Table 9: Global Canned Fishery Product Revenue undefined Forecast, by Type 2020 & 2033
- Table 10: Global Canned Fishery Product Volume K Forecast, by Type 2020 & 2033
- Table 11: Global Canned Fishery Product Revenue undefined Forecast, by Country 2020 & 2033
- Table 12: Global Canned Fishery Product Volume K Forecast, by Country 2020 & 2033
- Table 13: United States Canned Fishery Product Revenue (undefined) Forecast, by Application 2020 & 2033
- Table 14: United States Canned Fishery Product Volume (K) Forecast, by Application 2020 & 2033
- Table 15: Canada Canned Fishery Product Revenue (undefined) Forecast, by Application 2020 & 2033
- Table 16: Canada Canned Fishery Product Volume (K) Forecast, by Application 2020 & 2033
- Table 17: Mexico Canned Fishery Product Revenue (undefined) Forecast, by Application 2020 & 2033
- Table 18: Mexico Canned Fishery Product Volume (K) Forecast, by Application 2020 & 2033
- Table 19: Global Canned Fishery Product Revenue undefined Forecast, by Application 2020 & 2033
- Table 20: Global Canned Fishery Product Volume K Forecast, by Application 2020 & 2033
- Table 21: Global Canned Fishery Product Revenue undefined Forecast, by Type 2020 & 2033
- Table 22: Global Canned Fishery Product Volume K Forecast, by Type 2020 & 2033
- Table 23: Global Canned Fishery Product Revenue undefined Forecast, by Country 2020 & 2033
- Table 24: Global Canned Fishery Product Volume K Forecast, by Country 2020 & 2033
- Table 25: Brazil Canned Fishery Product Revenue (undefined) Forecast, by Application 2020 & 2033
- Table 26: Brazil Canned Fishery Product Volume (K) Forecast, by Application 2020 & 2033
- Table 27: Argentina Canned Fishery Product Revenue (undefined) Forecast, by Application 2020 & 2033
- Table 28: Argentina Canned Fishery Product Volume (K) Forecast, by Application 2020 & 2033
- Table 29: Rest of South America Canned Fishery Product Revenue (undefined) Forecast, by Application 2020 & 2033
- Table 30: Rest of South America Canned Fishery Product Volume (K) Forecast, by Application 2020 & 2033
- Table 31: Global Canned Fishery Product Revenue undefined Forecast, by Application 2020 & 2033
- Table 32: Global Canned Fishery Product Volume K Forecast, by Application 2020 & 2033
- Table 33: Global Canned Fishery Product Revenue undefined Forecast, by Type 2020 & 2033
- Table 34: Global Canned Fishery Product Volume K Forecast, by Type 2020 & 2033
- Table 35: Global Canned Fishery Product Revenue undefined Forecast, by Country 2020 & 2033
- Table 36: Global Canned Fishery Product Volume K Forecast, by Country 2020 & 2033
- Table 37: United Kingdom Canned Fishery Product Revenue (undefined) Forecast, by Application 2020 & 2033
- Table 38: United Kingdom Canned Fishery Product Volume (K) Forecast, by Application 2020 & 2033
- Table 39: Germany Canned Fishery Product Revenue (undefined) Forecast, by Application 2020 & 2033
- Table 40: Germany Canned Fishery Product Volume (K) Forecast, by Application 2020 & 2033
- Table 41: France Canned Fishery Product Revenue (undefined) Forecast, by Application 2020 & 2033
- Table 42: France Canned Fishery Product Volume (K) Forecast, by Application 2020 & 2033
- Table 43: Italy Canned Fishery Product Revenue (undefined) Forecast, by Application 2020 & 2033
- Table 44: Italy Canned Fishery Product Volume (K) Forecast, by Application 2020 & 2033
- Table 45: Spain Canned Fishery Product Revenue (undefined) Forecast, by Application 2020 & 2033
- Table 46: Spain Canned Fishery Product Volume (K) Forecast, by Application 2020 & 2033
- Table 47: Russia Canned Fishery Product Revenue (undefined) Forecast, by Application 2020 & 2033
- Table 48: Russia Canned Fishery Product Volume (K) Forecast, by Application 2020 & 2033
- Table 49: Benelux Canned Fishery Product Revenue (undefined) Forecast, by Application 2020 & 2033
- Table 50: Benelux Canned Fishery Product Volume (K) Forecast, by Application 2020 & 2033
- Table 51: Nordics Canned Fishery Product Revenue (undefined) Forecast, by Application 2020 & 2033
- Table 52: Nordics Canned Fishery Product Volume (K) Forecast, by Application 2020 & 2033
- Table 53: Rest of Europe Canned Fishery Product Revenue (undefined) Forecast, by Application 2020 & 2033
- Table 54: Rest of Europe Canned Fishery Product Volume (K) Forecast, by Application 2020 & 2033
- Table 55: Global Canned Fishery Product Revenue undefined Forecast, by Application 2020 & 2033
- Table 56: Global Canned Fishery Product Volume K Forecast, by Application 2020 & 2033
- Table 57: Global Canned Fishery Product Revenue undefined Forecast, by Type 2020 & 2033
- Table 58: Global Canned Fishery Product Volume K Forecast, by Type 2020 & 2033
- Table 59: Global Canned Fishery Product Revenue undefined Forecast, by Country 2020 & 2033
- Table 60: Global Canned Fishery Product Volume K Forecast, by Country 2020 & 2033
- Table 61: Turkey Canned Fishery Product Revenue (undefined) Forecast, by Application 2020 & 2033
- Table 62: Turkey Canned Fishery Product Volume (K) Forecast, by Application 2020 & 2033
- Table 63: Israel Canned Fishery Product Revenue (undefined) Forecast, by Application 2020 & 2033
- Table 64: Israel Canned Fishery Product Volume (K) Forecast, by Application 2020 & 2033
- Table 65: GCC Canned Fishery Product Revenue (undefined) Forecast, by Application 2020 & 2033
- Table 66: GCC Canned Fishery Product Volume (K) Forecast, by Application 2020 & 2033
- Table 67: North Africa Canned Fishery Product Revenue (undefined) Forecast, by Application 2020 & 2033
- Table 68: North Africa Canned Fishery Product Volume (K) Forecast, by Application 2020 & 2033
- Table 69: South Africa Canned Fishery Product Revenue (undefined) Forecast, by Application 2020 & 2033
- Table 70: South Africa Canned Fishery Product Volume (K) Forecast, by Application 2020 & 2033
- Table 71: Rest of Middle East & Africa Canned Fishery Product Revenue (undefined) Forecast, by Application 2020 & 2033
- Table 72: Rest of Middle East & Africa Canned Fishery Product Volume (K) Forecast, by Application 2020 & 2033
- Table 73: Global Canned Fishery Product Revenue undefined Forecast, by Application 2020 & 2033
- Table 74: Global Canned Fishery Product Volume K Forecast, by Application 2020 & 2033
- Table 75: Global Canned Fishery Product Revenue undefined Forecast, by Type 2020 & 2033
- Table 76: Global Canned Fishery Product Volume K Forecast, by Type 2020 & 2033
- Table 77: Global Canned Fishery Product Revenue undefined Forecast, by Country 2020 & 2033
- Table 78: Global Canned Fishery Product Volume K Forecast, by Country 2020 & 2033
- Table 79: China Canned Fishery Product Revenue (undefined) Forecast, by Application 2020 & 2033
- Table 80: China Canned Fishery Product Volume (K) Forecast, by Application 2020 & 2033
- Table 81: India Canned Fishery Product Revenue (undefined) Forecast, by Application 2020 & 2033
- Table 82: India Canned Fishery Product Volume (K) Forecast, by Application 2020 & 2033
- Table 83: Japan Canned Fishery Product Revenue (undefined) Forecast, by Application 2020 & 2033
- Table 84: Japan Canned Fishery Product Volume (K) Forecast, by Application 2020 & 2033
- Table 85: South Korea Canned Fishery Product Revenue (undefined) Forecast, by Application 2020 & 2033
- Table 86: South Korea Canned Fishery Product Volume (K) Forecast, by Application 2020 & 2033
- Table 87: ASEAN Canned Fishery Product Revenue (undefined) Forecast, by Application 2020 & 2033
- Table 88: ASEAN Canned Fishery Product Volume (K) Forecast, by Application 2020 & 2033
- Table 89: Oceania Canned Fishery Product Revenue (undefined) Forecast, by Application 2020 & 2033
- Table 90: Oceania Canned Fishery Product Volume (K) Forecast, by Application 2020 & 2033
- Table 91: Rest of Asia Pacific Canned Fishery Product Revenue (undefined) Forecast, by Application 2020 & 2033
- Table 92: Rest of Asia Pacific Canned Fishery Product Volume (K) Forecast, by Application 2020 & 2033
Frequently Asked Questions
1. What is the projected Compound Annual Growth Rate (CAGR) of the Canned Fishery Product?
The projected CAGR is approximately 5%.
2. Which companies are prominent players in the Canned Fishery Product?
Key companies in the market include Ayam Sarl, Kumpulan Cap Keluarga, Marina (FFM BERHAD), Adabi Consumer Industries, Pertima Trengganu Sdn Bhd, KING CUP (MCM), PROTIGAM.
3. What are the main segments of the Canned Fishery Product?
The market segments include Application, Type.
4. Can you provide details about the market size?
The market size is estimated to be USD XXX N/A as of 2022.
5. What are some drivers contributing to market growth?
N/A
6. What are the notable trends driving market growth?
N/A
7. Are there any restraints impacting market growth?
N/A
8. Can you provide examples of recent developments in the market?
N/A
9. What pricing options are available for accessing the report?
Pricing options include single-user, multi-user, and enterprise licenses priced at USD 3950.00, USD 5925.00, and USD 7900.00 respectively.
10. Is the market size provided in terms of value or volume?
The market size is provided in terms of value, measured in N/A and volume, measured in K.
11. Are there any specific market keywords associated with the report?
Yes, the market keyword associated with the report is "Canned Fishery Product," which aids in identifying and referencing the specific market segment covered.
12. How do I determine which pricing option suits my needs best?
The pricing options vary based on user requirements and access needs. Individual users may opt for single-user licenses, while businesses requiring broader access may choose multi-user or enterprise licenses for cost-effective access to the report.
13. Are there any additional resources or data provided in the Canned Fishery Product report?
While the report offers comprehensive insights, it's advisable to review the specific contents or supplementary materials provided to ascertain if additional resources or data are available.
14. How can I stay updated on further developments or reports in the Canned Fishery Product?
To stay informed about further developments, trends, and reports in the Canned Fishery Product, consider subscribing to industry newsletters, following relevant companies and organizations, or regularly checking reputable industry news sources and publications.
Methodology
Step 1 - Identification of Relevant Samples Size from Population Database


Step 2 - Approaches for Defining Global Market Size (Value, Volume* & Price*)

Note*: In applicable scenarios
Step 3 - Data Sources
Primary Research
- Web Analytics
- Survey Reports
- Research Institute
- Latest Research Reports
- Opinion Leaders
Secondary Research
- Annual Reports
- White Paper
- Latest Press Release
- Industry Association
- Paid Database
- Investor Presentations

Step 4 - Data Triangulation
Involves using different sources of information in order to increase the validity of a study
These sources are likely to be stakeholders in a program - participants, other researchers, program staff, other community members, and so on.
Then we put all data in single framework & apply various statistical tools to find out the dynamic on the market.
During the analysis stage, feedback from the stakeholder groups would be compared to determine areas of agreement as well as areas of divergence