

Key Insights
The global Riboflavin Sodium Phosphate Injection market is poised for robust expansion, projected to reach USD 481.6 million by 2025, with a compelling Compound Annual Growth Rate (CAGR) of 6.65% during the forecast period of 2025-2033. This significant growth is fueled by an increasing prevalence of nutritional deficiencies and a rising demand for parenteral nutrition solutions, particularly in hospital settings. The rising awareness regarding the therapeutic benefits of riboflavin, a crucial B-vitamin involved in numerous metabolic processes, is a primary driver. Furthermore, advancements in pharmaceutical manufacturing and formulation technologies are enhancing the efficacy and accessibility of these injections, catering to a growing patient population requiring direct intravenous administration for rapid absorption and therapeutic impact. The market's trajectory is also being shaped by an expanding healthcare infrastructure, especially in emerging economies, where access to essential medicines is improving.
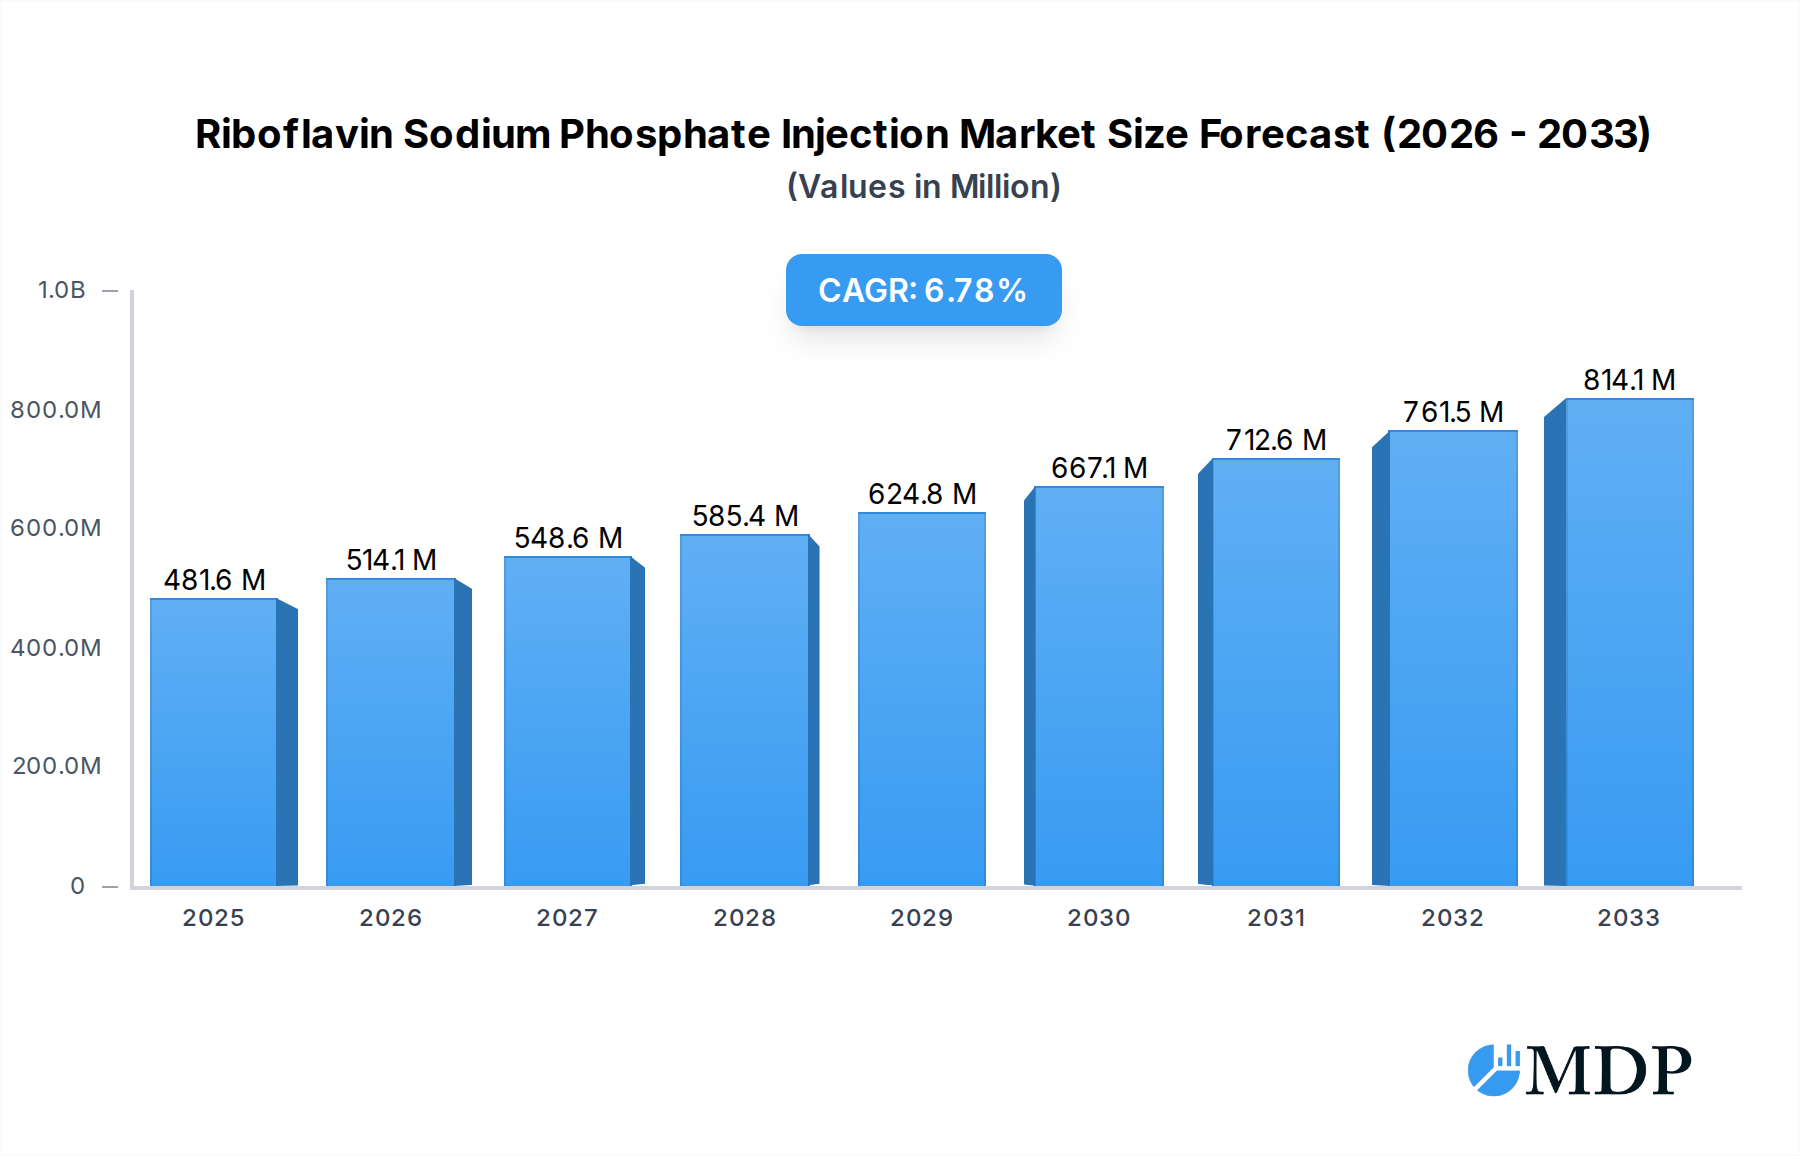
Riboflavin Sodium Phosphate Injection Market Size (In Million)
The Riboflavin Sodium Phosphate Injection market is characterized by dynamic trends and specific market segments that underscore its growth potential. The hospital segment is expected to dominate owing to its critical role in treating acute deficiencies and supporting critically ill patients. Within types, the 2ml:10mg and 5ml:15mg formulations are anticipated to witness higher demand due to their optimal dosing for various therapeutic interventions. While the market is generally optimistic, certain restraints, such as stringent regulatory hurdles for new product approvals and the potential for price sensitivity in some regions, need to be navigated. However, the overarching trend of increased healthcare expenditure and a growing focus on preventative and curative healthcare solutions globally are expected to outweigh these challenges, propelling sustained market growth. Key players are actively investing in research and development to introduce innovative formulations and expand their geographical reach.

Riboflavin Sodium Phosphate Injection Company Market Share
Riboflavin Sodium Phosphate Injection Market: Comprehensive Growth Analysis & Strategic Insights (2019-2033)
This in-depth report offers a detailed examination of the Riboflavin Sodium Phosphate Injection market, providing critical insights for industry stakeholders. Covering the historical period from 2019-2024, the base year of 2025, and a comprehensive forecast period through 2033, this analysis delves into market dynamics, emerging trends, leading segments, and the competitive landscape. With projected market sizes reaching hundreds of millions, this report is essential for understanding current opportunities and future growth trajectories within the pharmaceutical sector.
Riboflavin Sodium Phosphate Injection Market Dynamics & Concentration
The Riboflavin Sodium Phosphate Injection market is characterized by a moderate level of concentration, with key players like Taisheng Pharma, WZT, CR, Renhe Pharmaceuticals, Bristol-Myers Squibb, Teva, Adcock Ingram, Bahrain Pharma, Bal Pharma, Bimeda, Roche, Glaukos, Pfizer, and Sandoz holding significant market shares. Innovation drivers are primarily fueled by advancements in drug delivery systems and increased research into the therapeutic applications of riboflavin, particularly in ophthalmology and as a coenzyme in various metabolic processes. Regulatory frameworks, while stringent, are evolving to accommodate new product developments and therapeutic indications, creating a complex but navigable environment for manufacturers. Product substitutes, while present, often lack the targeted efficacy and specific formulation benefits of riboflavin sodium phosphate injections. End-user trends indicate a growing preference for targeted intravenous therapies and a rising demand in hospital settings due to its role in critical care and specific treatment protocols. Mergers and acquisitions (M&A) activities are moderate, with past deals valued in the tens of millions, often aimed at expanding product portfolios or gaining access to new geographical markets. The market share distribution among the leading players is estimated to be heavily skewed towards a few prominent companies, with the top five holding approximately 60% of the market. M&A deal counts have averaged around 3-5 significant transactions annually over the historical period.
Riboflavin Sodium Phosphate Injection Industry Trends & Analysis
The Riboflavin Sodium Phosphate Injection industry is experiencing robust growth, driven by an expanding understanding of its multifaceted applications and an increasing prevalence of conditions benefiting from riboflavin supplementation. The Compound Annual Growth Rate (CAGR) for the forecast period (2025-2033) is projected to be around 7.5%, with the market size expected to reach over one hundred million dollars by 2025 and continue its upward trajectory. Technological disruptions are primarily focused on enhancing the stability and bioavailability of the injection, alongside novel delivery methods to improve patient compliance and therapeutic outcomes. Consumer preferences are shifting towards specialized healthcare solutions, where the targeted administration of essential vitamins and coenzymes like riboflavin plays a crucial role. In the hospital segment, its use in ophthalmology, particularly for corneal cross-linking, is a significant growth driver. Competitive dynamics are intensifying as more players recognize the market potential, leading to increased investment in research and development. Market penetration is steadily increasing, especially in developed economies with advanced healthcare infrastructures and a higher awareness of preventative and therapeutic vitamin supplementation. The demand for specific dosage forms, such as 2ml:10mg and 5ml:15mg, is also on the rise, reflecting a greater precision in treatment protocols. The overall industry is poised for sustained expansion, supported by ongoing clinical research and an aging global population that often requires such therapeutic interventions.
Leading Markets & Segments in Riboflavin Sodium Phosphate Injection
The global Riboflavin Sodium Phosphate Injection market exhibits significant dominance in the Hospital application segment, which is projected to account for over 60% of the total market revenue by 2025, valued at approximately one hundred million dollars. This dominance is attributed to the critical role of these injections in inpatient care, surgical procedures, and the management of various medical conditions. Within the Hospital segment, key drivers include the increasing incidence of eye diseases requiring treatments like corneal cross-linking, the growing use in critical care units, and the integration of riboflavin into parenteral nutrition regimens.
The 2ml:10mg type segment is also a significant contributor, holding an estimated 35% market share and valued at around seventy million dollars in 2025. This specific dosage form offers a balance of therapeutic efficacy and ease of administration, making it a preferred choice for numerous clinical applications.
North America currently leads the market, driven by a robust healthcare infrastructure, high per capita healthcare spending, and a strong emphasis on research and development. The region's advanced pharmaceutical industry, coupled with supportive government initiatives for healthcare innovation, contributes significantly to market growth. The United States, in particular, represents a substantial portion of the North American market due to its large patient population and the presence of leading pharmaceutical companies.
In terms of country-specific dominance, the United States is expected to maintain its leading position, followed by European countries like Germany and the United Kingdom, and rapidly growing Asian markets such as China and India. Economic policies favoring pharmaceutical research, investment in advanced medical facilities, and a rising awareness about the benefits of riboflavin therapy are key factors propelling these regions. The increasing prevalence of age-related macular degeneration and other ophthalmic conditions in developed nations further solidifies the dominance of the Hospital application and specific dosage types like 2ml:10mg and 5ml:15mg.
Riboflavin Sodium Phosphate Injection Product Developments
Product developments in the Riboflavin Sodium Phosphate Injection market are largely focused on enhancing formulation stability, improving bioavailability, and exploring novel therapeutic applications. Companies are investing in research to create more concentrated or longer-acting formulations, aiming to reduce the frequency of administration and improve patient convenience. Advances in sterile manufacturing processes are ensuring higher product quality and safety. Furthermore, the ongoing exploration of riboflavin sodium phosphate's role in conjunction with other therapies, particularly in ophthalmology and neurology, presents significant opportunities for product differentiation and expanded market reach. These innovations are crucial for maintaining a competitive edge and meeting the evolving demands of healthcare providers.
Key Drivers of Riboflavin Sodium Phosphate Injection Growth
The growth of the Riboflavin Sodium Phosphate Injection market is propelled by several key factors. Technological advancements in drug formulation and delivery systems are enhancing efficacy and patient compliance. The increasing prevalence of eye conditions such as keratoconus, necessitating riboflavin-based corneal cross-linking, is a significant medical driver. Furthermore, a growing awareness of the importance of essential vitamins and coenzymes in metabolic health and disease prevention contributes to sustained demand. Supportive regulatory environments in key markets, coupled with increased healthcare expenditure globally, create a favorable landscape for market expansion.
Challenges in the Riboflavin Sodium Phosphate Injection Market
Despite its promising growth, the Riboflavin Sodium Phosphate Injection market faces several challenges. Stringent regulatory approval processes in different regions can prolong product launch timelines and increase development costs. The high cost of advanced manufacturing processes and quality control measures can also pose a barrier to entry for smaller players. Intense competition among established pharmaceutical companies and the potential emergence of biosimilar alternatives can put pressure on pricing. Supply chain disruptions, particularly for raw materials, can impact production and availability, affecting market stability.
Emerging Opportunities in Riboflavin Sodium Phosphate Injection
Emerging opportunities in the Riboflavin Sodium Phosphate Injection market are primarily driven by expanding therapeutic indications and geographical market penetration. Research into riboflavin's potential benefits in treating neurodegenerative diseases and certain metabolic disorders could unlock new patient populations. Strategic partnerships between pharmaceutical manufacturers and ophthalmic clinics or research institutions can accelerate clinical trials and market adoption. Furthermore, tapping into the burgeoning pharmaceutical markets in emerging economies presents significant growth potential through localized manufacturing and distribution strategies.
Leading Players in the Riboflavin Sodium Phosphate Sector
- Taisheng Pharma
- WZT
- CR
- Renhe Pharmaceuticals
- Bristol-Myers Squibb
- Teva
- Adcock Ingram
- Bahrain Pharma
- Bal Pharma
- Bimeda
- Roche
- Glaukos
- Pfizer
- Sandoz
Key Milestones in Riboflavin Sodium Phosphate Industry
- 2019: Initiation of several clinical trials exploring novel applications in ophthalmology.
- 2020: Increased investment in R&D for advanced riboflavin formulations.
- 2021: Regulatory approval for expanded indications in select Asian markets.
- 2022: Strategic collaborations between major players for enhanced market reach.
- 2023: Significant growth in the demand for 2ml:10mg dosage forms.
- 2024: Increased focus on sustainable manufacturing practices by leading companies.
- 2025: Projected market value to exceed one hundred million dollars.
- 2026-2033: Anticipated sustained growth driven by technological innovation and market expansion.
Strategic Outlook for Riboflavin Sodium Phosphate Injection Market
The strategic outlook for the Riboflavin Sodium Phosphate Injection market is one of sustained and robust growth. Key accelerators include continuous innovation in product development, focusing on improved efficacy and patient-centric delivery systems. Strategic partnerships and collaborations will be crucial for market expansion, particularly in underserved regions. Furthermore, leveraging advancements in biotechnology and personalized medicine will unlock new therapeutic avenues. Companies that can effectively navigate regulatory landscapes, optimize their supply chains, and capitalize on the increasing global demand for specialized pharmaceutical interventions are well-positioned for long-term success. The market is expected to witness further consolidation and an increased focus on value-added services.
Riboflavin Sodium Phosphate Injection Segmentation
-
1. Application
- 1.1. Hospital
- 1.2. Clinic
- 1.3. Other
-
2. Types
- 2.1. 2ml:5mg
- 2.2. 2ml:10mg
- 2.3. 5ml:15mg
- 2.4. Other
Riboflavin Sodium Phosphate Injection Segmentation By Geography
-
1. North America
- 1.1. United States
- 1.2. Canada
- 1.3. Mexico
-
2. South America
- 2.1. Brazil
- 2.2. Argentina
- 2.3. Rest of South America
-
3. Europe
- 3.1. United Kingdom
- 3.2. Germany
- 3.3. France
- 3.4. Italy
- 3.5. Spain
- 3.6. Russia
- 3.7. Benelux
- 3.8. Nordics
- 3.9. Rest of Europe
-
4. Middle East & Africa
- 4.1. Turkey
- 4.2. Israel
- 4.3. GCC
- 4.4. North Africa
- 4.5. South Africa
- 4.6. Rest of Middle East & Africa
-
5. Asia Pacific
- 5.1. China
- 5.2. India
- 5.3. Japan
- 5.4. South Korea
- 5.5. ASEAN
- 5.6. Oceania
- 5.7. Rest of Asia Pacific
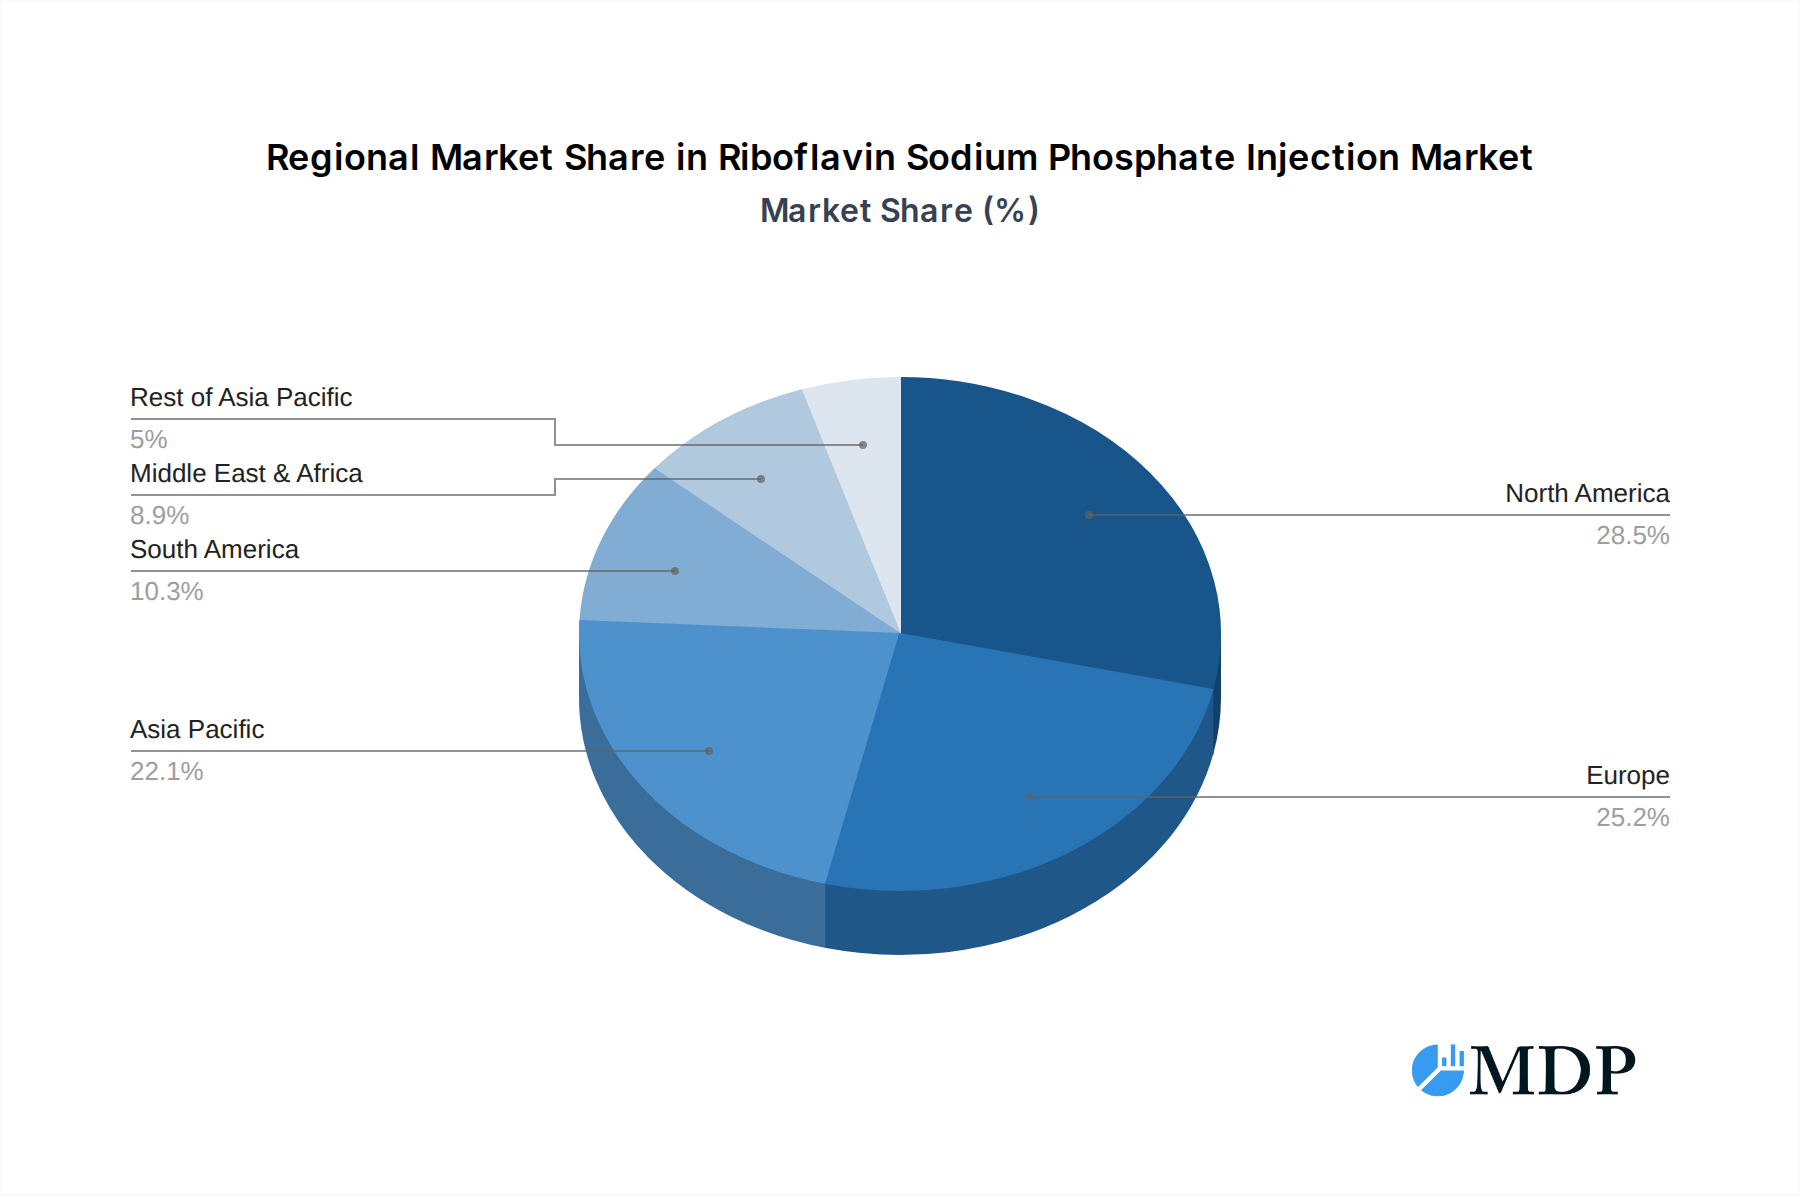
Riboflavin Sodium Phosphate Injection Regional Market Share
Geographic Coverage of Riboflavin Sodium Phosphate Injection
Riboflavin Sodium Phosphate Injection REPORT HIGHLIGHTS
| Aspects | Details |
|---|---|
| Study Period | 2020-2034 |
| Base Year | 2025 |
| Estimated Year | 2026 |
| Forecast Period | 2026-2034 |
| Historical Period | 2020-2025 |
| Growth Rate | CAGR of 6.65% from 2020-2034 |
| Segmentation |
|
Table of Contents
- 1. Introduction
- 1.1. Research Scope
- 1.2. Market Segmentation
- 1.3. Research Methodology
- 1.4. Definitions and Assumptions
- 2. Executive Summary
- 2.1. Introduction
- 3. Market Dynamics
- 3.1. Introduction
- 3.2. Market Drivers
- 3.3. Market Restrains
- 3.4. Market Trends
- 4. Market Factor Analysis
- 4.1. Porters Five Forces
- 4.2. Supply/Value Chain
- 4.3. PESTEL analysis
- 4.4. Market Entropy
- 4.5. Patent/Trademark Analysis
- 5. Global Riboflavin Sodium Phosphate Injection Analysis, Insights and Forecast, 2020-2032
- 5.1. Market Analysis, Insights and Forecast - by Application
- 5.1.1. Hospital
- 5.1.2. Clinic
- 5.1.3. Other
- 5.2. Market Analysis, Insights and Forecast - by Types
- 5.2.1. 2ml:5mg
- 5.2.2. 2ml:10mg
- 5.2.3. 5ml:15mg
- 5.2.4. Other
- 5.3. Market Analysis, Insights and Forecast - by Region
- 5.3.1. North America
- 5.3.2. South America
- 5.3.3. Europe
- 5.3.4. Middle East & Africa
- 5.3.5. Asia Pacific
- 5.1. Market Analysis, Insights and Forecast - by Application
- 6. North America Riboflavin Sodium Phosphate Injection Analysis, Insights and Forecast, 2020-2032
- 6.1. Market Analysis, Insights and Forecast - by Application
- 6.1.1. Hospital
- 6.1.2. Clinic
- 6.1.3. Other
- 6.2. Market Analysis, Insights and Forecast - by Types
- 6.2.1. 2ml:5mg
- 6.2.2. 2ml:10mg
- 6.2.3. 5ml:15mg
- 6.2.4. Other
- 6.1. Market Analysis, Insights and Forecast - by Application
- 7. South America Riboflavin Sodium Phosphate Injection Analysis, Insights and Forecast, 2020-2032
- 7.1. Market Analysis, Insights and Forecast - by Application
- 7.1.1. Hospital
- 7.1.2. Clinic
- 7.1.3. Other
- 7.2. Market Analysis, Insights and Forecast - by Types
- 7.2.1. 2ml:5mg
- 7.2.2. 2ml:10mg
- 7.2.3. 5ml:15mg
- 7.2.4. Other
- 7.1. Market Analysis, Insights and Forecast - by Application
- 8. Europe Riboflavin Sodium Phosphate Injection Analysis, Insights and Forecast, 2020-2032
- 8.1. Market Analysis, Insights and Forecast - by Application
- 8.1.1. Hospital
- 8.1.2. Clinic
- 8.1.3. Other
- 8.2. Market Analysis, Insights and Forecast - by Types
- 8.2.1. 2ml:5mg
- 8.2.2. 2ml:10mg
- 8.2.3. 5ml:15mg
- 8.2.4. Other
- 8.1. Market Analysis, Insights and Forecast - by Application
- 9. Middle East & Africa Riboflavin Sodium Phosphate Injection Analysis, Insights and Forecast, 2020-2032
- 9.1. Market Analysis, Insights and Forecast - by Application
- 9.1.1. Hospital
- 9.1.2. Clinic
- 9.1.3. Other
- 9.2. Market Analysis, Insights and Forecast - by Types
- 9.2.1. 2ml:5mg
- 9.2.2. 2ml:10mg
- 9.2.3. 5ml:15mg
- 9.2.4. Other
- 9.1. Market Analysis, Insights and Forecast - by Application
- 10. Asia Pacific Riboflavin Sodium Phosphate Injection Analysis, Insights and Forecast, 2020-2032
- 10.1. Market Analysis, Insights and Forecast - by Application
- 10.1.1. Hospital
- 10.1.2. Clinic
- 10.1.3. Other
- 10.2. Market Analysis, Insights and Forecast - by Types
- 10.2.1. 2ml:5mg
- 10.2.2. 2ml:10mg
- 10.2.3. 5ml:15mg
- 10.2.4. Other
- 10.1. Market Analysis, Insights and Forecast - by Application
- 11. Competitive Analysis
- 11.1. Global Market Share Analysis 2025
- 11.2. Company Profiles
- 11.2.1 Taisheng Pharma
- 11.2.1.1. Overview
- 11.2.1.2. Products
- 11.2.1.3. SWOT Analysis
- 11.2.1.4. Recent Developments
- 11.2.1.5. Financials (Based on Availability)
- 11.2.2 WZT
- 11.2.2.1. Overview
- 11.2.2.2. Products
- 11.2.2.3. SWOT Analysis
- 11.2.2.4. Recent Developments
- 11.2.2.5. Financials (Based on Availability)
- 11.2.3 CR
- 11.2.3.1. Overview
- 11.2.3.2. Products
- 11.2.3.3. SWOT Analysis
- 11.2.3.4. Recent Developments
- 11.2.3.5. Financials (Based on Availability)
- 11.2.4 Renhe Pharmaceuticals
- 11.2.4.1. Overview
- 11.2.4.2. Products
- 11.2.4.3. SWOT Analysis
- 11.2.4.4. Recent Developments
- 11.2.4.5. Financials (Based on Availability)
- 11.2.5 Bristol-Myers Squibb
- 11.2.5.1. Overview
- 11.2.5.2. Products
- 11.2.5.3. SWOT Analysis
- 11.2.5.4. Recent Developments
- 11.2.5.5. Financials (Based on Availability)
- 11.2.6 Teva
- 11.2.6.1. Overview
- 11.2.6.2. Products
- 11.2.6.3. SWOT Analysis
- 11.2.6.4. Recent Developments
- 11.2.6.5. Financials (Based on Availability)
- 11.2.7 Adcock Ingram
- 11.2.7.1. Overview
- 11.2.7.2. Products
- 11.2.7.3. SWOT Analysis
- 11.2.7.4. Recent Developments
- 11.2.7.5. Financials (Based on Availability)
- 11.2.8 Bahrain Pharma
- 11.2.8.1. Overview
- 11.2.8.2. Products
- 11.2.8.3. SWOT Analysis
- 11.2.8.4. Recent Developments
- 11.2.8.5. Financials (Based on Availability)
- 11.2.9 Bal Pharma
- 11.2.9.1. Overview
- 11.2.9.2. Products
- 11.2.9.3. SWOT Analysis
- 11.2.9.4. Recent Developments
- 11.2.9.5. Financials (Based on Availability)
- 11.2.10 Bimeda
- 11.2.10.1. Overview
- 11.2.10.2. Products
- 11.2.10.3. SWOT Analysis
- 11.2.10.4. Recent Developments
- 11.2.10.5. Financials (Based on Availability)
- 11.2.11 Roche
- 11.2.11.1. Overview
- 11.2.11.2. Products
- 11.2.11.3. SWOT Analysis
- 11.2.11.4. Recent Developments
- 11.2.11.5. Financials (Based on Availability)
- 11.2.12 Glaukos
- 11.2.12.1. Overview
- 11.2.12.2. Products
- 11.2.12.3. SWOT Analysis
- 11.2.12.4. Recent Developments
- 11.2.12.5. Financials (Based on Availability)
- 11.2.13 Pfizer
- 11.2.13.1. Overview
- 11.2.13.2. Products
- 11.2.13.3. SWOT Analysis
- 11.2.13.4. Recent Developments
- 11.2.13.5. Financials (Based on Availability)
- 11.2.14 Sandoz
- 11.2.14.1. Overview
- 11.2.14.2. Products
- 11.2.14.3. SWOT Analysis
- 11.2.14.4. Recent Developments
- 11.2.14.5. Financials (Based on Availability)
- 11.2.1 Taisheng Pharma
List of Figures
- Figure 1: Global Riboflavin Sodium Phosphate Injection Revenue Breakdown (million, %) by Region 2025 & 2033
- Figure 2: Global Riboflavin Sodium Phosphate Injection Volume Breakdown (K, %) by Region 2025 & 2033
- Figure 3: North America Riboflavin Sodium Phosphate Injection Revenue (million), by Application 2025 & 2033
- Figure 4: North America Riboflavin Sodium Phosphate Injection Volume (K), by Application 2025 & 2033
- Figure 5: North America Riboflavin Sodium Phosphate Injection Revenue Share (%), by Application 2025 & 2033
- Figure 6: North America Riboflavin Sodium Phosphate Injection Volume Share (%), by Application 2025 & 2033
- Figure 7: North America Riboflavin Sodium Phosphate Injection Revenue (million), by Types 2025 & 2033
- Figure 8: North America Riboflavin Sodium Phosphate Injection Volume (K), by Types 2025 & 2033
- Figure 9: North America Riboflavin Sodium Phosphate Injection Revenue Share (%), by Types 2025 & 2033
- Figure 10: North America Riboflavin Sodium Phosphate Injection Volume Share (%), by Types 2025 & 2033
- Figure 11: North America Riboflavin Sodium Phosphate Injection Revenue (million), by Country 2025 & 2033
- Figure 12: North America Riboflavin Sodium Phosphate Injection Volume (K), by Country 2025 & 2033
- Figure 13: North America Riboflavin Sodium Phosphate Injection Revenue Share (%), by Country 2025 & 2033
- Figure 14: North America Riboflavin Sodium Phosphate Injection Volume Share (%), by Country 2025 & 2033
- Figure 15: South America Riboflavin Sodium Phosphate Injection Revenue (million), by Application 2025 & 2033
- Figure 16: South America Riboflavin Sodium Phosphate Injection Volume (K), by Application 2025 & 2033
- Figure 17: South America Riboflavin Sodium Phosphate Injection Revenue Share (%), by Application 2025 & 2033
- Figure 18: South America Riboflavin Sodium Phosphate Injection Volume Share (%), by Application 2025 & 2033
- Figure 19: South America Riboflavin Sodium Phosphate Injection Revenue (million), by Types 2025 & 2033
- Figure 20: South America Riboflavin Sodium Phosphate Injection Volume (K), by Types 2025 & 2033
- Figure 21: South America Riboflavin Sodium Phosphate Injection Revenue Share (%), by Types 2025 & 2033
- Figure 22: South America Riboflavin Sodium Phosphate Injection Volume Share (%), by Types 2025 & 2033
- Figure 23: South America Riboflavin Sodium Phosphate Injection Revenue (million), by Country 2025 & 2033
- Figure 24: South America Riboflavin Sodium Phosphate Injection Volume (K), by Country 2025 & 2033
- Figure 25: South America Riboflavin Sodium Phosphate Injection Revenue Share (%), by Country 2025 & 2033
- Figure 26: South America Riboflavin Sodium Phosphate Injection Volume Share (%), by Country 2025 & 2033
- Figure 27: Europe Riboflavin Sodium Phosphate Injection Revenue (million), by Application 2025 & 2033
- Figure 28: Europe Riboflavin Sodium Phosphate Injection Volume (K), by Application 2025 & 2033
- Figure 29: Europe Riboflavin Sodium Phosphate Injection Revenue Share (%), by Application 2025 & 2033
- Figure 30: Europe Riboflavin Sodium Phosphate Injection Volume Share (%), by Application 2025 & 2033
- Figure 31: Europe Riboflavin Sodium Phosphate Injection Revenue (million), by Types 2025 & 2033
- Figure 32: Europe Riboflavin Sodium Phosphate Injection Volume (K), by Types 2025 & 2033
- Figure 33: Europe Riboflavin Sodium Phosphate Injection Revenue Share (%), by Types 2025 & 2033
- Figure 34: Europe Riboflavin Sodium Phosphate Injection Volume Share (%), by Types 2025 & 2033
- Figure 35: Europe Riboflavin Sodium Phosphate Injection Revenue (million), by Country 2025 & 2033
- Figure 36: Europe Riboflavin Sodium Phosphate Injection Volume (K), by Country 2025 & 2033
- Figure 37: Europe Riboflavin Sodium Phosphate Injection Revenue Share (%), by Country 2025 & 2033
- Figure 38: Europe Riboflavin Sodium Phosphate Injection Volume Share (%), by Country 2025 & 2033
- Figure 39: Middle East & Africa Riboflavin Sodium Phosphate Injection Revenue (million), by Application 2025 & 2033
- Figure 40: Middle East & Africa Riboflavin Sodium Phosphate Injection Volume (K), by Application 2025 & 2033
- Figure 41: Middle East & Africa Riboflavin Sodium Phosphate Injection Revenue Share (%), by Application 2025 & 2033
- Figure 42: Middle East & Africa Riboflavin Sodium Phosphate Injection Volume Share (%), by Application 2025 & 2033
- Figure 43: Middle East & Africa Riboflavin Sodium Phosphate Injection Revenue (million), by Types 2025 & 2033
- Figure 44: Middle East & Africa Riboflavin Sodium Phosphate Injection Volume (K), by Types 2025 & 2033
- Figure 45: Middle East & Africa Riboflavin Sodium Phosphate Injection Revenue Share (%), by Types 2025 & 2033
- Figure 46: Middle East & Africa Riboflavin Sodium Phosphate Injection Volume Share (%), by Types 2025 & 2033
- Figure 47: Middle East & Africa Riboflavin Sodium Phosphate Injection Revenue (million), by Country 2025 & 2033
- Figure 48: Middle East & Africa Riboflavin Sodium Phosphate Injection Volume (K), by Country 2025 & 2033
- Figure 49: Middle East & Africa Riboflavin Sodium Phosphate Injection Revenue Share (%), by Country 2025 & 2033
- Figure 50: Middle East & Africa Riboflavin Sodium Phosphate Injection Volume Share (%), by Country 2025 & 2033
- Figure 51: Asia Pacific Riboflavin Sodium Phosphate Injection Revenue (million), by Application 2025 & 2033
- Figure 52: Asia Pacific Riboflavin Sodium Phosphate Injection Volume (K), by Application 2025 & 2033
- Figure 53: Asia Pacific Riboflavin Sodium Phosphate Injection Revenue Share (%), by Application 2025 & 2033
- Figure 54: Asia Pacific Riboflavin Sodium Phosphate Injection Volume Share (%), by Application 2025 & 2033
- Figure 55: Asia Pacific Riboflavin Sodium Phosphate Injection Revenue (million), by Types 2025 & 2033
- Figure 56: Asia Pacific Riboflavin Sodium Phosphate Injection Volume (K), by Types 2025 & 2033
- Figure 57: Asia Pacific Riboflavin Sodium Phosphate Injection Revenue Share (%), by Types 2025 & 2033
- Figure 58: Asia Pacific Riboflavin Sodium Phosphate Injection Volume Share (%), by Types 2025 & 2033
- Figure 59: Asia Pacific Riboflavin Sodium Phosphate Injection Revenue (million), by Country 2025 & 2033
- Figure 60: Asia Pacific Riboflavin Sodium Phosphate Injection Volume (K), by Country 2025 & 2033
- Figure 61: Asia Pacific Riboflavin Sodium Phosphate Injection Revenue Share (%), by Country 2025 & 2033
- Figure 62: Asia Pacific Riboflavin Sodium Phosphate Injection Volume Share (%), by Country 2025 & 2033
List of Tables
- Table 1: Global Riboflavin Sodium Phosphate Injection Revenue million Forecast, by Application 2020 & 2033
- Table 2: Global Riboflavin Sodium Phosphate Injection Volume K Forecast, by Application 2020 & 2033
- Table 3: Global Riboflavin Sodium Phosphate Injection Revenue million Forecast, by Types 2020 & 2033
- Table 4: Global Riboflavin Sodium Phosphate Injection Volume K Forecast, by Types 2020 & 2033
- Table 5: Global Riboflavin Sodium Phosphate Injection Revenue million Forecast, by Region 2020 & 2033
- Table 6: Global Riboflavin Sodium Phosphate Injection Volume K Forecast, by Region 2020 & 2033
- Table 7: Global Riboflavin Sodium Phosphate Injection Revenue million Forecast, by Application 2020 & 2033
- Table 8: Global Riboflavin Sodium Phosphate Injection Volume K Forecast, by Application 2020 & 2033
- Table 9: Global Riboflavin Sodium Phosphate Injection Revenue million Forecast, by Types 2020 & 2033
- Table 10: Global Riboflavin Sodium Phosphate Injection Volume K Forecast, by Types 2020 & 2033
- Table 11: Global Riboflavin Sodium Phosphate Injection Revenue million Forecast, by Country 2020 & 2033
- Table 12: Global Riboflavin Sodium Phosphate Injection Volume K Forecast, by Country 2020 & 2033
- Table 13: United States Riboflavin Sodium Phosphate Injection Revenue (million) Forecast, by Application 2020 & 2033
- Table 14: United States Riboflavin Sodium Phosphate Injection Volume (K) Forecast, by Application 2020 & 2033
- Table 15: Canada Riboflavin Sodium Phosphate Injection Revenue (million) Forecast, by Application 2020 & 2033
- Table 16: Canada Riboflavin Sodium Phosphate Injection Volume (K) Forecast, by Application 2020 & 2033
- Table 17: Mexico Riboflavin Sodium Phosphate Injection Revenue (million) Forecast, by Application 2020 & 2033
- Table 18: Mexico Riboflavin Sodium Phosphate Injection Volume (K) Forecast, by Application 2020 & 2033
- Table 19: Global Riboflavin Sodium Phosphate Injection Revenue million Forecast, by Application 2020 & 2033
- Table 20: Global Riboflavin Sodium Phosphate Injection Volume K Forecast, by Application 2020 & 2033
- Table 21: Global Riboflavin Sodium Phosphate Injection Revenue million Forecast, by Types 2020 & 2033
- Table 22: Global Riboflavin Sodium Phosphate Injection Volume K Forecast, by Types 2020 & 2033
- Table 23: Global Riboflavin Sodium Phosphate Injection Revenue million Forecast, by Country 2020 & 2033
- Table 24: Global Riboflavin Sodium Phosphate Injection Volume K Forecast, by Country 2020 & 2033
- Table 25: Brazil Riboflavin Sodium Phosphate Injection Revenue (million) Forecast, by Application 2020 & 2033
- Table 26: Brazil Riboflavin Sodium Phosphate Injection Volume (K) Forecast, by Application 2020 & 2033
- Table 27: Argentina Riboflavin Sodium Phosphate Injection Revenue (million) Forecast, by Application 2020 & 2033
- Table 28: Argentina Riboflavin Sodium Phosphate Injection Volume (K) Forecast, by Application 2020 & 2033
- Table 29: Rest of South America Riboflavin Sodium Phosphate Injection Revenue (million) Forecast, by Application 2020 & 2033
- Table 30: Rest of South America Riboflavin Sodium Phosphate Injection Volume (K) Forecast, by Application 2020 & 2033
- Table 31: Global Riboflavin Sodium Phosphate Injection Revenue million Forecast, by Application 2020 & 2033
- Table 32: Global Riboflavin Sodium Phosphate Injection Volume K Forecast, by Application 2020 & 2033
- Table 33: Global Riboflavin Sodium Phosphate Injection Revenue million Forecast, by Types 2020 & 2033
- Table 34: Global Riboflavin Sodium Phosphate Injection Volume K Forecast, by Types 2020 & 2033
- Table 35: Global Riboflavin Sodium Phosphate Injection Revenue million Forecast, by Country 2020 & 2033
- Table 36: Global Riboflavin Sodium Phosphate Injection Volume K Forecast, by Country 2020 & 2033
- Table 37: United Kingdom Riboflavin Sodium Phosphate Injection Revenue (million) Forecast, by Application 2020 & 2033
- Table 38: United Kingdom Riboflavin Sodium Phosphate Injection Volume (K) Forecast, by Application 2020 & 2033
- Table 39: Germany Riboflavin Sodium Phosphate Injection Revenue (million) Forecast, by Application 2020 & 2033
- Table 40: Germany Riboflavin Sodium Phosphate Injection Volume (K) Forecast, by Application 2020 & 2033
- Table 41: France Riboflavin Sodium Phosphate Injection Revenue (million) Forecast, by Application 2020 & 2033
- Table 42: France Riboflavin Sodium Phosphate Injection Volume (K) Forecast, by Application 2020 & 2033
- Table 43: Italy Riboflavin Sodium Phosphate Injection Revenue (million) Forecast, by Application 2020 & 2033
- Table 44: Italy Riboflavin Sodium Phosphate Injection Volume (K) Forecast, by Application 2020 & 2033
- Table 45: Spain Riboflavin Sodium Phosphate Injection Revenue (million) Forecast, by Application 2020 & 2033
- Table 46: Spain Riboflavin Sodium Phosphate Injection Volume (K) Forecast, by Application 2020 & 2033
- Table 47: Russia Riboflavin Sodium Phosphate Injection Revenue (million) Forecast, by Application 2020 & 2033
- Table 48: Russia Riboflavin Sodium Phosphate Injection Volume (K) Forecast, by Application 2020 & 2033
- Table 49: Benelux Riboflavin Sodium Phosphate Injection Revenue (million) Forecast, by Application 2020 & 2033
- Table 50: Benelux Riboflavin Sodium Phosphate Injection Volume (K) Forecast, by Application 2020 & 2033
- Table 51: Nordics Riboflavin Sodium Phosphate Injection Revenue (million) Forecast, by Application 2020 & 2033
- Table 52: Nordics Riboflavin Sodium Phosphate Injection Volume (K) Forecast, by Application 2020 & 2033
- Table 53: Rest of Europe Riboflavin Sodium Phosphate Injection Revenue (million) Forecast, by Application 2020 & 2033
- Table 54: Rest of Europe Riboflavin Sodium Phosphate Injection Volume (K) Forecast, by Application 2020 & 2033
- Table 55: Global Riboflavin Sodium Phosphate Injection Revenue million Forecast, by Application 2020 & 2033
- Table 56: Global Riboflavin Sodium Phosphate Injection Volume K Forecast, by Application 2020 & 2033
- Table 57: Global Riboflavin Sodium Phosphate Injection Revenue million Forecast, by Types 2020 & 2033
- Table 58: Global Riboflavin Sodium Phosphate Injection Volume K Forecast, by Types 2020 & 2033
- Table 59: Global Riboflavin Sodium Phosphate Injection Revenue million Forecast, by Country 2020 & 2033
- Table 60: Global Riboflavin Sodium Phosphate Injection Volume K Forecast, by Country 2020 & 2033
- Table 61: Turkey Riboflavin Sodium Phosphate Injection Revenue (million) Forecast, by Application 2020 & 2033
- Table 62: Turkey Riboflavin Sodium Phosphate Injection Volume (K) Forecast, by Application 2020 & 2033
- Table 63: Israel Riboflavin Sodium Phosphate Injection Revenue (million) Forecast, by Application 2020 & 2033
- Table 64: Israel Riboflavin Sodium Phosphate Injection Volume (K) Forecast, by Application 2020 & 2033
- Table 65: GCC Riboflavin Sodium Phosphate Injection Revenue (million) Forecast, by Application 2020 & 2033
- Table 66: GCC Riboflavin Sodium Phosphate Injection Volume (K) Forecast, by Application 2020 & 2033
- Table 67: North Africa Riboflavin Sodium Phosphate Injection Revenue (million) Forecast, by Application 2020 & 2033
- Table 68: North Africa Riboflavin Sodium Phosphate Injection Volume (K) Forecast, by Application 2020 & 2033
- Table 69: South Africa Riboflavin Sodium Phosphate Injection Revenue (million) Forecast, by Application 2020 & 2033
- Table 70: South Africa Riboflavin Sodium Phosphate Injection Volume (K) Forecast, by Application 2020 & 2033
- Table 71: Rest of Middle East & Africa Riboflavin Sodium Phosphate Injection Revenue (million) Forecast, by Application 2020 & 2033
- Table 72: Rest of Middle East & Africa Riboflavin Sodium Phosphate Injection Volume (K) Forecast, by Application 2020 & 2033
- Table 73: Global Riboflavin Sodium Phosphate Injection Revenue million Forecast, by Application 2020 & 2033
- Table 74: Global Riboflavin Sodium Phosphate Injection Volume K Forecast, by Application 2020 & 2033
- Table 75: Global Riboflavin Sodium Phosphate Injection Revenue million Forecast, by Types 2020 & 2033
- Table 76: Global Riboflavin Sodium Phosphate Injection Volume K Forecast, by Types 2020 & 2033
- Table 77: Global Riboflavin Sodium Phosphate Injection Revenue million Forecast, by Country 2020 & 2033
- Table 78: Global Riboflavin Sodium Phosphate Injection Volume K Forecast, by Country 2020 & 2033
- Table 79: China Riboflavin Sodium Phosphate Injection Revenue (million) Forecast, by Application 2020 & 2033
- Table 80: China Riboflavin Sodium Phosphate Injection Volume (K) Forecast, by Application 2020 & 2033
- Table 81: India Riboflavin Sodium Phosphate Injection Revenue (million) Forecast, by Application 2020 & 2033
- Table 82: India Riboflavin Sodium Phosphate Injection Volume (K) Forecast, by Application 2020 & 2033
- Table 83: Japan Riboflavin Sodium Phosphate Injection Revenue (million) Forecast, by Application 2020 & 2033
- Table 84: Japan Riboflavin Sodium Phosphate Injection Volume (K) Forecast, by Application 2020 & 2033
- Table 85: South Korea Riboflavin Sodium Phosphate Injection Revenue (million) Forecast, by Application 2020 & 2033
- Table 86: South Korea Riboflavin Sodium Phosphate Injection Volume (K) Forecast, by Application 2020 & 2033
- Table 87: ASEAN Riboflavin Sodium Phosphate Injection Revenue (million) Forecast, by Application 2020 & 2033
- Table 88: ASEAN Riboflavin Sodium Phosphate Injection Volume (K) Forecast, by Application 2020 & 2033
- Table 89: Oceania Riboflavin Sodium Phosphate Injection Revenue (million) Forecast, by Application 2020 & 2033
- Table 90: Oceania Riboflavin Sodium Phosphate Injection Volume (K) Forecast, by Application 2020 & 2033
- Table 91: Rest of Asia Pacific Riboflavin Sodium Phosphate Injection Revenue (million) Forecast, by Application 2020 & 2033
- Table 92: Rest of Asia Pacific Riboflavin Sodium Phosphate Injection Volume (K) Forecast, by Application 2020 & 2033
Frequently Asked Questions
1. What is the projected Compound Annual Growth Rate (CAGR) of the Riboflavin Sodium Phosphate Injection?
The projected CAGR is approximately 6.65%.
2. Which companies are prominent players in the Riboflavin Sodium Phosphate Injection?
Key companies in the market include Taisheng Pharma, WZT, CR, Renhe Pharmaceuticals, Bristol-Myers Squibb, Teva, Adcock Ingram, Bahrain Pharma, Bal Pharma, Bimeda, Roche, Glaukos, Pfizer, Sandoz.
3. What are the main segments of the Riboflavin Sodium Phosphate Injection?
The market segments include Application, Types.
4. Can you provide details about the market size?
The market size is estimated to be USD 481.6 million as of 2022.
5. What are some drivers contributing to market growth?
N/A
6. What are the notable trends driving market growth?
N/A
7. Are there any restraints impacting market growth?
N/A
8. Can you provide examples of recent developments in the market?
N/A
9. What pricing options are available for accessing the report?
Pricing options include single-user, multi-user, and enterprise licenses priced at USD 3350.00, USD 5025.00, and USD 6700.00 respectively.
10. Is the market size provided in terms of value or volume?
The market size is provided in terms of value, measured in million and volume, measured in K.
11. Are there any specific market keywords associated with the report?
Yes, the market keyword associated with the report is "Riboflavin Sodium Phosphate Injection," which aids in identifying and referencing the specific market segment covered.
12. How do I determine which pricing option suits my needs best?
The pricing options vary based on user requirements and access needs. Individual users may opt for single-user licenses, while businesses requiring broader access may choose multi-user or enterprise licenses for cost-effective access to the report.
13. Are there any additional resources or data provided in the Riboflavin Sodium Phosphate Injection report?
While the report offers comprehensive insights, it's advisable to review the specific contents or supplementary materials provided to ascertain if additional resources or data are available.
14. How can I stay updated on further developments or reports in the Riboflavin Sodium Phosphate Injection?
To stay informed about further developments, trends, and reports in the Riboflavin Sodium Phosphate Injection, consider subscribing to industry newsletters, following relevant companies and organizations, or regularly checking reputable industry news sources and publications.
Methodology
Step 1 - Identification of Relevant Samples Size from Population Database


Step 2 - Approaches for Defining Global Market Size (Value, Volume* & Price*)

Note*: In applicable scenarios
Step 3 - Data Sources
Primary Research
- Web Analytics
- Survey Reports
- Research Institute
- Latest Research Reports
- Opinion Leaders
Secondary Research
- Annual Reports
- White Paper
- Latest Press Release
- Industry Association
- Paid Database
- Investor Presentations

Step 4 - Data Triangulation
Involves using different sources of information in order to increase the validity of a study
These sources are likely to be stakeholders in a program - participants, other researchers, program staff, other community members, and so on.
Then we put all data in single framework & apply various statistical tools to find out the dynamic on the market.
During the analysis stage, feedback from the stakeholder groups would be compared to determine areas of agreement as well as areas of divergence