

Key Insights
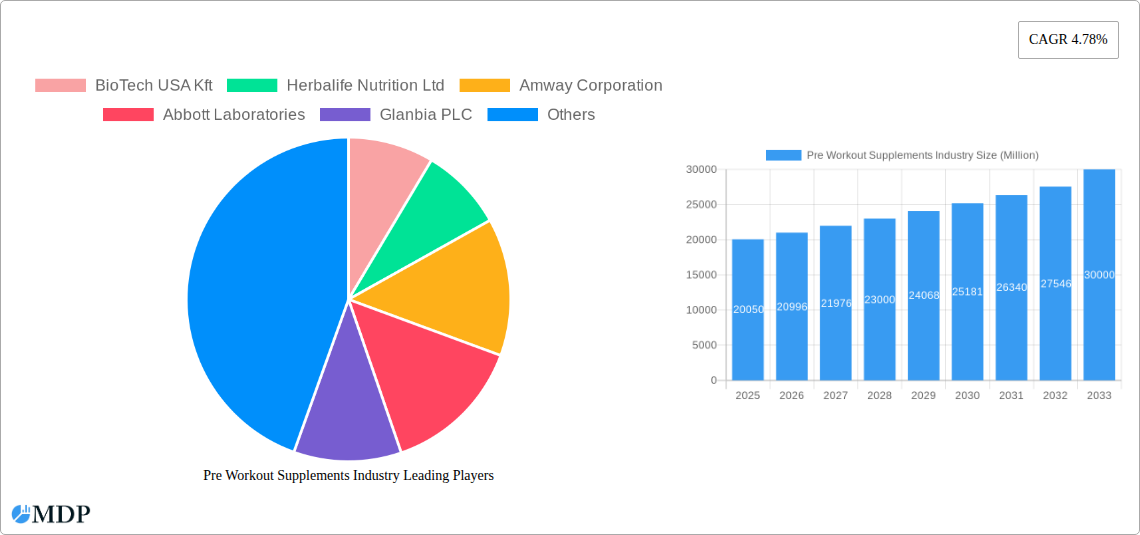
The pre-workout supplement market, valued at $20.05 billion in 2025, is projected to experience robust growth, driven by the rising popularity of fitness and athletic activities globally. A Compound Annual Growth Rate (CAGR) of 4.78% from 2025 to 2033 indicates a significant expansion, reaching an estimated $30 billion by 2033. This growth is fueled by several key factors. Increased consumer awareness of the benefits of pre-workout supplements in enhancing athletic performance, improving energy levels, and boosting muscle growth is a significant driver. The growing popularity of fitness regimes, including weight training, CrossFit, and high-intensity interval training (HIIT), further fuels demand. Furthermore, the expanding online retail sector provides easy access to a wider range of products, contributing to market expansion. Product diversification, with offerings ranging from powders and capsules to ready-to-drink formulations, caters to diverse consumer preferences and lifestyles, further boosting market penetration. While the market faces restraints such as concerns about potential side effects and stringent regulatory requirements, the overall positive trend towards health and fitness is expected to offset these challenges. The market is segmented by type (powder, capsule/tablet, drinks, others) and distribution channel (hypermarkets/supermarkets, specialty stores, online retail stores, others), revealing powder formulations and online retail as dominant segments. Key players like BioTech USA, Herbalife Nutrition, and Amway, along with numerous other companies are competing aggressively through innovation and brand building. North America, Europe, and Asia-Pacific represent the largest regional markets, reflecting higher fitness awareness and disposable incomes in these regions.
The competitive landscape is characterized by both established players and emerging brands vying for market share. Innovation in product formulation, focusing on improved efficacy, natural ingredients, and targeted benefits (e.g., enhanced endurance, increased power output), is a crucial factor for success. Marketing strategies emphasizing the science behind the supplements and addressing consumer concerns about safety and efficacy are essential for building trust and driving sales. Future growth will likely be influenced by trends such as personalized nutrition, the increasing demand for plant-based and organic supplements, and the integration of technology in fitness tracking and supplement recommendations. The industry is witnessing increasing emphasis on transparency and labeling, with consumers demanding greater clarity on ingredient sourcing and potential interactions. This trend underscores the need for robust quality control and ethical manufacturing practices.
Pre Workout Supplements Industry Report: 2019-2033 Forecast
This comprehensive report provides an in-depth analysis of the global pre workout supplements market, projecting a market value exceeding $XX Billion by 2033. The study covers the historical period (2019-2024), the base year (2025), and the forecast period (2025-2033), offering invaluable insights for industry stakeholders, investors, and market entrants. We analyze market dynamics, trends, leading players (including BioTech USA Kft, Herbalife Nutrition Ltd, Amway Corporation, Abbott Laboratories, Glanbia PLC, Nutrex Research Inc, MusclePharm Corporation, QNT SA, Bulk, and Nutrabolt), and future opportunities to help you navigate this rapidly evolving sector.
Pre Workout Supplements Industry Market Dynamics & Concentration
The pre workout supplement market is characterized by a moderately concentrated landscape, with a few major players holding significant market share. The market share of the top five companies in 2025 is estimated to be approximately 45%. Innovation is a key driver, with companies constantly developing new formulations and delivery methods to cater to evolving consumer preferences. Stringent regulatory frameworks, particularly regarding ingredient safety and labeling, impact market dynamics. Product substitutes, such as natural energy boosters and alternative fitness regimes, exert competitive pressure. Consumer trends toward health and wellness, along with increased participation in fitness activities, significantly fuel market growth. Mergers and acquisitions (M&A) are prevalent, with an estimated XX M&A deals occurring between 2019 and 2024, indicating consolidation and strategic expansion within the industry.
- Market Concentration: Top 5 players hold ~45% market share (2025 estimate).
- Innovation Drivers: New formulations, delivery methods (e.g., ready-to-drink), and functional ingredients.
- Regulatory Framework: Stringent regulations on ingredient safety and labeling.
- Product Substitutes: Natural energy boosters, alternative fitness approaches.
- End-User Trends: Growing health consciousness and fitness participation.
- M&A Activity: XX M&A deals (2019-2024).
Pre Workout Supplements Industry Industry Trends & Analysis
The global pre workout supplements market is experiencing robust growth, with a projected CAGR of XX% during the forecast period (2025-2033). This growth is driven by several key factors. Rising health consciousness among consumers, particularly millennials and Gen Z, fuels demand for performance-enhancing supplements. Technological advancements in ingredient sourcing, formulation, and delivery systems enhance product efficacy and appeal. Consumer preference for natural and organic ingredients is also shaping the market. The growing popularity of online retail channels provides convenient access to a wider selection of products. However, the market also faces competitive pressures from both established players and emerging brands. Intense marketing and branding strategies are crucial for success. Market penetration is highest in developed economies but is rapidly expanding into emerging markets.

Leading Markets & Segments in Pre Workout Supplements Industry
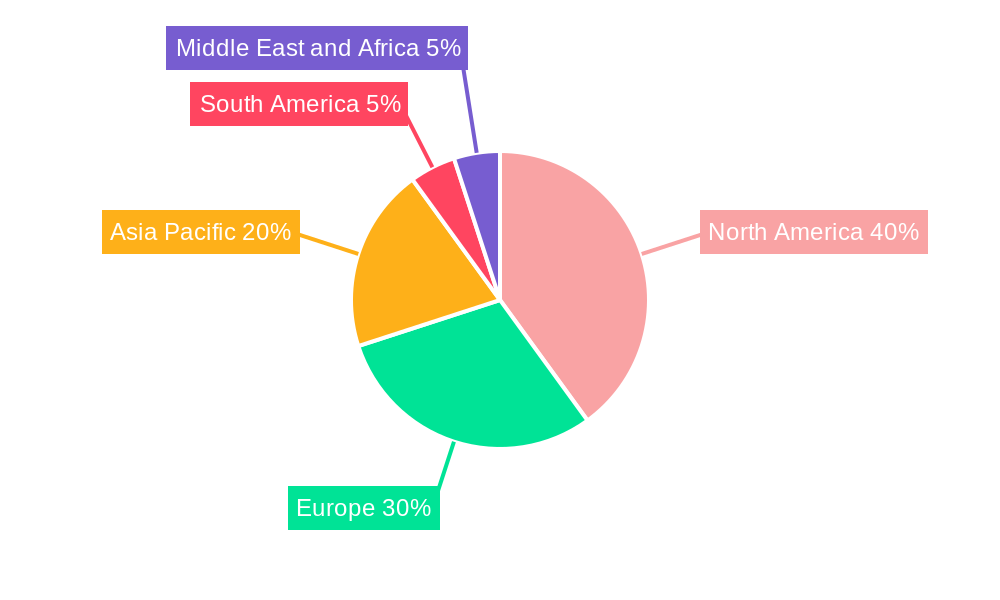
The North American region is currently the dominant market for pre workout supplements, followed by Europe. Within product types, powder supplements maintain the largest market share due to affordability and versatility. Online retail stores are experiencing the fastest growth in distribution channels, owing to their convenience and wider reach.
- Dominant Region: North America
- Dominant Type: Powder
- Dominant Distribution Channel: Online Retail Stores
Key Drivers:
- North America: High disposable income, strong fitness culture, and early adoption of new products.
- Europe: Increasing health awareness and participation in sports and fitness activities.
- Powder: Cost-effectiveness, flexibility, and ease of use.
- Online Retail: Convenience, wider product selection, and targeted marketing capabilities.
Pre Workout Supplements Industry Product Developments
Recent product innovations focus on enhanced ingredient profiles, improved bioavailability, and customized formulations to meet individual needs. Technological advancements are enabling the development of more sophisticated delivery systems, such as sustained-release capsules and innovative drink mixes. The emphasis is on creating products that deliver superior performance benefits, meet consumer demand for clean ingredients, and cater to various dietary requirements.
Key Drivers of Pre Workout Supplements Industry Growth
Several factors fuel the growth of the pre workout supplements market. The rising prevalence of health and wellness trends globally drives demand for products that improve athletic performance and enhance overall well-being. Technological advancements in supplement formulation and delivery systems, coupled with increasing consumer awareness of the benefits of pre workout supplements, contributes significantly to growth. Favorable government regulations in some regions support market expansion.
Challenges in the Pre Workout Supplements Industry Market
The pre workout supplements market faces challenges like stringent regulations on ingredient safety and labeling, which increase costs and compliance complexities. Supply chain disruptions, especially concerning raw material sourcing, can affect production and pricing. Intense competition from numerous established and emerging brands necessitates continuous innovation and effective marketing strategies to maintain market share. Fluctuations in raw material costs, impacting profitability and pricing.
Emerging Opportunities in Pre Workout Supplements Industry
The pre workout supplements market presents numerous opportunities. Technological breakthroughs, such as personalized nutrition and advanced delivery systems, can create new product categories. Strategic partnerships with fitness brands and influencers can expand market reach and consumer engagement. Market expansion into emerging economies with growing health-conscious populations offers significant potential.
Leading Players in the Pre Workout Supplements Industry Sector
- BioTech USA Kft
- Herbalife Nutrition Ltd
- Amway Corporation
- Abbott Laboratories
- Glanbia PLC
- Nutrex Research Inc
- MusclePharm Corporation
- QNT SA
- Bulk
- Nutrabolt
Key Milestones in Pre Workout Supplements Industry Industry
- 2020: Increased demand for immunity-boosting pre-workout supplements due to the pandemic.
- 2021: Launch of several plant-based pre workout supplements.
- 2022: Major players invest in sustainable sourcing and packaging.
- 2023: Several mergers and acquisitions consolidate the market.
- 2024: Growing adoption of personalized nutrition approaches in pre-workout supplements.
Strategic Outlook for Pre Workout Supplements Industry Market
The future of the pre workout supplements market is bright, driven by sustained growth in health consciousness and increasing investment in research and development. Strategic opportunities lie in personalized nutrition, sustainable sourcing, and expansion into new markets. Focusing on innovation, marketing, and strategic partnerships will be critical for long-term success.
Pre Workout Supplements Industry Segmentation
-
1. Type
- 1.1. Powder
- 1.2. Capsule/ Tablet
- 1.3. Drinks
- 1.4. Other Types
-
2. Distribution Channel
- 2.1. Hypermarket/Supermarket
- 2.2. Specialty Stores
- 2.3. Online Retail Stores
- 2.4. Other Distribution Channels
Pre Workout Supplements Industry Segmentation By Geography
-
1. North America
- 1.1. United States
- 1.2. Canada
- 1.3. Mexico
- 1.4. Rest of North America
-
2. Europe
- 2.1. Spain
- 2.2. United Kingdom
- 2.3. Germany
- 2.4. France
- 2.5. Italy
- 2.6. Russia
- 2.7. Rest of Europe
-
3. Asia Pacific
- 3.1. China
- 3.2. Japan
- 3.3. India
- 3.4. Australia
- 3.5. Rest of Asia Pacific
-
4. South America
- 4.1. Brazil
- 4.2. Argentina
- 4.3. Rest of South America
-
5. Middle East and Africa
- 5.1. United Arab Emirates
- 5.2. South Africa
- 5.3. Rest of Middle East and Africa
Pre Workout Supplements Industry REPORT HIGHLIGHTS
| Aspects | Details |
|---|---|
| Study Period | 2019-2033 |
| Base Year | 2024 |
| Estimated Year | 2025 |
| Forecast Period | 2025-2033 |
| Historical Period | 2019-2024 |
| Growth Rate | CAGR of 4.78% from 2019-2033 |
| Segmentation |
|
Table of Contents
- 1. Introduction
- 1.1. Research Scope
- 1.2. Market Segmentation
- 1.3. Research Methodology
- 1.4. Definitions and Assumptions
- 2. Executive Summary
- 2.1. Introduction
- 3. Market Dynamics
- 3.1. Introduction
- 3.2. Market Drivers
- 3.2.1. Increasing Trend of Consuming Cocktails; Rising Demand for Premium Spirits
- 3.3. Market Restrains
- 3.3.1. Affordability of the Product is Restraining the Market's Growth
- 3.4. Market Trends
- 3.4.1. Growing Influence of Healthy Lifestyle Trends and Rising Number of Non-Traditional Users
- 4. Market Factor Analysis
- 4.1. Porters Five Forces
- 4.2. Supply/Value Chain
- 4.3. PESTEL analysis
- 4.4. Market Entropy
- 4.5. Patent/Trademark Analysis
- 5. Global Pre Workout Supplements Industry Analysis, Insights and Forecast, 2019-2031
- 5.1. Market Analysis, Insights and Forecast - by Type
- 5.1.1. Powder
- 5.1.2. Capsule/ Tablet
- 5.1.3. Drinks
- 5.1.4. Other Types
- 5.2. Market Analysis, Insights and Forecast - by Distribution Channel
- 5.2.1. Hypermarket/Supermarket
- 5.2.2. Specialty Stores
- 5.2.3. Online Retail Stores
- 5.2.4. Other Distribution Channels
- 5.3. Market Analysis, Insights and Forecast - by Region
- 5.3.1. North America
- 5.3.2. Europe
- 5.3.3. Asia Pacific
- 5.3.4. South America
- 5.3.5. Middle East and Africa
- 5.1. Market Analysis, Insights and Forecast - by Type
- 6. North America Pre Workout Supplements Industry Analysis, Insights and Forecast, 2019-2031
- 6.1. Market Analysis, Insights and Forecast - by Type
- 6.1.1. Powder
- 6.1.2. Capsule/ Tablet
- 6.1.3. Drinks
- 6.1.4. Other Types
- 6.2. Market Analysis, Insights and Forecast - by Distribution Channel
- 6.2.1. Hypermarket/Supermarket
- 6.2.2. Specialty Stores
- 6.2.3. Online Retail Stores
- 6.2.4. Other Distribution Channels
- 6.1. Market Analysis, Insights and Forecast - by Type
- 7. Europe Pre Workout Supplements Industry Analysis, Insights and Forecast, 2019-2031
- 7.1. Market Analysis, Insights and Forecast - by Type
- 7.1.1. Powder
- 7.1.2. Capsule/ Tablet
- 7.1.3. Drinks
- 7.1.4. Other Types
- 7.2. Market Analysis, Insights and Forecast - by Distribution Channel
- 7.2.1. Hypermarket/Supermarket
- 7.2.2. Specialty Stores
- 7.2.3. Online Retail Stores
- 7.2.4. Other Distribution Channels
- 7.1. Market Analysis, Insights and Forecast - by Type
- 8. Asia Pacific Pre Workout Supplements Industry Analysis, Insights and Forecast, 2019-2031
- 8.1. Market Analysis, Insights and Forecast - by Type
- 8.1.1. Powder
- 8.1.2. Capsule/ Tablet
- 8.1.3. Drinks
- 8.1.4. Other Types
- 8.2. Market Analysis, Insights and Forecast - by Distribution Channel
- 8.2.1. Hypermarket/Supermarket
- 8.2.2. Specialty Stores
- 8.2.3. Online Retail Stores
- 8.2.4. Other Distribution Channels
- 8.1. Market Analysis, Insights and Forecast - by Type
- 9. South America Pre Workout Supplements Industry Analysis, Insights and Forecast, 2019-2031
- 9.1. Market Analysis, Insights and Forecast - by Type
- 9.1.1. Powder
- 9.1.2. Capsule/ Tablet
- 9.1.3. Drinks
- 9.1.4. Other Types
- 9.2. Market Analysis, Insights and Forecast - by Distribution Channel
- 9.2.1. Hypermarket/Supermarket
- 9.2.2. Specialty Stores
- 9.2.3. Online Retail Stores
- 9.2.4. Other Distribution Channels
- 9.1. Market Analysis, Insights and Forecast - by Type
- 10. Middle East and Africa Pre Workout Supplements Industry Analysis, Insights and Forecast, 2019-2031
- 10.1. Market Analysis, Insights and Forecast - by Type
- 10.1.1. Powder
- 10.1.2. Capsule/ Tablet
- 10.1.3. Drinks
- 10.1.4. Other Types
- 10.2. Market Analysis, Insights and Forecast - by Distribution Channel
- 10.2.1. Hypermarket/Supermarket
- 10.2.2. Specialty Stores
- 10.2.3. Online Retail Stores
- 10.2.4. Other Distribution Channels
- 10.1. Market Analysis, Insights and Forecast - by Type
- 11. North America Pre Workout Supplements Industry Analysis, Insights and Forecast, 2019-2031
- 11.1. Market Analysis, Insights and Forecast - By Country/Sub-region
- 11.1.1 United States
- 11.1.2 Canada
- 11.1.3 Mexico
- 11.1.4 Rest of North America
- 12. Europe Pre Workout Supplements Industry Analysis, Insights and Forecast, 2019-2031
- 12.1. Market Analysis, Insights and Forecast - By Country/Sub-region
- 12.1.1 Spain
- 12.1.2 United Kingdom
- 12.1.3 Germany
- 12.1.4 France
- 12.1.5 Italy
- 12.1.6 Russia
- 12.1.7 Rest of Europe
- 13. Asia Pacific Pre Workout Supplements Industry Analysis, Insights and Forecast, 2019-2031
- 13.1. Market Analysis, Insights and Forecast - By Country/Sub-region
- 13.1.1 China
- 13.1.2 Japan
- 13.1.3 India
- 13.1.4 Australia
- 13.1.5 Rest of Asia Pacific
- 14. South America Pre Workout Supplements Industry Analysis, Insights and Forecast, 2019-2031
- 14.1. Market Analysis, Insights and Forecast - By Country/Sub-region
- 14.1.1 Brazil
- 14.1.2 Argentina
- 14.1.3 Rest of South America
- 15. Middle East and Africa Pre Workout Supplements Industry Analysis, Insights and Forecast, 2019-2031
- 15.1. Market Analysis, Insights and Forecast - By Country/Sub-region
- 15.1.1 United Arab Emirates
- 15.1.2 South Africa
- 15.1.3 Rest of Middle East and Africa
- 16. Competitive Analysis
- 16.1. Global Market Share Analysis 2024
- 16.2. Company Profiles
- 16.2.1 BioTech USA Kft
- 16.2.1.1. Overview
- 16.2.1.2. Products
- 16.2.1.3. SWOT Analysis
- 16.2.1.4. Recent Developments
- 16.2.1.5. Financials (Based on Availability)
- 16.2.2 Herbalife Nutrition Ltd
- 16.2.2.1. Overview
- 16.2.2.2. Products
- 16.2.2.3. SWOT Analysis
- 16.2.2.4. Recent Developments
- 16.2.2.5. Financials (Based on Availability)
- 16.2.3 Amway Corporation
- 16.2.3.1. Overview
- 16.2.3.2. Products
- 16.2.3.3. SWOT Analysis
- 16.2.3.4. Recent Developments
- 16.2.3.5. Financials (Based on Availability)
- 16.2.4 Abbott Laboratories
- 16.2.4.1. Overview
- 16.2.4.2. Products
- 16.2.4.3. SWOT Analysis
- 16.2.4.4. Recent Developments
- 16.2.4.5. Financials (Based on Availability)
- 16.2.5 Glanbia PLC
- 16.2.5.1. Overview
- 16.2.5.2. Products
- 16.2.5.3. SWOT Analysis
- 16.2.5.4. Recent Developments
- 16.2.5.5. Financials (Based on Availability)
- 16.2.6 Nutrex Research Inc *List Not Exhaustive
- 16.2.6.1. Overview
- 16.2.6.2. Products
- 16.2.6.3. SWOT Analysis
- 16.2.6.4. Recent Developments
- 16.2.6.5. Financials (Based on Availability)
- 16.2.7 MusclePharm Corporation
- 16.2.7.1. Overview
- 16.2.7.2. Products
- 16.2.7.3. SWOT Analysis
- 16.2.7.4. Recent Developments
- 16.2.7.5. Financials (Based on Availability)
- 16.2.8 QNT SA
- 16.2.8.1. Overview
- 16.2.8.2. Products
- 16.2.8.3. SWOT Analysis
- 16.2.8.4. Recent Developments
- 16.2.8.5. Financials (Based on Availability)
- 16.2.9 Bulk
- 16.2.9.1. Overview
- 16.2.9.2. Products
- 16.2.9.3. SWOT Analysis
- 16.2.9.4. Recent Developments
- 16.2.9.5. Financials (Based on Availability)
- 16.2.10 Nutrabolt
- 16.2.10.1. Overview
- 16.2.10.2. Products
- 16.2.10.3. SWOT Analysis
- 16.2.10.4. Recent Developments
- 16.2.10.5. Financials (Based on Availability)
- 16.2.1 BioTech USA Kft
List of Figures
- Figure 1: Global Pre Workout Supplements Industry Revenue Breakdown (Million, %) by Region 2024 & 2032
- Figure 2: North America Pre Workout Supplements Industry Revenue (Million), by Country 2024 & 2032
- Figure 3: North America Pre Workout Supplements Industry Revenue Share (%), by Country 2024 & 2032
- Figure 4: Europe Pre Workout Supplements Industry Revenue (Million), by Country 2024 & 2032
- Figure 5: Europe Pre Workout Supplements Industry Revenue Share (%), by Country 2024 & 2032
- Figure 6: Asia Pacific Pre Workout Supplements Industry Revenue (Million), by Country 2024 & 2032
- Figure 7: Asia Pacific Pre Workout Supplements Industry Revenue Share (%), by Country 2024 & 2032
- Figure 8: South America Pre Workout Supplements Industry Revenue (Million), by Country 2024 & 2032
- Figure 9: South America Pre Workout Supplements Industry Revenue Share (%), by Country 2024 & 2032
- Figure 10: Middle East and Africa Pre Workout Supplements Industry Revenue (Million), by Country 2024 & 2032
- Figure 11: Middle East and Africa Pre Workout Supplements Industry Revenue Share (%), by Country 2024 & 2032
- Figure 12: North America Pre Workout Supplements Industry Revenue (Million), by Type 2024 & 2032
- Figure 13: North America Pre Workout Supplements Industry Revenue Share (%), by Type 2024 & 2032
- Figure 14: North America Pre Workout Supplements Industry Revenue (Million), by Distribution Channel 2024 & 2032
- Figure 15: North America Pre Workout Supplements Industry Revenue Share (%), by Distribution Channel 2024 & 2032
- Figure 16: North America Pre Workout Supplements Industry Revenue (Million), by Country 2024 & 2032
- Figure 17: North America Pre Workout Supplements Industry Revenue Share (%), by Country 2024 & 2032
- Figure 18: Europe Pre Workout Supplements Industry Revenue (Million), by Type 2024 & 2032
- Figure 19: Europe Pre Workout Supplements Industry Revenue Share (%), by Type 2024 & 2032
- Figure 20: Europe Pre Workout Supplements Industry Revenue (Million), by Distribution Channel 2024 & 2032
- Figure 21: Europe Pre Workout Supplements Industry Revenue Share (%), by Distribution Channel 2024 & 2032
- Figure 22: Europe Pre Workout Supplements Industry Revenue (Million), by Country 2024 & 2032
- Figure 23: Europe Pre Workout Supplements Industry Revenue Share (%), by Country 2024 & 2032
- Figure 24: Asia Pacific Pre Workout Supplements Industry Revenue (Million), by Type 2024 & 2032
- Figure 25: Asia Pacific Pre Workout Supplements Industry Revenue Share (%), by Type 2024 & 2032
- Figure 26: Asia Pacific Pre Workout Supplements Industry Revenue (Million), by Distribution Channel 2024 & 2032
- Figure 27: Asia Pacific Pre Workout Supplements Industry Revenue Share (%), by Distribution Channel 2024 & 2032
- Figure 28: Asia Pacific Pre Workout Supplements Industry Revenue (Million), by Country 2024 & 2032
- Figure 29: Asia Pacific Pre Workout Supplements Industry Revenue Share (%), by Country 2024 & 2032
- Figure 30: South America Pre Workout Supplements Industry Revenue (Million), by Type 2024 & 2032
- Figure 31: South America Pre Workout Supplements Industry Revenue Share (%), by Type 2024 & 2032
- Figure 32: South America Pre Workout Supplements Industry Revenue (Million), by Distribution Channel 2024 & 2032
- Figure 33: South America Pre Workout Supplements Industry Revenue Share (%), by Distribution Channel 2024 & 2032
- Figure 34: South America Pre Workout Supplements Industry Revenue (Million), by Country 2024 & 2032
- Figure 35: South America Pre Workout Supplements Industry Revenue Share (%), by Country 2024 & 2032
- Figure 36: Middle East and Africa Pre Workout Supplements Industry Revenue (Million), by Type 2024 & 2032
- Figure 37: Middle East and Africa Pre Workout Supplements Industry Revenue Share (%), by Type 2024 & 2032
- Figure 38: Middle East and Africa Pre Workout Supplements Industry Revenue (Million), by Distribution Channel 2024 & 2032
- Figure 39: Middle East and Africa Pre Workout Supplements Industry Revenue Share (%), by Distribution Channel 2024 & 2032
- Figure 40: Middle East and Africa Pre Workout Supplements Industry Revenue (Million), by Country 2024 & 2032
- Figure 41: Middle East and Africa Pre Workout Supplements Industry Revenue Share (%), by Country 2024 & 2032
List of Tables
- Table 1: Global Pre Workout Supplements Industry Revenue Million Forecast, by Region 2019 & 2032
- Table 2: Global Pre Workout Supplements Industry Revenue Million Forecast, by Type 2019 & 2032
- Table 3: Global Pre Workout Supplements Industry Revenue Million Forecast, by Distribution Channel 2019 & 2032
- Table 4: Global Pre Workout Supplements Industry Revenue Million Forecast, by Region 2019 & 2032
- Table 5: Global Pre Workout Supplements Industry Revenue Million Forecast, by Country 2019 & 2032
- Table 6: United States Pre Workout Supplements Industry Revenue (Million) Forecast, by Application 2019 & 2032
- Table 7: Canada Pre Workout Supplements Industry Revenue (Million) Forecast, by Application 2019 & 2032
- Table 8: Mexico Pre Workout Supplements Industry Revenue (Million) Forecast, by Application 2019 & 2032
- Table 9: Rest of North America Pre Workout Supplements Industry Revenue (Million) Forecast, by Application 2019 & 2032
- Table 10: Global Pre Workout Supplements Industry Revenue Million Forecast, by Country 2019 & 2032
- Table 11: Spain Pre Workout Supplements Industry Revenue (Million) Forecast, by Application 2019 & 2032
- Table 12: United Kingdom Pre Workout Supplements Industry Revenue (Million) Forecast, by Application 2019 & 2032
- Table 13: Germany Pre Workout Supplements Industry Revenue (Million) Forecast, by Application 2019 & 2032
- Table 14: France Pre Workout Supplements Industry Revenue (Million) Forecast, by Application 2019 & 2032
- Table 15: Italy Pre Workout Supplements Industry Revenue (Million) Forecast, by Application 2019 & 2032
- Table 16: Russia Pre Workout Supplements Industry Revenue (Million) Forecast, by Application 2019 & 2032
- Table 17: Rest of Europe Pre Workout Supplements Industry Revenue (Million) Forecast, by Application 2019 & 2032
- Table 18: Global Pre Workout Supplements Industry Revenue Million Forecast, by Country 2019 & 2032
- Table 19: China Pre Workout Supplements Industry Revenue (Million) Forecast, by Application 2019 & 2032
- Table 20: Japan Pre Workout Supplements Industry Revenue (Million) Forecast, by Application 2019 & 2032
- Table 21: India Pre Workout Supplements Industry Revenue (Million) Forecast, by Application 2019 & 2032
- Table 22: Australia Pre Workout Supplements Industry Revenue (Million) Forecast, by Application 2019 & 2032
- Table 23: Rest of Asia Pacific Pre Workout Supplements Industry Revenue (Million) Forecast, by Application 2019 & 2032
- Table 24: Global Pre Workout Supplements Industry Revenue Million Forecast, by Country 2019 & 2032
- Table 25: Brazil Pre Workout Supplements Industry Revenue (Million) Forecast, by Application 2019 & 2032
- Table 26: Argentina Pre Workout Supplements Industry Revenue (Million) Forecast, by Application 2019 & 2032
- Table 27: Rest of South America Pre Workout Supplements Industry Revenue (Million) Forecast, by Application 2019 & 2032
- Table 28: Global Pre Workout Supplements Industry Revenue Million Forecast, by Country 2019 & 2032
- Table 29: United Arab Emirates Pre Workout Supplements Industry Revenue (Million) Forecast, by Application 2019 & 2032
- Table 30: South Africa Pre Workout Supplements Industry Revenue (Million) Forecast, by Application 2019 & 2032
- Table 31: Rest of Middle East and Africa Pre Workout Supplements Industry Revenue (Million) Forecast, by Application 2019 & 2032
- Table 32: Global Pre Workout Supplements Industry Revenue Million Forecast, by Type 2019 & 2032
- Table 33: Global Pre Workout Supplements Industry Revenue Million Forecast, by Distribution Channel 2019 & 2032
- Table 34: Global Pre Workout Supplements Industry Revenue Million Forecast, by Country 2019 & 2032
- Table 35: United States Pre Workout Supplements Industry Revenue (Million) Forecast, by Application 2019 & 2032
- Table 36: Canada Pre Workout Supplements Industry Revenue (Million) Forecast, by Application 2019 & 2032
- Table 37: Mexico Pre Workout Supplements Industry Revenue (Million) Forecast, by Application 2019 & 2032
- Table 38: Rest of North America Pre Workout Supplements Industry Revenue (Million) Forecast, by Application 2019 & 2032
- Table 39: Global Pre Workout Supplements Industry Revenue Million Forecast, by Type 2019 & 2032
- Table 40: Global Pre Workout Supplements Industry Revenue Million Forecast, by Distribution Channel 2019 & 2032
- Table 41: Global Pre Workout Supplements Industry Revenue Million Forecast, by Country 2019 & 2032
- Table 42: Spain Pre Workout Supplements Industry Revenue (Million) Forecast, by Application 2019 & 2032
- Table 43: United Kingdom Pre Workout Supplements Industry Revenue (Million) Forecast, by Application 2019 & 2032
- Table 44: Germany Pre Workout Supplements Industry Revenue (Million) Forecast, by Application 2019 & 2032
- Table 45: France Pre Workout Supplements Industry Revenue (Million) Forecast, by Application 2019 & 2032
- Table 46: Italy Pre Workout Supplements Industry Revenue (Million) Forecast, by Application 2019 & 2032
- Table 47: Russia Pre Workout Supplements Industry Revenue (Million) Forecast, by Application 2019 & 2032
- Table 48: Rest of Europe Pre Workout Supplements Industry Revenue (Million) Forecast, by Application 2019 & 2032
- Table 49: Global Pre Workout Supplements Industry Revenue Million Forecast, by Type 2019 & 2032
- Table 50: Global Pre Workout Supplements Industry Revenue Million Forecast, by Distribution Channel 2019 & 2032
- Table 51: Global Pre Workout Supplements Industry Revenue Million Forecast, by Country 2019 & 2032
- Table 52: China Pre Workout Supplements Industry Revenue (Million) Forecast, by Application 2019 & 2032
- Table 53: Japan Pre Workout Supplements Industry Revenue (Million) Forecast, by Application 2019 & 2032
- Table 54: India Pre Workout Supplements Industry Revenue (Million) Forecast, by Application 2019 & 2032
- Table 55: Australia Pre Workout Supplements Industry Revenue (Million) Forecast, by Application 2019 & 2032
- Table 56: Rest of Asia Pacific Pre Workout Supplements Industry Revenue (Million) Forecast, by Application 2019 & 2032
- Table 57: Global Pre Workout Supplements Industry Revenue Million Forecast, by Type 2019 & 2032
- Table 58: Global Pre Workout Supplements Industry Revenue Million Forecast, by Distribution Channel 2019 & 2032
- Table 59: Global Pre Workout Supplements Industry Revenue Million Forecast, by Country 2019 & 2032
- Table 60: Brazil Pre Workout Supplements Industry Revenue (Million) Forecast, by Application 2019 & 2032
- Table 61: Argentina Pre Workout Supplements Industry Revenue (Million) Forecast, by Application 2019 & 2032
- Table 62: Rest of South America Pre Workout Supplements Industry Revenue (Million) Forecast, by Application 2019 & 2032
- Table 63: Global Pre Workout Supplements Industry Revenue Million Forecast, by Type 2019 & 2032
- Table 64: Global Pre Workout Supplements Industry Revenue Million Forecast, by Distribution Channel 2019 & 2032
- Table 65: Global Pre Workout Supplements Industry Revenue Million Forecast, by Country 2019 & 2032
- Table 66: United Arab Emirates Pre Workout Supplements Industry Revenue (Million) Forecast, by Application 2019 & 2032
- Table 67: South Africa Pre Workout Supplements Industry Revenue (Million) Forecast, by Application 2019 & 2032
- Table 68: Rest of Middle East and Africa Pre Workout Supplements Industry Revenue (Million) Forecast, by Application 2019 & 2032
Frequently Asked Questions
1. What is the projected Compound Annual Growth Rate (CAGR) of the Pre Workout Supplements Industry?
The projected CAGR is approximately 4.78%.
2. Which companies are prominent players in the Pre Workout Supplements Industry?
Key companies in the market include BioTech USA Kft, Herbalife Nutrition Ltd, Amway Corporation, Abbott Laboratories, Glanbia PLC, Nutrex Research Inc *List Not Exhaustive, MusclePharm Corporation, QNT SA, Bulk, Nutrabolt.
3. What are the main segments of the Pre Workout Supplements Industry?
The market segments include Type, Distribution Channel.
4. Can you provide details about the market size?
The market size is estimated to be USD 20.05 Million as of 2022.
5. What are some drivers contributing to market growth?
Increasing Trend of Consuming Cocktails; Rising Demand for Premium Spirits.
6. What are the notable trends driving market growth?
Growing Influence of Healthy Lifestyle Trends and Rising Number of Non-Traditional Users.
7. Are there any restraints impacting market growth?
Affordability of the Product is Restraining the Market's Growth.
8. Can you provide examples of recent developments in the market?
N/A
9. What pricing options are available for accessing the report?
Pricing options include single-user, multi-user, and enterprise licenses priced at USD 4750, USD 5250, and USD 8750 respectively.
10. Is the market size provided in terms of value or volume?
The market size is provided in terms of value, measured in Million.
11. Are there any specific market keywords associated with the report?
Yes, the market keyword associated with the report is "Pre Workout Supplements Industry," which aids in identifying and referencing the specific market segment covered.
12. How do I determine which pricing option suits my needs best?
The pricing options vary based on user requirements and access needs. Individual users may opt for single-user licenses, while businesses requiring broader access may choose multi-user or enterprise licenses for cost-effective access to the report.
13. Are there any additional resources or data provided in the Pre Workout Supplements Industry report?
While the report offers comprehensive insights, it's advisable to review the specific contents or supplementary materials provided to ascertain if additional resources or data are available.
14. How can I stay updated on further developments or reports in the Pre Workout Supplements Industry?
To stay informed about further developments, trends, and reports in the Pre Workout Supplements Industry, consider subscribing to industry newsletters, following relevant companies and organizations, or regularly checking reputable industry news sources and publications.
Methodology
Step 1 - Identification of Relevant Samples Size from Population Database


Step 2 - Approaches for Defining Global Market Size (Value, Volume* & Price*)

Note*: In applicable scenarios
Step 3 - Data Sources
Primary Research
- Web Analytics
- Survey Reports
- Research Institute
- Latest Research Reports
- Opinion Leaders
Secondary Research
- Annual Reports
- White Paper
- Latest Press Release
- Industry Association
- Paid Database
- Investor Presentations

Step 4 - Data Triangulation
Involves using different sources of information in order to increase the validity of a study
These sources are likely to be stakeholders in a program - participants, other researchers, program staff, other community members, and so on.
Then we put all data in single framework & apply various statistical tools to find out the dynamic on the market.
During the analysis stage, feedback from the stakeholder groups would be compared to determine areas of agreement as well as areas of divergence
