

Key Insights
The global Physical Therapy Rehabilitation Solutions market is poised for substantial growth, projected to reach an estimated $12.68 billion by 2025, driven by an anticipated Compound Annual Growth Rate (CAGR) of 6.22% from 2025 to 2033. This expansion is fueled by a confluence of factors, including the increasing prevalence of chronic diseases, a growing aging population demanding rehabilitation services, and advancements in digital health technologies that enhance patient outcomes and accessibility. Key applications such as hip joint, knee joint, and spinal cord injury rehabilitation are experiencing significant demand, supported by a broad spectrum of healthcare providers including hospitals, physiotherapy clinics, and emerging homecare and rehabilitation centers. The rising awareness of the benefits of physical therapy in managing pain, improving mobility, and accelerating recovery post-surgery or injury is a significant catalyst for market penetration.
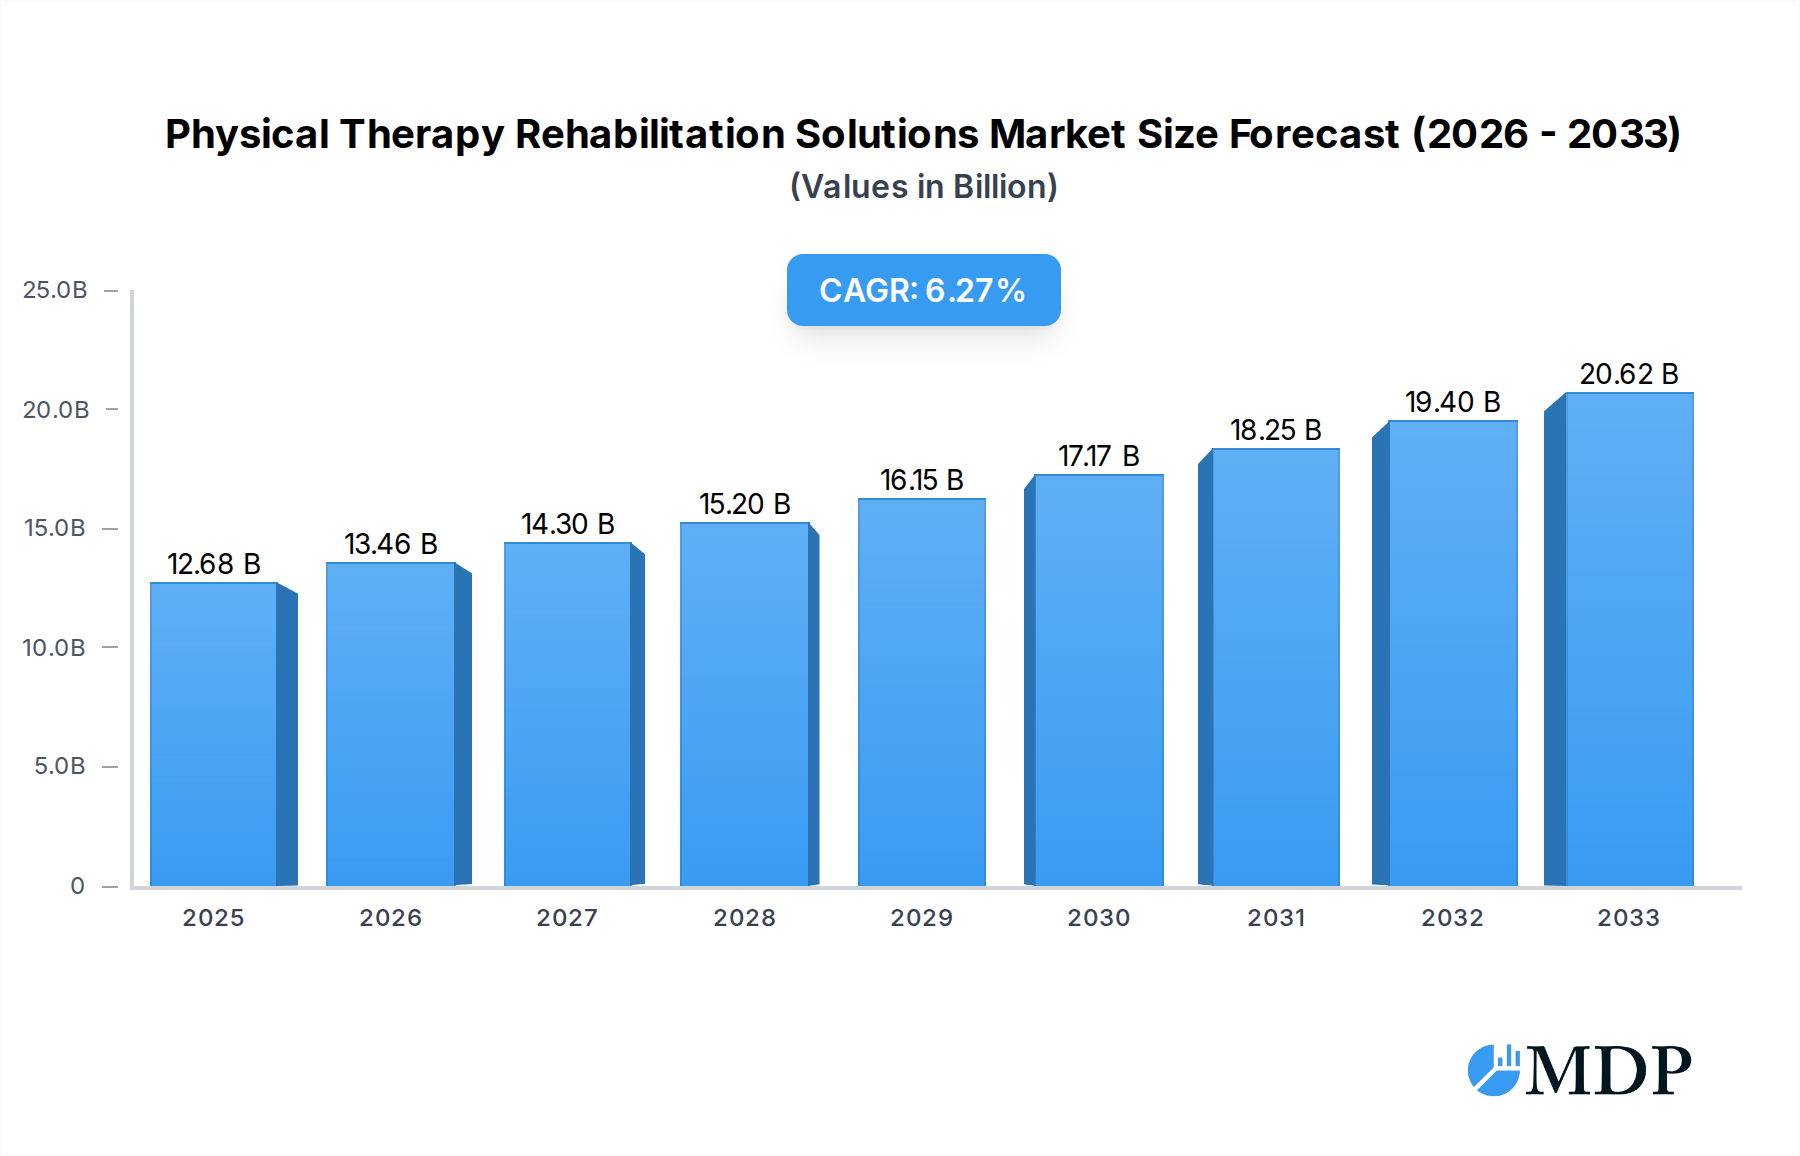
Physical Therapy Rehabilitation Solutions Market Size (In Billion)
Furthermore, the market is witnessing a strong trend towards integrated care models and the adoption of telehealth and remote monitoring solutions, offering greater convenience and personalized treatment plans. While the market benefits from strong drivers, potential restraints such as reimbursement challenges and the initial cost of advanced rehabilitation equipment may moderate growth in certain segments. However, strategic collaborations between technology providers and healthcare institutions, coupled with increasing investment in research and development for innovative rehabilitation techniques and devices, are expected to mitigate these challenges. The competitive landscape features established players and innovative startups, all vying to capture market share through product differentiation, strategic partnerships, and geographic expansion, particularly in rapidly developing regions across Asia Pacific and Europe.

Physical Therapy Rehabilitation Solutions Company Market Share
This comprehensive report offers an in-depth analysis of the global Physical Therapy Rehabilitation Solutions market, providing critical insights for industry stakeholders. Covering a study period from 2019 to 2033, with a base year of 2025 and a forecast period extending to 2033, this report delves into market dynamics, industry trends, leading segments, product developments, growth drivers, challenges, emerging opportunities, key players, historical milestones, and a strategic outlook. The market is projected to reach a valuation of several billion dollars, driven by an increasing prevalence of chronic conditions, an aging global population, and advancements in digital health technologies.
Physical Therapy Rehabilitation Solutions Market Dynamics & Concentration
The Physical Therapy Rehabilitation Solutions market exhibits a moderate to high level of concentration, with a blend of established corporations and emerging innovators. Key innovation drivers include the integration of artificial intelligence (AI) and machine learning (ML) for personalized treatment plans, the development of advanced robotic-assisted therapy systems, and the rise of telehealth platforms that enhance accessibility and patient engagement. Regulatory frameworks, such as those overseen by the FDA and EMA, are evolving to accommodate digital health solutions, requiring rigorous validation and data privacy standards. Product substitutes, while present in traditional therapy methods, are increasingly being enhanced by technological integration. End-user trends are leaning towards home-based rehabilitation, remote monitoring, and patient-centric care models, fueled by convenience and cost-effectiveness. Merger and acquisition (M&A) activities are a significant factor shaping market concentration. Over the historical period (2019-2024), there were approximately 150 M&A deals, with estimated deal values reaching upwards of $20 billion. Leading companies like Cerner Corporation, eviCore Healthcare, and Smith and Nephew are actively involved in strategic acquisitions to expand their portfolios and market reach. The market share of the top five players is estimated to be around 35%, with considerable growth potential for specialized solution providers.
Physical Therapy Rehabilitation Solutions Industry Trends & Analysis
The Physical Therapy Rehabilitation Solutions industry is experiencing robust growth, driven by a confluence of technological advancements and evolving healthcare paradigms. The global market size is projected to surge from an estimated $25 billion in 2025 to over $70 billion by 2033, exhibiting a Compound Annual Growth Rate (CAGR) of approximately 10.5%. Technological disruptions are at the forefront, with the integration of AI-powered analytics enabling predictive modeling for patient recovery trajectories, virtual reality (VR) and augmented reality (AR) creating immersive therapeutic environments, and wearable sensors providing continuous, objective data on patient progress. These innovations are not only enhancing the efficacy of rehabilitation but also improving patient adherence and engagement, crucial for successful outcomes. Consumer preferences are shifting towards more personalized, convenient, and accessible rehabilitation services. The increasing prevalence of chronic diseases such as diabetes, cardiovascular conditions, and neurological disorders, coupled with an aging global population susceptible to musculoskeletal injuries and age-related mobility issues, further fuels demand. The market penetration of digital rehabilitation solutions is rapidly increasing, particularly in developed economies, as healthcare providers and payers recognize their potential for cost savings and improved patient satisfaction. Competitive dynamics are characterized by a growing emphasis on integrated care pathways, where rehabilitation solutions are seamlessly incorporated into broader healthcare ecosystems. Companies are investing heavily in R&D to develop sophisticated yet user-friendly platforms that cater to diverse patient needs across various therapeutic applications. The increasing adoption of remote patient monitoring and telehealth services is a significant trend, allowing for continuous supervision and intervention, reducing the need for frequent in-person visits and thereby expanding the reach of physical therapy services. The market penetration for advanced rehabilitation solutions is expected to exceed 40% by 2033, with a substantial portion of this growth attributed to these technological integrations and shifting consumer preferences.
Leading Markets & Segments in Physical Therapy Rehabilitation Solutions
The Physical Therapy Rehabilitation Solutions market demonstrates significant dominance in North America, with the United States leading due to its advanced healthcare infrastructure, high adoption rate of new technologies, and substantial investment in healthcare R&D. The economic policies promoting technological innovation and robust reimbursement frameworks for rehabilitation services contribute to this leadership. Asia Pacific, particularly China and India, presents a rapidly growing market, driven by increasing healthcare expenditure, a large patient pool, and a growing awareness of the benefits of physical therapy.
Dominant Applications:
- Knee Joint: This segment holds a substantial market share due to the high incidence of knee injuries in sports, work-related accidents, and age-related osteoarthritis. Economic policies encouraging active lifestyles and advancements in knee replacement surgeries necessitate comprehensive post-operative rehabilitation.
- Spinal Cord Injuries: Driven by technological advancements in assistive devices and neurorehabilitation techniques, this segment is witnessing significant growth. Government organizations and dedicated research institutions are investing heavily in finding solutions for spinal cord injury recovery.
- Hip Joint: Similar to the knee joint, the prevalence of hip osteoarthritis and fractures in the aging population makes this a critical segment. The development of advanced prosthetic and rehabilitation technologies further boosts its importance.
- Shoulder & Elbow Joint: Sports-related injuries and overuse syndromes contribute to the steady demand in this segment, with technological innovations offering new avenues for effective treatment.
- Forearm and Wrist Joint: This segment benefits from the increasing prevalence of repetitive strain injuries due to prolonged computer use and technological advancements in hand and wrist rehabilitation.
Dominant Types of End-Users:
- Hospitals: As primary healthcare providers, hospitals are significant adopters of physical therapy rehabilitation solutions, offering comprehensive inpatient and outpatient services. Their infrastructure and established patient referral networks drive demand.
- Physiotherapy Clinics: These specialized centers are core users, focusing exclusively on rehabilitation. The growth of independent clinics and their increasing adoption of advanced technologies are key drivers.
- Homecare and Rehabilitation Centers: The shift towards home-based care and dedicated rehabilitation facilities, driven by patient preference for comfort and convenience, makes this segment a major growth area.
- Healthcare Integrated Delivery Networks (IDNs): IDNs are increasingly adopting integrated rehabilitation solutions to manage patient care across different settings, aiming for improved outcomes and cost efficiencies.
- Self-insured Employers: Recognizing the importance of employee well-being and reducing long-term healthcare costs associated with injuries and chronic conditions, self-insured employers are investing in proactive rehabilitation programs.
- Commercial Players: These entities, including insurance providers, are increasingly recognizing the value proposition of effective rehabilitation in reducing overall healthcare expenditure.
- Government Organizations: Public health initiatives and support for veteran rehabilitation programs make government organizations significant purchasers of physical therapy solutions.
- Ambulatory Surgical Centers: Post-surgical rehabilitation protocols are an integral part of services offered by ASCs, driving demand for specialized rehabilitation solutions.
Physical Therapy Rehabilitation Solutions Product Developments
Product innovation in Physical Therapy Rehabilitation Solutions is characterized by the integration of cutting-edge technologies. Companies are developing AI-powered platforms that personalize treatment plans based on real-time patient data, such as those offered by Reflexion Health and Hinge Health Inc. Wearable sensors and smart devices, like those from Mira Rehab Limited and Motekforce Link, are enabling precise motion tracking and progress monitoring. Virtual and augmented reality solutions from Gesturetek Health and CoRehab srl are creating immersive and engaging therapeutic experiences for patients with conditions like spinal cord injuries and stroke. These developments offer significant competitive advantages by improving patient adherence, enhancing treatment efficacy, and providing quantifiable outcome data, ultimately leading to better patient recovery and reduced healthcare costs.
Key Drivers of Physical Therapy Rehabilitation Solutions Growth
The Physical Therapy Rehabilitation Solutions market is propelled by several critical growth drivers. Technologically, the rapid advancements in AI, ML, VR, and AR are revolutionizing treatment methodologies, enabling personalized and engaging rehabilitation programs. Economically, an aging global population with a higher prevalence of chronic conditions and musculoskeletal disorders is creating sustained demand. Furthermore, increasing healthcare expenditure in emerging economies and a growing focus on preventative care and employee wellness by self-insured employers are significant economic stimulants. Regulatory factors, such as favorable reimbursement policies for telehealth and digital health solutions, and a growing emphasis on evidence-based practices, are also critical drivers, ensuring the adoption and integration of innovative rehabilitation technologies within the healthcare ecosystem. The push for value-based care models further incentivizes the adoption of solutions that demonstrate improved patient outcomes and cost-effectiveness.
Challenges in the Physical Therapy Rehabilitation Solutions Market
Despite significant growth potential, the Physical Therapy Rehabilitation Solutions market faces several challenges. Regulatory hurdles persist, with the need for comprehensive validation and approval processes for novel digital health and AI-driven solutions, potentially delaying market entry and increasing development costs. The high initial investment required for advanced rehabilitation technology can be a barrier for smaller clinics and healthcare providers. Cybersecurity concerns and data privacy issues related to sensitive patient information collected by these solutions are paramount and require robust mitigation strategies. Furthermore, the lack of widespread digital literacy among certain patient demographics can hinder the adoption of technologically advanced rehabilitation tools. Competitive pressures from established players and the constant need for innovation to stay ahead also pose challenges, with estimated R&D investment requiring upwards of $5 billion annually for leading companies.
Emerging Opportunities in Physical Therapy Rehabilitation Solutions
Emerging opportunities in the Physical Therapy Rehabilitation Solutions market are abundant and poised to drive long-term growth. The expanding adoption of remote patient monitoring and telehealth platforms presents a significant opportunity to extend rehabilitation services to underserved populations and rural areas, thereby increasing market accessibility. Strategic partnerships between technology providers, healthcare institutions, and insurance companies are crucial for developing integrated care models that demonstrate improved patient outcomes and cost efficiencies. The growing demand for specialized rehabilitation solutions for niche conditions, such as post-COVID-19 recovery and long-term neurological rehabilitation, offers significant market expansion potential. Furthermore, the increasing focus on preventative rehabilitation and wellness programs, driven by both individuals and employers, creates new avenues for service offerings and market penetration, with an estimated $15 billion market for preventative rehabilitation solutions projected by 2033.
Leading Players in the Physical Therapy Rehabilitation Solutions Sector
- Reflexion Health
- AC international East
- Cerner Corporation
- Kareo Inc.
- Therapy Sync
- eviCore Healthcare
- Meditab
- iSalus
- Smith and Nephew
- CoRehab srl
- Hinge Health Inc.
- Sword Health Inc.
- Mira Rehab Limited
- Motekforce Link
- Gesturetek Health
Key Milestones in Physical Therapy Rehabilitation Solutions Industry
- 2019: Increased adoption of AI in predictive analytics for patient recovery.
- 2020: Surge in telehealth and remote patient monitoring solutions due to global health events.
- 2021: FDA clearance for several AI-driven diagnostic and therapeutic tools in rehabilitation.
- 2022: Significant investment in VR/AR based rehabilitation platforms by major tech and healthcare companies.
- 2023: Launch of integrated digital health platforms combining rehabilitation with chronic disease management.
- 2024: Growth in M&A activities targeting innovative start-ups in wearable sensor technology for physical therapy.
Strategic Outlook for Physical Therapy Rehabilitation Solutions Market
The strategic outlook for the Physical Therapy Rehabilitation Solutions market is exceptionally positive, driven by continuous technological innovation and a growing global demand for effective and accessible rehabilitation. The market is expected to witness sustained growth accelerators through the deeper integration of AI and machine learning for hyper-personalized patient journeys and predictive analytics. Expansion into emerging markets, coupled with strategic partnerships that foster integrated care delivery systems, will be crucial for capturing market share. A key focus will remain on developing user-friendly, evidence-based solutions that demonstrably improve patient outcomes while offering cost efficiencies, aligning with the global shift towards value-based healthcare. The increasing recognition of physical therapy's role in preventative care and overall wellness will open new revenue streams and market opportunities.
Physical Therapy Rehabilitation Solutions Segmentation
-
1. Application
- 1.1. Hip Joint
- 1.2. Spinal Cord Injuries
- 1.3. Forearm and Wrist Joint
- 1.4. Shoulder & Elbow Joint
- 1.5. Knee Joint
- 1.6. Others
-
2. Types
- 2.1. Ambulatory Surgical Center
- 2.2. Self-insured Employer
- 2.3. Healthcare Integrated Delivery Network (IDN)
- 2.4. Commercial Player
- 2.5. Government Organization
- 2.6. Physiotherapy Clinics
- 2.7. Hospitals
- 2.8. Homecare and Rehabilitation Centers
Physical Therapy Rehabilitation Solutions Segmentation By Geography
-
1. North America
- 1.1. United States
- 1.2. Canada
- 1.3. Mexico
-
2. South America
- 2.1. Brazil
- 2.2. Argentina
- 2.3. Rest of South America
-
3. Europe
- 3.1. United Kingdom
- 3.2. Germany
- 3.3. France
- 3.4. Italy
- 3.5. Spain
- 3.6. Russia
- 3.7. Benelux
- 3.8. Nordics
- 3.9. Rest of Europe
-
4. Middle East & Africa
- 4.1. Turkey
- 4.2. Israel
- 4.3. GCC
- 4.4. North Africa
- 4.5. South Africa
- 4.6. Rest of Middle East & Africa
-
5. Asia Pacific
- 5.1. China
- 5.2. India
- 5.3. Japan
- 5.4. South Korea
- 5.5. ASEAN
- 5.6. Oceania
- 5.7. Rest of Asia Pacific
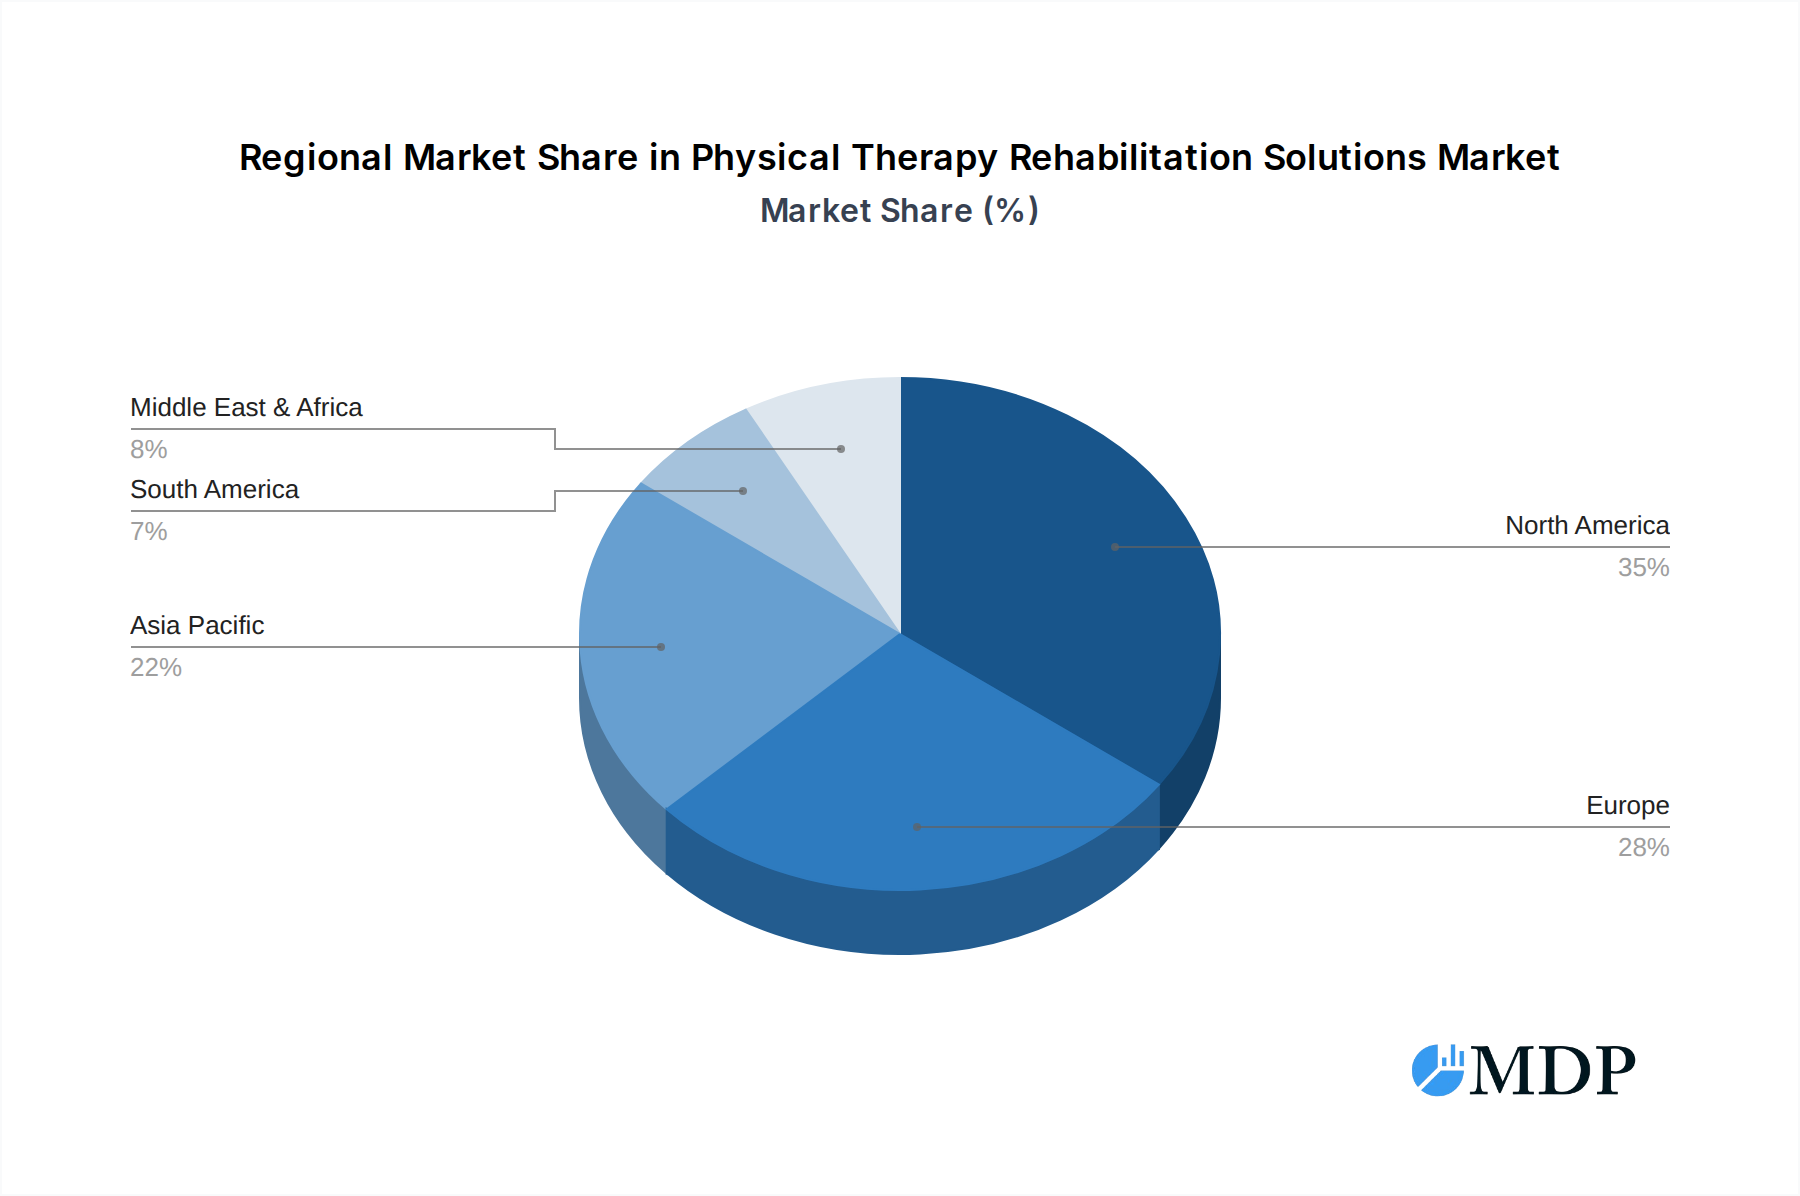
Physical Therapy Rehabilitation Solutions Regional Market Share
Geographic Coverage of Physical Therapy Rehabilitation Solutions
Physical Therapy Rehabilitation Solutions REPORT HIGHLIGHTS
| Aspects | Details |
|---|---|
| Study Period | 2020-2034 |
| Base Year | 2025 |
| Estimated Year | 2026 |
| Forecast Period | 2026-2034 |
| Historical Period | 2020-2025 |
| Growth Rate | CAGR of 6.22% from 2020-2034 |
| Segmentation |
|
Table of Contents
- 1. Introduction
- 1.1. Research Scope
- 1.2. Market Segmentation
- 1.3. Research Methodology
- 1.4. Definitions and Assumptions
- 2. Executive Summary
- 2.1. Introduction
- 3. Market Dynamics
- 3.1. Introduction
- 3.2. Market Drivers
- 3.3. Market Restrains
- 3.4. Market Trends
- 4. Market Factor Analysis
- 4.1. Porters Five Forces
- 4.2. Supply/Value Chain
- 4.3. PESTEL analysis
- 4.4. Market Entropy
- 4.5. Patent/Trademark Analysis
- 5. Global Physical Therapy Rehabilitation Solutions Analysis, Insights and Forecast, 2020-2032
- 5.1. Market Analysis, Insights and Forecast - by Application
- 5.1.1. Hip Joint
- 5.1.2. Spinal Cord Injuries
- 5.1.3. Forearm and Wrist Joint
- 5.1.4. Shoulder & Elbow Joint
- 5.1.5. Knee Joint
- 5.1.6. Others
- 5.2. Market Analysis, Insights and Forecast - by Types
- 5.2.1. Ambulatory Surgical Center
- 5.2.2. Self-insured Employer
- 5.2.3. Healthcare Integrated Delivery Network (IDN)
- 5.2.4. Commercial Player
- 5.2.5. Government Organization
- 5.2.6. Physiotherapy Clinics
- 5.2.7. Hospitals
- 5.2.8. Homecare and Rehabilitation Centers
- 5.3. Market Analysis, Insights and Forecast - by Region
- 5.3.1. North America
- 5.3.2. South America
- 5.3.3. Europe
- 5.3.4. Middle East & Africa
- 5.3.5. Asia Pacific
- 5.1. Market Analysis, Insights and Forecast - by Application
- 6. North America Physical Therapy Rehabilitation Solutions Analysis, Insights and Forecast, 2020-2032
- 6.1. Market Analysis, Insights and Forecast - by Application
- 6.1.1. Hip Joint
- 6.1.2. Spinal Cord Injuries
- 6.1.3. Forearm and Wrist Joint
- 6.1.4. Shoulder & Elbow Joint
- 6.1.5. Knee Joint
- 6.1.6. Others
- 6.2. Market Analysis, Insights and Forecast - by Types
- 6.2.1. Ambulatory Surgical Center
- 6.2.2. Self-insured Employer
- 6.2.3. Healthcare Integrated Delivery Network (IDN)
- 6.2.4. Commercial Player
- 6.2.5. Government Organization
- 6.2.6. Physiotherapy Clinics
- 6.2.7. Hospitals
- 6.2.8. Homecare and Rehabilitation Centers
- 6.1. Market Analysis, Insights and Forecast - by Application
- 7. South America Physical Therapy Rehabilitation Solutions Analysis, Insights and Forecast, 2020-2032
- 7.1. Market Analysis, Insights and Forecast - by Application
- 7.1.1. Hip Joint
- 7.1.2. Spinal Cord Injuries
- 7.1.3. Forearm and Wrist Joint
- 7.1.4. Shoulder & Elbow Joint
- 7.1.5. Knee Joint
- 7.1.6. Others
- 7.2. Market Analysis, Insights and Forecast - by Types
- 7.2.1. Ambulatory Surgical Center
- 7.2.2. Self-insured Employer
- 7.2.3. Healthcare Integrated Delivery Network (IDN)
- 7.2.4. Commercial Player
- 7.2.5. Government Organization
- 7.2.6. Physiotherapy Clinics
- 7.2.7. Hospitals
- 7.2.8. Homecare and Rehabilitation Centers
- 7.1. Market Analysis, Insights and Forecast - by Application
- 8. Europe Physical Therapy Rehabilitation Solutions Analysis, Insights and Forecast, 2020-2032
- 8.1. Market Analysis, Insights and Forecast - by Application
- 8.1.1. Hip Joint
- 8.1.2. Spinal Cord Injuries
- 8.1.3. Forearm and Wrist Joint
- 8.1.4. Shoulder & Elbow Joint
- 8.1.5. Knee Joint
- 8.1.6. Others
- 8.2. Market Analysis, Insights and Forecast - by Types
- 8.2.1. Ambulatory Surgical Center
- 8.2.2. Self-insured Employer
- 8.2.3. Healthcare Integrated Delivery Network (IDN)
- 8.2.4. Commercial Player
- 8.2.5. Government Organization
- 8.2.6. Physiotherapy Clinics
- 8.2.7. Hospitals
- 8.2.8. Homecare and Rehabilitation Centers
- 8.1. Market Analysis, Insights and Forecast - by Application
- 9. Middle East & Africa Physical Therapy Rehabilitation Solutions Analysis, Insights and Forecast, 2020-2032
- 9.1. Market Analysis, Insights and Forecast - by Application
- 9.1.1. Hip Joint
- 9.1.2. Spinal Cord Injuries
- 9.1.3. Forearm and Wrist Joint
- 9.1.4. Shoulder & Elbow Joint
- 9.1.5. Knee Joint
- 9.1.6. Others
- 9.2. Market Analysis, Insights and Forecast - by Types
- 9.2.1. Ambulatory Surgical Center
- 9.2.2. Self-insured Employer
- 9.2.3. Healthcare Integrated Delivery Network (IDN)
- 9.2.4. Commercial Player
- 9.2.5. Government Organization
- 9.2.6. Physiotherapy Clinics
- 9.2.7. Hospitals
- 9.2.8. Homecare and Rehabilitation Centers
- 9.1. Market Analysis, Insights and Forecast - by Application
- 10. Asia Pacific Physical Therapy Rehabilitation Solutions Analysis, Insights and Forecast, 2020-2032
- 10.1. Market Analysis, Insights and Forecast - by Application
- 10.1.1. Hip Joint
- 10.1.2. Spinal Cord Injuries
- 10.1.3. Forearm and Wrist Joint
- 10.1.4. Shoulder & Elbow Joint
- 10.1.5. Knee Joint
- 10.1.6. Others
- 10.2. Market Analysis, Insights and Forecast - by Types
- 10.2.1. Ambulatory Surgical Center
- 10.2.2. Self-insured Employer
- 10.2.3. Healthcare Integrated Delivery Network (IDN)
- 10.2.4. Commercial Player
- 10.2.5. Government Organization
- 10.2.6. Physiotherapy Clinics
- 10.2.7. Hospitals
- 10.2.8. Homecare and Rehabilitation Centers
- 10.1. Market Analysis, Insights and Forecast - by Application
- 11. Competitive Analysis
- 11.1. Global Market Share Analysis 2025
- 11.2. Company Profiles
- 11.2.1 Reflexion Health
- 11.2.1.1. Overview
- 11.2.1.2. Products
- 11.2.1.3. SWOT Analysis
- 11.2.1.4. Recent Developments
- 11.2.1.5. Financials (Based on Availability)
- 11.2.2 AC international East
- 11.2.2.1. Overview
- 11.2.2.2. Products
- 11.2.2.3. SWOT Analysis
- 11.2.2.4. Recent Developments
- 11.2.2.5. Financials (Based on Availability)
- 11.2.3 Cerner Corporation
- 11.2.3.1. Overview
- 11.2.3.2. Products
- 11.2.3.3. SWOT Analysis
- 11.2.3.4. Recent Developments
- 11.2.3.5. Financials (Based on Availability)
- 11.2.4 Kareo Inc.
- 11.2.4.1. Overview
- 11.2.4.2. Products
- 11.2.4.3. SWOT Analysis
- 11.2.4.4. Recent Developments
- 11.2.4.5. Financials (Based on Availability)
- 11.2.5 Therapy Sync
- 11.2.5.1. Overview
- 11.2.5.2. Products
- 11.2.5.3. SWOT Analysis
- 11.2.5.4. Recent Developments
- 11.2.5.5. Financials (Based on Availability)
- 11.2.6 eviCore Healthcare
- 11.2.6.1. Overview
- 11.2.6.2. Products
- 11.2.6.3. SWOT Analysis
- 11.2.6.4. Recent Developments
- 11.2.6.5. Financials (Based on Availability)
- 11.2.7 Meditab
- 11.2.7.1. Overview
- 11.2.7.2. Products
- 11.2.7.3. SWOT Analysis
- 11.2.7.4. Recent Developments
- 11.2.7.5. Financials (Based on Availability)
- 11.2.8 iSalus
- 11.2.8.1. Overview
- 11.2.8.2. Products
- 11.2.8.3. SWOT Analysis
- 11.2.8.4. Recent Developments
- 11.2.8.5. Financials (Based on Availability)
- 11.2.9 Smith and Nephew
- 11.2.9.1. Overview
- 11.2.9.2. Products
- 11.2.9.3. SWOT Analysis
- 11.2.9.4. Recent Developments
- 11.2.9.5. Financials (Based on Availability)
- 11.2.10 CoRehab srl
- 11.2.10.1. Overview
- 11.2.10.2. Products
- 11.2.10.3. SWOT Analysis
- 11.2.10.4. Recent Developments
- 11.2.10.5. Financials (Based on Availability)
- 11.2.11 Hinge Health Inc.
- 11.2.11.1. Overview
- 11.2.11.2. Products
- 11.2.11.3. SWOT Analysis
- 11.2.11.4. Recent Developments
- 11.2.11.5. Financials (Based on Availability)
- 11.2.12 Sword Health Inc.
- 11.2.12.1. Overview
- 11.2.12.2. Products
- 11.2.12.3. SWOT Analysis
- 11.2.12.4. Recent Developments
- 11.2.12.5. Financials (Based on Availability)
- 11.2.13 Mira Rehab Limited
- 11.2.13.1. Overview
- 11.2.13.2. Products
- 11.2.13.3. SWOT Analysis
- 11.2.13.4. Recent Developments
- 11.2.13.5. Financials (Based on Availability)
- 11.2.14 Motekforce Link
- 11.2.14.1. Overview
- 11.2.14.2. Products
- 11.2.14.3. SWOT Analysis
- 11.2.14.4. Recent Developments
- 11.2.14.5. Financials (Based on Availability)
- 11.2.15 Gesturetek Health
- 11.2.15.1. Overview
- 11.2.15.2. Products
- 11.2.15.3. SWOT Analysis
- 11.2.15.4. Recent Developments
- 11.2.15.5. Financials (Based on Availability)
- 11.2.1 Reflexion Health
List of Figures
- Figure 1: Global Physical Therapy Rehabilitation Solutions Revenue Breakdown (undefined, %) by Region 2025 & 2033
- Figure 2: North America Physical Therapy Rehabilitation Solutions Revenue (undefined), by Application 2025 & 2033
- Figure 3: North America Physical Therapy Rehabilitation Solutions Revenue Share (%), by Application 2025 & 2033
- Figure 4: North America Physical Therapy Rehabilitation Solutions Revenue (undefined), by Types 2025 & 2033
- Figure 5: North America Physical Therapy Rehabilitation Solutions Revenue Share (%), by Types 2025 & 2033
- Figure 6: North America Physical Therapy Rehabilitation Solutions Revenue (undefined), by Country 2025 & 2033
- Figure 7: North America Physical Therapy Rehabilitation Solutions Revenue Share (%), by Country 2025 & 2033
- Figure 8: South America Physical Therapy Rehabilitation Solutions Revenue (undefined), by Application 2025 & 2033
- Figure 9: South America Physical Therapy Rehabilitation Solutions Revenue Share (%), by Application 2025 & 2033
- Figure 10: South America Physical Therapy Rehabilitation Solutions Revenue (undefined), by Types 2025 & 2033
- Figure 11: South America Physical Therapy Rehabilitation Solutions Revenue Share (%), by Types 2025 & 2033
- Figure 12: South America Physical Therapy Rehabilitation Solutions Revenue (undefined), by Country 2025 & 2033
- Figure 13: South America Physical Therapy Rehabilitation Solutions Revenue Share (%), by Country 2025 & 2033
- Figure 14: Europe Physical Therapy Rehabilitation Solutions Revenue (undefined), by Application 2025 & 2033
- Figure 15: Europe Physical Therapy Rehabilitation Solutions Revenue Share (%), by Application 2025 & 2033
- Figure 16: Europe Physical Therapy Rehabilitation Solutions Revenue (undefined), by Types 2025 & 2033
- Figure 17: Europe Physical Therapy Rehabilitation Solutions Revenue Share (%), by Types 2025 & 2033
- Figure 18: Europe Physical Therapy Rehabilitation Solutions Revenue (undefined), by Country 2025 & 2033
- Figure 19: Europe Physical Therapy Rehabilitation Solutions Revenue Share (%), by Country 2025 & 2033
- Figure 20: Middle East & Africa Physical Therapy Rehabilitation Solutions Revenue (undefined), by Application 2025 & 2033
- Figure 21: Middle East & Africa Physical Therapy Rehabilitation Solutions Revenue Share (%), by Application 2025 & 2033
- Figure 22: Middle East & Africa Physical Therapy Rehabilitation Solutions Revenue (undefined), by Types 2025 & 2033
- Figure 23: Middle East & Africa Physical Therapy Rehabilitation Solutions Revenue Share (%), by Types 2025 & 2033
- Figure 24: Middle East & Africa Physical Therapy Rehabilitation Solutions Revenue (undefined), by Country 2025 & 2033
- Figure 25: Middle East & Africa Physical Therapy Rehabilitation Solutions Revenue Share (%), by Country 2025 & 2033
- Figure 26: Asia Pacific Physical Therapy Rehabilitation Solutions Revenue (undefined), by Application 2025 & 2033
- Figure 27: Asia Pacific Physical Therapy Rehabilitation Solutions Revenue Share (%), by Application 2025 & 2033
- Figure 28: Asia Pacific Physical Therapy Rehabilitation Solutions Revenue (undefined), by Types 2025 & 2033
- Figure 29: Asia Pacific Physical Therapy Rehabilitation Solutions Revenue Share (%), by Types 2025 & 2033
- Figure 30: Asia Pacific Physical Therapy Rehabilitation Solutions Revenue (undefined), by Country 2025 & 2033
- Figure 31: Asia Pacific Physical Therapy Rehabilitation Solutions Revenue Share (%), by Country 2025 & 2033
List of Tables
- Table 1: Global Physical Therapy Rehabilitation Solutions Revenue undefined Forecast, by Application 2020 & 2033
- Table 2: Global Physical Therapy Rehabilitation Solutions Revenue undefined Forecast, by Types 2020 & 2033
- Table 3: Global Physical Therapy Rehabilitation Solutions Revenue undefined Forecast, by Region 2020 & 2033
- Table 4: Global Physical Therapy Rehabilitation Solutions Revenue undefined Forecast, by Application 2020 & 2033
- Table 5: Global Physical Therapy Rehabilitation Solutions Revenue undefined Forecast, by Types 2020 & 2033
- Table 6: Global Physical Therapy Rehabilitation Solutions Revenue undefined Forecast, by Country 2020 & 2033
- Table 7: United States Physical Therapy Rehabilitation Solutions Revenue (undefined) Forecast, by Application 2020 & 2033
- Table 8: Canada Physical Therapy Rehabilitation Solutions Revenue (undefined) Forecast, by Application 2020 & 2033
- Table 9: Mexico Physical Therapy Rehabilitation Solutions Revenue (undefined) Forecast, by Application 2020 & 2033
- Table 10: Global Physical Therapy Rehabilitation Solutions Revenue undefined Forecast, by Application 2020 & 2033
- Table 11: Global Physical Therapy Rehabilitation Solutions Revenue undefined Forecast, by Types 2020 & 2033
- Table 12: Global Physical Therapy Rehabilitation Solutions Revenue undefined Forecast, by Country 2020 & 2033
- Table 13: Brazil Physical Therapy Rehabilitation Solutions Revenue (undefined) Forecast, by Application 2020 & 2033
- Table 14: Argentina Physical Therapy Rehabilitation Solutions Revenue (undefined) Forecast, by Application 2020 & 2033
- Table 15: Rest of South America Physical Therapy Rehabilitation Solutions Revenue (undefined) Forecast, by Application 2020 & 2033
- Table 16: Global Physical Therapy Rehabilitation Solutions Revenue undefined Forecast, by Application 2020 & 2033
- Table 17: Global Physical Therapy Rehabilitation Solutions Revenue undefined Forecast, by Types 2020 & 2033
- Table 18: Global Physical Therapy Rehabilitation Solutions Revenue undefined Forecast, by Country 2020 & 2033
- Table 19: United Kingdom Physical Therapy Rehabilitation Solutions Revenue (undefined) Forecast, by Application 2020 & 2033
- Table 20: Germany Physical Therapy Rehabilitation Solutions Revenue (undefined) Forecast, by Application 2020 & 2033
- Table 21: France Physical Therapy Rehabilitation Solutions Revenue (undefined) Forecast, by Application 2020 & 2033
- Table 22: Italy Physical Therapy Rehabilitation Solutions Revenue (undefined) Forecast, by Application 2020 & 2033
- Table 23: Spain Physical Therapy Rehabilitation Solutions Revenue (undefined) Forecast, by Application 2020 & 2033
- Table 24: Russia Physical Therapy Rehabilitation Solutions Revenue (undefined) Forecast, by Application 2020 & 2033
- Table 25: Benelux Physical Therapy Rehabilitation Solutions Revenue (undefined) Forecast, by Application 2020 & 2033
- Table 26: Nordics Physical Therapy Rehabilitation Solutions Revenue (undefined) Forecast, by Application 2020 & 2033
- Table 27: Rest of Europe Physical Therapy Rehabilitation Solutions Revenue (undefined) Forecast, by Application 2020 & 2033
- Table 28: Global Physical Therapy Rehabilitation Solutions Revenue undefined Forecast, by Application 2020 & 2033
- Table 29: Global Physical Therapy Rehabilitation Solutions Revenue undefined Forecast, by Types 2020 & 2033
- Table 30: Global Physical Therapy Rehabilitation Solutions Revenue undefined Forecast, by Country 2020 & 2033
- Table 31: Turkey Physical Therapy Rehabilitation Solutions Revenue (undefined) Forecast, by Application 2020 & 2033
- Table 32: Israel Physical Therapy Rehabilitation Solutions Revenue (undefined) Forecast, by Application 2020 & 2033
- Table 33: GCC Physical Therapy Rehabilitation Solutions Revenue (undefined) Forecast, by Application 2020 & 2033
- Table 34: North Africa Physical Therapy Rehabilitation Solutions Revenue (undefined) Forecast, by Application 2020 & 2033
- Table 35: South Africa Physical Therapy Rehabilitation Solutions Revenue (undefined) Forecast, by Application 2020 & 2033
- Table 36: Rest of Middle East & Africa Physical Therapy Rehabilitation Solutions Revenue (undefined) Forecast, by Application 2020 & 2033
- Table 37: Global Physical Therapy Rehabilitation Solutions Revenue undefined Forecast, by Application 2020 & 2033
- Table 38: Global Physical Therapy Rehabilitation Solutions Revenue undefined Forecast, by Types 2020 & 2033
- Table 39: Global Physical Therapy Rehabilitation Solutions Revenue undefined Forecast, by Country 2020 & 2033
- Table 40: China Physical Therapy Rehabilitation Solutions Revenue (undefined) Forecast, by Application 2020 & 2033
- Table 41: India Physical Therapy Rehabilitation Solutions Revenue (undefined) Forecast, by Application 2020 & 2033
- Table 42: Japan Physical Therapy Rehabilitation Solutions Revenue (undefined) Forecast, by Application 2020 & 2033
- Table 43: South Korea Physical Therapy Rehabilitation Solutions Revenue (undefined) Forecast, by Application 2020 & 2033
- Table 44: ASEAN Physical Therapy Rehabilitation Solutions Revenue (undefined) Forecast, by Application 2020 & 2033
- Table 45: Oceania Physical Therapy Rehabilitation Solutions Revenue (undefined) Forecast, by Application 2020 & 2033
- Table 46: Rest of Asia Pacific Physical Therapy Rehabilitation Solutions Revenue (undefined) Forecast, by Application 2020 & 2033
Frequently Asked Questions
1. What is the projected Compound Annual Growth Rate (CAGR) of the Physical Therapy Rehabilitation Solutions?
The projected CAGR is approximately 6.22%.
2. Which companies are prominent players in the Physical Therapy Rehabilitation Solutions?
Key companies in the market include Reflexion Health, AC international East, Cerner Corporation, Kareo Inc., Therapy Sync, eviCore Healthcare, Meditab, iSalus, Smith and Nephew, CoRehab srl, Hinge Health Inc., Sword Health Inc., Mira Rehab Limited, Motekforce Link, Gesturetek Health.
3. What are the main segments of the Physical Therapy Rehabilitation Solutions?
The market segments include Application, Types.
4. Can you provide details about the market size?
The market size is estimated to be USD XXX N/A as of 2022.
5. What are some drivers contributing to market growth?
N/A
6. What are the notable trends driving market growth?
N/A
7. Are there any restraints impacting market growth?
N/A
8. Can you provide examples of recent developments in the market?
N/A
9. What pricing options are available for accessing the report?
Pricing options include single-user, multi-user, and enterprise licenses priced at USD 3950.00, USD 5925.00, and USD 7900.00 respectively.
10. Is the market size provided in terms of value or volume?
The market size is provided in terms of value, measured in N/A.
11. Are there any specific market keywords associated with the report?
Yes, the market keyword associated with the report is "Physical Therapy Rehabilitation Solutions," which aids in identifying and referencing the specific market segment covered.
12. How do I determine which pricing option suits my needs best?
The pricing options vary based on user requirements and access needs. Individual users may opt for single-user licenses, while businesses requiring broader access may choose multi-user or enterprise licenses for cost-effective access to the report.
13. Are there any additional resources or data provided in the Physical Therapy Rehabilitation Solutions report?
While the report offers comprehensive insights, it's advisable to review the specific contents or supplementary materials provided to ascertain if additional resources or data are available.
14. How can I stay updated on further developments or reports in the Physical Therapy Rehabilitation Solutions?
To stay informed about further developments, trends, and reports in the Physical Therapy Rehabilitation Solutions, consider subscribing to industry newsletters, following relevant companies and organizations, or regularly checking reputable industry news sources and publications.
Methodology
Step 1 - Identification of Relevant Samples Size from Population Database


Step 2 - Approaches for Defining Global Market Size (Value, Volume* & Price*)

Note*: In applicable scenarios
Step 3 - Data Sources
Primary Research
- Web Analytics
- Survey Reports
- Research Institute
- Latest Research Reports
- Opinion Leaders
Secondary Research
- Annual Reports
- White Paper
- Latest Press Release
- Industry Association
- Paid Database
- Investor Presentations

Step 4 - Data Triangulation
Involves using different sources of information in order to increase the validity of a study
These sources are likely to be stakeholders in a program - participants, other researchers, program staff, other community members, and so on.
Then we put all data in single framework & apply various statistical tools to find out the dynamic on the market.
During the analysis stage, feedback from the stakeholder groups would be compared to determine areas of agreement as well as areas of divergence