

Key Insights
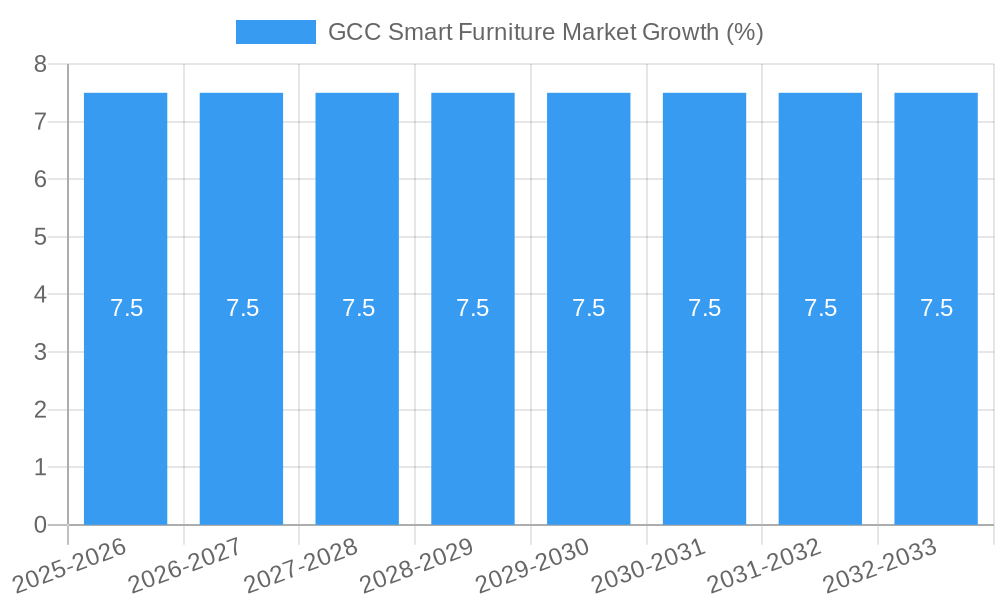
The GCC smart furniture market is experiencing robust growth, driven by increasing disposable incomes, a rising preference for technologically advanced home environments, and the growing adoption of smart home ecosystems. The market's Compound Annual Growth Rate (CAGR) exceeding 5% signifies a significant expansion projected through 2033. Key segments driving this growth include smart tables and desks, reflecting a demand for functional and aesthetically pleasing furniture that integrates seamlessly with modern lifestyles. The residential segment holds a substantial market share, fueled by increasing urbanization and a desire for comfortable, connected living spaces. However, the market faces challenges such as high initial investment costs for smart furniture and concerns regarding data privacy and security. The competitive landscape is characterized by a mix of local and international players, with companies like Ikea and others catering to various price points and customer preferences. Distribution channels are evolving, with online sales gradually gaining traction alongside traditional multi-brand and specialty stores. Future growth will likely be influenced by technological advancements, the introduction of innovative product features (such as improved ergonomic designs and enhanced connectivity), and increasing government initiatives promoting smart city development within the GCC region.
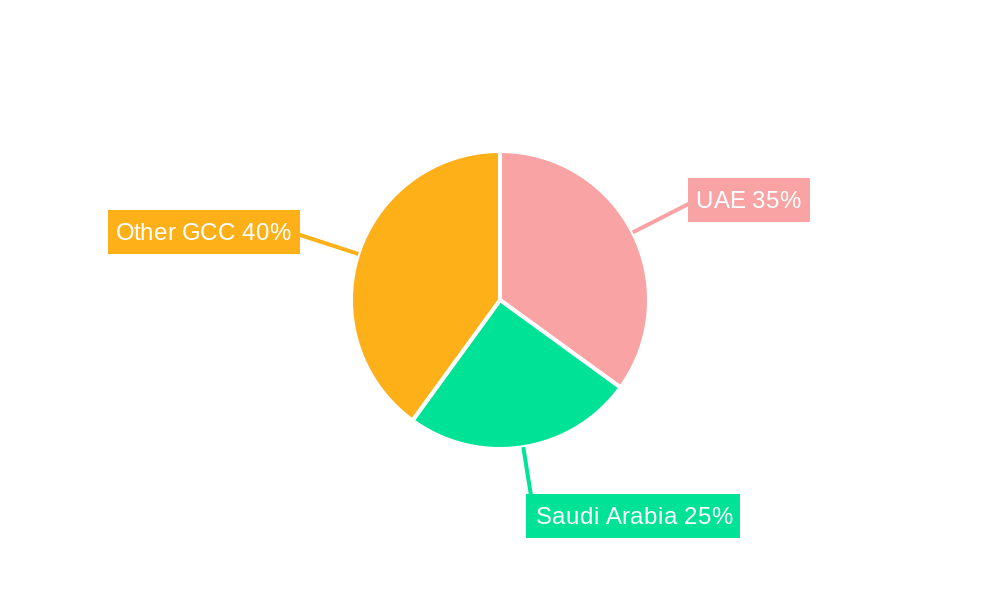
Further analysis reveals a notable regional disparity within the GCC. The United Arab Emirates and Saudi Arabia are expected to lead the market due to their relatively higher per capita income and strong focus on technological advancements. However, other GCC nations will also witness significant growth as awareness and adoption of smart furniture increases. The market's segmentation by product type showcases the diverse applications of smart furniture, ranging from functional pieces such as adjustable smart desks to comfort-focused products like smart beds. Continued innovation in areas such as voice control, integrated lighting, and charging capabilities will likely drive future market expansion and create new opportunities for both established and emerging players. Ultimately, the GCC smart furniture market presents a promising investment opportunity for businesses that can successfully address the consumer demand for stylish, functional, and technologically integrated furniture solutions.
GCC Smart Furniture Market: A Comprehensive Report (2019-2033)
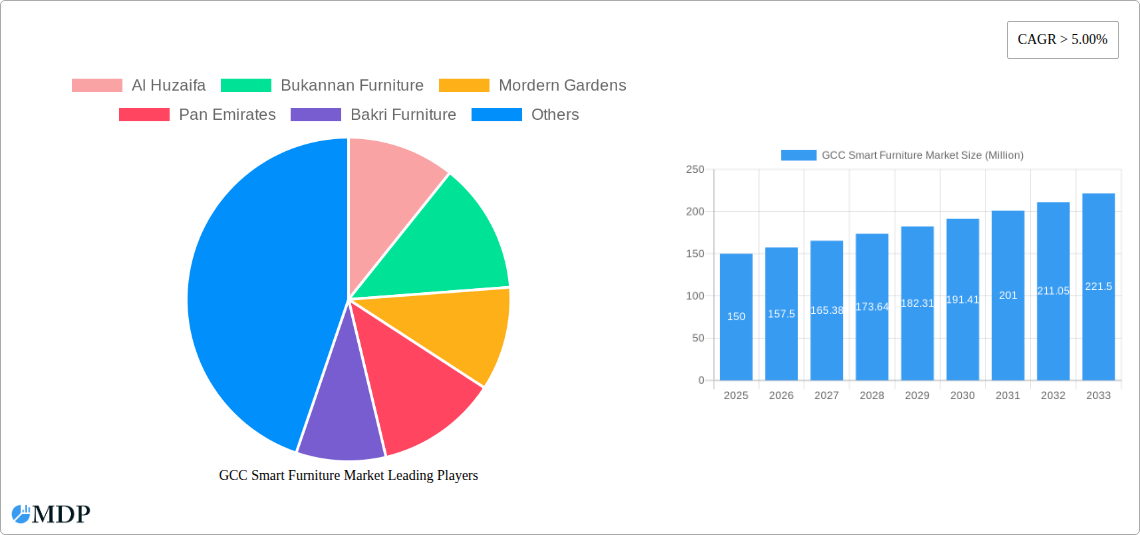
This in-depth report provides a comprehensive analysis of the GCC smart furniture market, offering invaluable insights for industry stakeholders, investors, and strategic decision-makers. With a study period spanning 2019-2033, a base year of 2025, and a forecast period of 2025-2033, this report delivers a detailed understanding of market dynamics, trends, and future growth potential. The market is segmented by end-user (residential, commercial), distribution channel (multi-brand stores, specialty stores, online, other), and product type (smart tables, smart desks, smart chairs, other smart furniture). Key players analyzed include Al Huzaifa, Bukannan Furniture, Modern Gardens, Pan Emirates, Bakri Furniture, Schuco, Ikea, Sagtco, and Royal Furniture. The report projects a market size of xx Million by 2033, exhibiting a CAGR of xx%.
GCC Smart Furniture Market Market Dynamics & Concentration
The GCC smart furniture market is characterized by a moderately concentrated landscape, with key players vying for market share. Market concentration is influenced by factors including brand recognition, product innovation, and distribution network strength. The market witnessed xx M&A deals between 2019 and 2024, indicating a growing interest in consolidation. Innovation in smart furniture technology, such as integration with IoT devices and AI-powered features, is a major growth driver. However, regulatory frameworks surrounding data privacy and cybersecurity pose challenges. Product substitutes, such as traditional furniture, compete on price and aesthetics. Residential end-users increasingly prioritize smart functionalities, while commercial users focus on workplace efficiency and aesthetics.
- Market Share (2024 Estimate): Ikea (xx%), Sagtco (xx%), Al Huzaifa (xx%), Others (xx%)
- M&A Deal Count (2019-2024): xx
- Key Innovation Drivers: IoT integration, AI-powered features, ergonomic designs.
- Regulatory Challenges: Data privacy, cybersecurity standards.
GCC Smart Furniture Market Industry Trends & Analysis
The GCC smart furniture market is experiencing robust growth, driven by rising disposable incomes, increasing urbanization, and a growing preference for technologically advanced home and office environments. Technological disruptions, such as the proliferation of smart home ecosystems and advancements in materials science, are transforming the market landscape. Consumers are increasingly demanding seamless integration of smart furniture with their existing smart home setups. Competitive dynamics are intense, with companies focusing on product differentiation, branding, and customer experience to gain a competitive edge. The market penetration of smart furniture is expected to reach xx% by 2033, with a significant portion of growth coming from the residential sector. This growth is fueled by the increasing adoption of smart home technologies and the rising demand for convenient and efficient home solutions.
Leading Markets & Segments in GCC Smart Furniture Market
The UAE and Saudi Arabia represent the largest markets within the GCC, driven by strong economic growth, high disposable incomes, and a tech-savvy population. Within the end-user segment, the residential sector is the dominant driver, representing xx% of the market in 2024. Multi-brand stores are the leading distribution channel, benefiting from widespread reach and established customer bases. Smart tables and smart desks constitute the largest product segments, propelled by their functionality and demand in both residential and commercial applications.
- Key Drivers for UAE & Saudi Arabia: High disposable incomes, strong infrastructure, technology adoption.
- Residential Segment Drivers: Convenience, enhanced living experience, home automation integration.
- Multi-brand Store Dominance: Wide reach, established customer base, brand recognition.
- Smart Tables & Desks Dominance: Functional versatility, appeal across residential and commercial segments.
GCC Smart Furniture Market Product Developments
Recent product innovations have focused on incorporating advanced features such as voice control, wireless charging, built-in lighting, and enhanced ergonomics. Smart furniture is increasingly designed for seamless integration with existing smart home systems, offering consumers a holistic and connected living experience. This is leading to a growing demand for stylish, functional, and technologically advanced furniture. Key competitive advantages are centered around features, design, and brand reputation.
Key Drivers of GCC Smart Furniture Market Growth
The growth of the GCC smart furniture market is propelled by several factors: rapid technological advancements in smart home technology, increasing disposable incomes and spending on home improvement, rising urbanization and a preference for modern living spaces, and supportive government policies encouraging technological innovation.
Challenges in the GCC Smart Furniture Market Market
The GCC smart furniture market faces several challenges including high initial costs of smart furniture, concerns regarding data security and privacy related to smart home devices, reliance on reliable internet infrastructure, and potential supply chain disruptions. These factors can impede market growth and adoption.
Emerging Opportunities in GCC Smart Furniture Market
The GCC smart furniture market presents promising opportunities, including expanding into new product categories, strategic partnerships to create bundled solutions, and leveraging digital marketing to increase awareness. Furthermore, exploring opportunities in the commercial segment through tailored solutions offers significant potential for growth.
Leading Players in the GCC Smart Furniture Market Sector
- Al Huzaifa
- Bukannan Furniture
- Modern Gardens
- Pan Emirates
- Bakri Furniture
- Schuco
- Ikea
- Sagtco
- Royal Furniture
Key Milestones in GCC Smart Furniture Market Industry
- 2020: Launch of the first AI-powered smart desk in the UAE.
- 2022: Introduction of new data privacy regulations impacting smart home device integration.
- 2023: Several key partnerships forged between furniture brands and smart home technology providers.
Strategic Outlook for GCC Smart Furniture Market Market
The GCC smart furniture market presents considerable future potential. Continued technological advancements, coupled with rising consumer demand and strategic market expansion initiatives, promise substantial growth. Companies that prioritize innovation, customer experience, and data security will be best positioned for success in this rapidly evolving market.
GCC Smart Furniture Market Segmentation
-
1. Product Type
- 1.1. Smart Tables
- 1.2. Smart Desks
- 1.3. Smart Chairs
- 1.4. Other Products (smart beds, smart sofas, etc.)
-
2. End User
- 2.1. Residential
- 2.2. Commercial
-
3. DistributionChannel
- 3.1. Multi-brand Stores
- 3.2. Specialty Stores
- 3.3. Online
- 3.4. Other Distribution Channels
-
4. Geography
- 4.1. UAE
- 4.2. Saudi Arabia
- 4.3. Qatar
- 4.4. Kuwait
- 4.5. Rest of GCC Countries
GCC Smart Furniture Market Segmentation By Geography
- 1. UAE
- 2. Saudi Arabia
- 3. Qatar
- 4. Kuwait
- 5. Rest of GCC Countries
GCC Smart Furniture Market REPORT HIGHLIGHTS
| Aspects | Details |
|---|---|
| Study Period | 2019-2033 |
| Base Year | 2024 |
| Estimated Year | 2025 |
| Forecast Period | 2025-2033 |
| Historical Period | 2019-2024 |
| Growth Rate | CAGR of > 5.00% from 2019-2033 |
| Segmentation |
|
Table of Contents
- 1. Introduction
- 1.1. Research Scope
- 1.2. Market Segmentation
- 1.3. Research Methodology
- 1.4. Definitions and Assumptions
- 2. Executive Summary
- 2.1. Introduction
- 3. Market Dynamics
- 3.1. Introduction
- 3.2. Market Drivers
- 3.2.1. Increasing Online Sales is Driving the Market; Growing Urbanisation is Driving need for Small Appliances
- 3.3. Market Restrains
- 3.3.1. Changing Needs of Customers; Limited Usage of the Product
- 3.4. Market Trends
- 3.4.1. Rise in Consumer Expenditure on Home Improvement Fuels the Market
- 4. Market Factor Analysis
- 4.1. Porters Five Forces
- 4.2. Supply/Value Chain
- 4.3. PESTEL analysis
- 4.4. Market Entropy
- 4.5. Patent/Trademark Analysis
- 5. Global GCC Smart Furniture Market Analysis, Insights and Forecast, 2019-2031
- 5.1. Market Analysis, Insights and Forecast - by Product Type
- 5.1.1. Smart Tables
- 5.1.2. Smart Desks
- 5.1.3. Smart Chairs
- 5.1.4. Other Products (smart beds, smart sofas, etc.)
- 5.2. Market Analysis, Insights and Forecast - by End User
- 5.2.1. Residential
- 5.2.2. Commercial
- 5.3. Market Analysis, Insights and Forecast - by DistributionChannel
- 5.3.1. Multi-brand Stores
- 5.3.2. Specialty Stores
- 5.3.3. Online
- 5.3.4. Other Distribution Channels
- 5.4. Market Analysis, Insights and Forecast - by Geography
- 5.4.1. UAE
- 5.4.2. Saudi Arabia
- 5.4.3. Qatar
- 5.4.4. Kuwait
- 5.4.5. Rest of GCC Countries
- 5.5. Market Analysis, Insights and Forecast - by Region
- 5.5.1. UAE
- 5.5.2. Saudi Arabia
- 5.5.3. Qatar
- 5.5.4. Kuwait
- 5.5.5. Rest of GCC Countries
- 5.1. Market Analysis, Insights and Forecast - by Product Type
- 6. UAE GCC Smart Furniture Market Analysis, Insights and Forecast, 2019-2031
- 6.1. Market Analysis, Insights and Forecast - by Product Type
- 6.1.1. Smart Tables
- 6.1.2. Smart Desks
- 6.1.3. Smart Chairs
- 6.1.4. Other Products (smart beds, smart sofas, etc.)
- 6.2. Market Analysis, Insights and Forecast - by End User
- 6.2.1. Residential
- 6.2.2. Commercial
- 6.3. Market Analysis, Insights and Forecast - by DistributionChannel
- 6.3.1. Multi-brand Stores
- 6.3.2. Specialty Stores
- 6.3.3. Online
- 6.3.4. Other Distribution Channels
- 6.4. Market Analysis, Insights and Forecast - by Geography
- 6.4.1. UAE
- 6.4.2. Saudi Arabia
- 6.4.3. Qatar
- 6.4.4. Kuwait
- 6.4.5. Rest of GCC Countries
- 6.1. Market Analysis, Insights and Forecast - by Product Type
- 7. Saudi Arabia GCC Smart Furniture Market Analysis, Insights and Forecast, 2019-2031
- 7.1. Market Analysis, Insights and Forecast - by Product Type
- 7.1.1. Smart Tables
- 7.1.2. Smart Desks
- 7.1.3. Smart Chairs
- 7.1.4. Other Products (smart beds, smart sofas, etc.)
- 7.2. Market Analysis, Insights and Forecast - by End User
- 7.2.1. Residential
- 7.2.2. Commercial
- 7.3. Market Analysis, Insights and Forecast - by DistributionChannel
- 7.3.1. Multi-brand Stores
- 7.3.2. Specialty Stores
- 7.3.3. Online
- 7.3.4. Other Distribution Channels
- 7.4. Market Analysis, Insights and Forecast - by Geography
- 7.4.1. UAE
- 7.4.2. Saudi Arabia
- 7.4.3. Qatar
- 7.4.4. Kuwait
- 7.4.5. Rest of GCC Countries
- 7.1. Market Analysis, Insights and Forecast - by Product Type
- 8. Qatar GCC Smart Furniture Market Analysis, Insights and Forecast, 2019-2031
- 8.1. Market Analysis, Insights and Forecast - by Product Type
- 8.1.1. Smart Tables
- 8.1.2. Smart Desks
- 8.1.3. Smart Chairs
- 8.1.4. Other Products (smart beds, smart sofas, etc.)
- 8.2. Market Analysis, Insights and Forecast - by End User
- 8.2.1. Residential
- 8.2.2. Commercial
- 8.3. Market Analysis, Insights and Forecast - by DistributionChannel
- 8.3.1. Multi-brand Stores
- 8.3.2. Specialty Stores
- 8.3.3. Online
- 8.3.4. Other Distribution Channels
- 8.4. Market Analysis, Insights and Forecast - by Geography
- 8.4.1. UAE
- 8.4.2. Saudi Arabia
- 8.4.3. Qatar
- 8.4.4. Kuwait
- 8.4.5. Rest of GCC Countries
- 8.1. Market Analysis, Insights and Forecast - by Product Type
- 9. Kuwait GCC Smart Furniture Market Analysis, Insights and Forecast, 2019-2031
- 9.1. Market Analysis, Insights and Forecast - by Product Type
- 9.1.1. Smart Tables
- 9.1.2. Smart Desks
- 9.1.3. Smart Chairs
- 9.1.4. Other Products (smart beds, smart sofas, etc.)
- 9.2. Market Analysis, Insights and Forecast - by End User
- 9.2.1. Residential
- 9.2.2. Commercial
- 9.3. Market Analysis, Insights and Forecast - by DistributionChannel
- 9.3.1. Multi-brand Stores
- 9.3.2. Specialty Stores
- 9.3.3. Online
- 9.3.4. Other Distribution Channels
- 9.4. Market Analysis, Insights and Forecast - by Geography
- 9.4.1. UAE
- 9.4.2. Saudi Arabia
- 9.4.3. Qatar
- 9.4.4. Kuwait
- 9.4.5. Rest of GCC Countries
- 9.1. Market Analysis, Insights and Forecast - by Product Type
- 10. Rest of GCC Countries GCC Smart Furniture Market Analysis, Insights and Forecast, 2019-2031
- 10.1. Market Analysis, Insights and Forecast - by Product Type
- 10.1.1. Smart Tables
- 10.1.2. Smart Desks
- 10.1.3. Smart Chairs
- 10.1.4. Other Products (smart beds, smart sofas, etc.)
- 10.2. Market Analysis, Insights and Forecast - by End User
- 10.2.1. Residential
- 10.2.2. Commercial
- 10.3. Market Analysis, Insights and Forecast - by DistributionChannel
- 10.3.1. Multi-brand Stores
- 10.3.2. Specialty Stores
- 10.3.3. Online
- 10.3.4. Other Distribution Channels
- 10.4. Market Analysis, Insights and Forecast - by Geography
- 10.4.1. UAE
- 10.4.2. Saudi Arabia
- 10.4.3. Qatar
- 10.4.4. Kuwait
- 10.4.5. Rest of GCC Countries
- 10.1. Market Analysis, Insights and Forecast - by Product Type
- 11. North America GCC Smart Furniture Market Analysis, Insights and Forecast, 2019-2031
- 11.1. Market Analysis, Insights and Forecast - By Country/Sub-region
- 11.1.1 United States
- 11.1.2 Canada
- 11.1.3 Mexico
- 12. Europe GCC Smart Furniture Market Analysis, Insights and Forecast, 2019-2031
- 12.1. Market Analysis, Insights and Forecast - By Country/Sub-region
- 12.1.1 Germany
- 12.1.2 United Kingdom
- 12.1.3 France
- 12.1.4 Spain
- 12.1.5 Italy
- 12.1.6 Spain
- 12.1.7 Belgium
- 12.1.8 Netherland
- 12.1.9 Nordics
- 12.1.10 Rest of Europe
- 13. Asia Pacific GCC Smart Furniture Market Analysis, Insights and Forecast, 2019-2031
- 13.1. Market Analysis, Insights and Forecast - By Country/Sub-region
- 13.1.1 China
- 13.1.2 Japan
- 13.1.3 India
- 13.1.4 South Korea
- 13.1.5 Southeast Asia
- 13.1.6 Australia
- 13.1.7 Indonesia
- 13.1.8 Phillipes
- 13.1.9 Singapore
- 13.1.10 Thailandc
- 13.1.11 Rest of Asia Pacific
- 14. South America GCC Smart Furniture Market Analysis, Insights and Forecast, 2019-2031
- 14.1. Market Analysis, Insights and Forecast - By Country/Sub-region
- 14.1.1 Brazil
- 14.1.2 Argentina
- 14.1.3 Peru
- 14.1.4 Chile
- 14.1.5 Colombia
- 14.1.6 Ecuador
- 14.1.7 Venezuela
- 14.1.8 Rest of South America
- 15. North America GCC Smart Furniture Market Analysis, Insights and Forecast, 2019-2031
- 15.1. Market Analysis, Insights and Forecast - By Country/Sub-region
- 15.1.1 United States
- 15.1.2 Canada
- 15.1.3 Mexico
- 16. MEA GCC Smart Furniture Market Analysis, Insights and Forecast, 2019-2031
- 16.1. Market Analysis, Insights and Forecast - By Country/Sub-region
- 16.1.1 United Arab Emirates
- 16.1.2 Saudi Arabia
- 16.1.3 South Africa
- 16.1.4 Rest of Middle East and Africa
- 17. Competitive Analysis
- 17.1. Global Market Share Analysis 2024
- 17.2. Company Profiles
- 17.2.1 Al Huzaifa
- 17.2.1.1. Overview
- 17.2.1.2. Products
- 17.2.1.3. SWOT Analysis
- 17.2.1.4. Recent Developments
- 17.2.1.5. Financials (Based on Availability)
- 17.2.2 Bukannan Furniture
- 17.2.2.1. Overview
- 17.2.2.2. Products
- 17.2.2.3. SWOT Analysis
- 17.2.2.4. Recent Developments
- 17.2.2.5. Financials (Based on Availability)
- 17.2.3 Mordern Gardens
- 17.2.3.1. Overview
- 17.2.3.2. Products
- 17.2.3.3. SWOT Analysis
- 17.2.3.4. Recent Developments
- 17.2.3.5. Financials (Based on Availability)
- 17.2.4 Pan Emirates
- 17.2.4.1. Overview
- 17.2.4.2. Products
- 17.2.4.3. SWOT Analysis
- 17.2.4.4. Recent Developments
- 17.2.4.5. Financials (Based on Availability)
- 17.2.5 Bakri Furniture
- 17.2.5.1. Overview
- 17.2.5.2. Products
- 17.2.5.3. SWOT Analysis
- 17.2.5.4. Recent Developments
- 17.2.5.5. Financials (Based on Availability)
- 17.2.6 Schuco
- 17.2.6.1. Overview
- 17.2.6.2. Products
- 17.2.6.3. SWOT Analysis
- 17.2.6.4. Recent Developments
- 17.2.6.5. Financials (Based on Availability)
- 17.2.7 Ikea
- 17.2.7.1. Overview
- 17.2.7.2. Products
- 17.2.7.3. SWOT Analysis
- 17.2.7.4. Recent Developments
- 17.2.7.5. Financials (Based on Availability)
- 17.2.8 Sagtco
- 17.2.8.1. Overview
- 17.2.8.2. Products
- 17.2.8.3. SWOT Analysis
- 17.2.8.4. Recent Developments
- 17.2.8.5. Financials (Based on Availability)
- 17.2.9 Royal Furniture
- 17.2.9.1. Overview
- 17.2.9.2. Products
- 17.2.9.3. SWOT Analysis
- 17.2.9.4. Recent Developments
- 17.2.9.5. Financials (Based on Availability)
- 17.2.1 Al Huzaifa
List of Figures
- Figure 1: Global GCC Smart Furniture Market Revenue Breakdown (Million, %) by Region 2024 & 2032
- Figure 2: Global GCC Smart Furniture Market Volume Breakdown (K Unit, %) by Region 2024 & 2032
- Figure 3: North America GCC Smart Furniture Market Revenue (Million), by Country 2024 & 2032
- Figure 4: North America GCC Smart Furniture Market Volume (K Unit), by Country 2024 & 2032
- Figure 5: North America GCC Smart Furniture Market Revenue Share (%), by Country 2024 & 2032
- Figure 6: North America GCC Smart Furniture Market Volume Share (%), by Country 2024 & 2032
- Figure 7: Europe GCC Smart Furniture Market Revenue (Million), by Country 2024 & 2032
- Figure 8: Europe GCC Smart Furniture Market Volume (K Unit), by Country 2024 & 2032
- Figure 9: Europe GCC Smart Furniture Market Revenue Share (%), by Country 2024 & 2032
- Figure 10: Europe GCC Smart Furniture Market Volume Share (%), by Country 2024 & 2032
- Figure 11: Asia Pacific GCC Smart Furniture Market Revenue (Million), by Country 2024 & 2032
- Figure 12: Asia Pacific GCC Smart Furniture Market Volume (K Unit), by Country 2024 & 2032
- Figure 13: Asia Pacific GCC Smart Furniture Market Revenue Share (%), by Country 2024 & 2032
- Figure 14: Asia Pacific GCC Smart Furniture Market Volume Share (%), by Country 2024 & 2032
- Figure 15: South America GCC Smart Furniture Market Revenue (Million), by Country 2024 & 2032
- Figure 16: South America GCC Smart Furniture Market Volume (K Unit), by Country 2024 & 2032
- Figure 17: South America GCC Smart Furniture Market Revenue Share (%), by Country 2024 & 2032
- Figure 18: South America GCC Smart Furniture Market Volume Share (%), by Country 2024 & 2032
- Figure 19: North America GCC Smart Furniture Market Revenue (Million), by Country 2024 & 2032
- Figure 20: North America GCC Smart Furniture Market Volume (K Unit), by Country 2024 & 2032
- Figure 21: North America GCC Smart Furniture Market Revenue Share (%), by Country 2024 & 2032
- Figure 22: North America GCC Smart Furniture Market Volume Share (%), by Country 2024 & 2032
- Figure 23: MEA GCC Smart Furniture Market Revenue (Million), by Country 2024 & 2032
- Figure 24: MEA GCC Smart Furniture Market Volume (K Unit), by Country 2024 & 2032
- Figure 25: MEA GCC Smart Furniture Market Revenue Share (%), by Country 2024 & 2032
- Figure 26: MEA GCC Smart Furniture Market Volume Share (%), by Country 2024 & 2032
- Figure 27: UAE GCC Smart Furniture Market Revenue (Million), by Product Type 2024 & 2032
- Figure 28: UAE GCC Smart Furniture Market Volume (K Unit), by Product Type 2024 & 2032
- Figure 29: UAE GCC Smart Furniture Market Revenue Share (%), by Product Type 2024 & 2032
- Figure 30: UAE GCC Smart Furniture Market Volume Share (%), by Product Type 2024 & 2032
- Figure 31: UAE GCC Smart Furniture Market Revenue (Million), by End User 2024 & 2032
- Figure 32: UAE GCC Smart Furniture Market Volume (K Unit), by End User 2024 & 2032
- Figure 33: UAE GCC Smart Furniture Market Revenue Share (%), by End User 2024 & 2032
- Figure 34: UAE GCC Smart Furniture Market Volume Share (%), by End User 2024 & 2032
- Figure 35: UAE GCC Smart Furniture Market Revenue (Million), by DistributionChannel 2024 & 2032
- Figure 36: UAE GCC Smart Furniture Market Volume (K Unit), by DistributionChannel 2024 & 2032
- Figure 37: UAE GCC Smart Furniture Market Revenue Share (%), by DistributionChannel 2024 & 2032
- Figure 38: UAE GCC Smart Furniture Market Volume Share (%), by DistributionChannel 2024 & 2032
- Figure 39: UAE GCC Smart Furniture Market Revenue (Million), by Geography 2024 & 2032
- Figure 40: UAE GCC Smart Furniture Market Volume (K Unit), by Geography 2024 & 2032
- Figure 41: UAE GCC Smart Furniture Market Revenue Share (%), by Geography 2024 & 2032
- Figure 42: UAE GCC Smart Furniture Market Volume Share (%), by Geography 2024 & 2032
- Figure 43: UAE GCC Smart Furniture Market Revenue (Million), by Country 2024 & 2032
- Figure 44: UAE GCC Smart Furniture Market Volume (K Unit), by Country 2024 & 2032
- Figure 45: UAE GCC Smart Furniture Market Revenue Share (%), by Country 2024 & 2032
- Figure 46: UAE GCC Smart Furniture Market Volume Share (%), by Country 2024 & 2032
- Figure 47: Saudi Arabia GCC Smart Furniture Market Revenue (Million), by Product Type 2024 & 2032
- Figure 48: Saudi Arabia GCC Smart Furniture Market Volume (K Unit), by Product Type 2024 & 2032
- Figure 49: Saudi Arabia GCC Smart Furniture Market Revenue Share (%), by Product Type 2024 & 2032
- Figure 50: Saudi Arabia GCC Smart Furniture Market Volume Share (%), by Product Type 2024 & 2032
- Figure 51: Saudi Arabia GCC Smart Furniture Market Revenue (Million), by End User 2024 & 2032
- Figure 52: Saudi Arabia GCC Smart Furniture Market Volume (K Unit), by End User 2024 & 2032
- Figure 53: Saudi Arabia GCC Smart Furniture Market Revenue Share (%), by End User 2024 & 2032
- Figure 54: Saudi Arabia GCC Smart Furniture Market Volume Share (%), by End User 2024 & 2032
- Figure 55: Saudi Arabia GCC Smart Furniture Market Revenue (Million), by DistributionChannel 2024 & 2032
- Figure 56: Saudi Arabia GCC Smart Furniture Market Volume (K Unit), by DistributionChannel 2024 & 2032
- Figure 57: Saudi Arabia GCC Smart Furniture Market Revenue Share (%), by DistributionChannel 2024 & 2032
- Figure 58: Saudi Arabia GCC Smart Furniture Market Volume Share (%), by DistributionChannel 2024 & 2032
- Figure 59: Saudi Arabia GCC Smart Furniture Market Revenue (Million), by Geography 2024 & 2032
- Figure 60: Saudi Arabia GCC Smart Furniture Market Volume (K Unit), by Geography 2024 & 2032
- Figure 61: Saudi Arabia GCC Smart Furniture Market Revenue Share (%), by Geography 2024 & 2032
- Figure 62: Saudi Arabia GCC Smart Furniture Market Volume Share (%), by Geography 2024 & 2032
- Figure 63: Saudi Arabia GCC Smart Furniture Market Revenue (Million), by Country 2024 & 2032
- Figure 64: Saudi Arabia GCC Smart Furniture Market Volume (K Unit), by Country 2024 & 2032
- Figure 65: Saudi Arabia GCC Smart Furniture Market Revenue Share (%), by Country 2024 & 2032
- Figure 66: Saudi Arabia GCC Smart Furniture Market Volume Share (%), by Country 2024 & 2032
- Figure 67: Qatar GCC Smart Furniture Market Revenue (Million), by Product Type 2024 & 2032
- Figure 68: Qatar GCC Smart Furniture Market Volume (K Unit), by Product Type 2024 & 2032
- Figure 69: Qatar GCC Smart Furniture Market Revenue Share (%), by Product Type 2024 & 2032
- Figure 70: Qatar GCC Smart Furniture Market Volume Share (%), by Product Type 2024 & 2032
- Figure 71: Qatar GCC Smart Furniture Market Revenue (Million), by End User 2024 & 2032
- Figure 72: Qatar GCC Smart Furniture Market Volume (K Unit), by End User 2024 & 2032
- Figure 73: Qatar GCC Smart Furniture Market Revenue Share (%), by End User 2024 & 2032
- Figure 74: Qatar GCC Smart Furniture Market Volume Share (%), by End User 2024 & 2032
- Figure 75: Qatar GCC Smart Furniture Market Revenue (Million), by DistributionChannel 2024 & 2032
- Figure 76: Qatar GCC Smart Furniture Market Volume (K Unit), by DistributionChannel 2024 & 2032
- Figure 77: Qatar GCC Smart Furniture Market Revenue Share (%), by DistributionChannel 2024 & 2032
- Figure 78: Qatar GCC Smart Furniture Market Volume Share (%), by DistributionChannel 2024 & 2032
- Figure 79: Qatar GCC Smart Furniture Market Revenue (Million), by Geography 2024 & 2032
- Figure 80: Qatar GCC Smart Furniture Market Volume (K Unit), by Geography 2024 & 2032
- Figure 81: Qatar GCC Smart Furniture Market Revenue Share (%), by Geography 2024 & 2032
- Figure 82: Qatar GCC Smart Furniture Market Volume Share (%), by Geography 2024 & 2032
- Figure 83: Qatar GCC Smart Furniture Market Revenue (Million), by Country 2024 & 2032
- Figure 84: Qatar GCC Smart Furniture Market Volume (K Unit), by Country 2024 & 2032
- Figure 85: Qatar GCC Smart Furniture Market Revenue Share (%), by Country 2024 & 2032
- Figure 86: Qatar GCC Smart Furniture Market Volume Share (%), by Country 2024 & 2032
- Figure 87: Kuwait GCC Smart Furniture Market Revenue (Million), by Product Type 2024 & 2032
- Figure 88: Kuwait GCC Smart Furniture Market Volume (K Unit), by Product Type 2024 & 2032
- Figure 89: Kuwait GCC Smart Furniture Market Revenue Share (%), by Product Type 2024 & 2032
- Figure 90: Kuwait GCC Smart Furniture Market Volume Share (%), by Product Type 2024 & 2032
- Figure 91: Kuwait GCC Smart Furniture Market Revenue (Million), by End User 2024 & 2032
- Figure 92: Kuwait GCC Smart Furniture Market Volume (K Unit), by End User 2024 & 2032
- Figure 93: Kuwait GCC Smart Furniture Market Revenue Share (%), by End User 2024 & 2032
- Figure 94: Kuwait GCC Smart Furniture Market Volume Share (%), by End User 2024 & 2032
- Figure 95: Kuwait GCC Smart Furniture Market Revenue (Million), by DistributionChannel 2024 & 2032
- Figure 96: Kuwait GCC Smart Furniture Market Volume (K Unit), by DistributionChannel 2024 & 2032
- Figure 97: Kuwait GCC Smart Furniture Market Revenue Share (%), by DistributionChannel 2024 & 2032
- Figure 98: Kuwait GCC Smart Furniture Market Volume Share (%), by DistributionChannel 2024 & 2032
- Figure 99: Kuwait GCC Smart Furniture Market Revenue (Million), by Geography 2024 & 2032
- Figure 100: Kuwait GCC Smart Furniture Market Volume (K Unit), by Geography 2024 & 2032
- Figure 101: Kuwait GCC Smart Furniture Market Revenue Share (%), by Geography 2024 & 2032
- Figure 102: Kuwait GCC Smart Furniture Market Volume Share (%), by Geography 2024 & 2032
- Figure 103: Kuwait GCC Smart Furniture Market Revenue (Million), by Country 2024 & 2032
- Figure 104: Kuwait GCC Smart Furniture Market Volume (K Unit), by Country 2024 & 2032
- Figure 105: Kuwait GCC Smart Furniture Market Revenue Share (%), by Country 2024 & 2032
- Figure 106: Kuwait GCC Smart Furniture Market Volume Share (%), by Country 2024 & 2032
- Figure 107: Rest of GCC Countries GCC Smart Furniture Market Revenue (Million), by Product Type 2024 & 2032
- Figure 108: Rest of GCC Countries GCC Smart Furniture Market Volume (K Unit), by Product Type 2024 & 2032
- Figure 109: Rest of GCC Countries GCC Smart Furniture Market Revenue Share (%), by Product Type 2024 & 2032
- Figure 110: Rest of GCC Countries GCC Smart Furniture Market Volume Share (%), by Product Type 2024 & 2032
- Figure 111: Rest of GCC Countries GCC Smart Furniture Market Revenue (Million), by End User 2024 & 2032
- Figure 112: Rest of GCC Countries GCC Smart Furniture Market Volume (K Unit), by End User 2024 & 2032
- Figure 113: Rest of GCC Countries GCC Smart Furniture Market Revenue Share (%), by End User 2024 & 2032
- Figure 114: Rest of GCC Countries GCC Smart Furniture Market Volume Share (%), by End User 2024 & 2032
- Figure 115: Rest of GCC Countries GCC Smart Furniture Market Revenue (Million), by DistributionChannel 2024 & 2032
- Figure 116: Rest of GCC Countries GCC Smart Furniture Market Volume (K Unit), by DistributionChannel 2024 & 2032
- Figure 117: Rest of GCC Countries GCC Smart Furniture Market Revenue Share (%), by DistributionChannel 2024 & 2032
- Figure 118: Rest of GCC Countries GCC Smart Furniture Market Volume Share (%), by DistributionChannel 2024 & 2032
- Figure 119: Rest of GCC Countries GCC Smart Furniture Market Revenue (Million), by Geography 2024 & 2032
- Figure 120: Rest of GCC Countries GCC Smart Furniture Market Volume (K Unit), by Geography 2024 & 2032
- Figure 121: Rest of GCC Countries GCC Smart Furniture Market Revenue Share (%), by Geography 2024 & 2032
- Figure 122: Rest of GCC Countries GCC Smart Furniture Market Volume Share (%), by Geography 2024 & 2032
- Figure 123: Rest of GCC Countries GCC Smart Furniture Market Revenue (Million), by Country 2024 & 2032
- Figure 124: Rest of GCC Countries GCC Smart Furniture Market Volume (K Unit), by Country 2024 & 2032
- Figure 125: Rest of GCC Countries GCC Smart Furniture Market Revenue Share (%), by Country 2024 & 2032
- Figure 126: Rest of GCC Countries GCC Smart Furniture Market Volume Share (%), by Country 2024 & 2032
List of Tables
- Table 1: Global GCC Smart Furniture Market Revenue Million Forecast, by Region 2019 & 2032
- Table 2: Global GCC Smart Furniture Market Volume K Unit Forecast, by Region 2019 & 2032
- Table 3: Global GCC Smart Furniture Market Revenue Million Forecast, by Product Type 2019 & 2032
- Table 4: Global GCC Smart Furniture Market Volume K Unit Forecast, by Product Type 2019 & 2032
- Table 5: Global GCC Smart Furniture Market Revenue Million Forecast, by End User 2019 & 2032
- Table 6: Global GCC Smart Furniture Market Volume K Unit Forecast, by End User 2019 & 2032
- Table 7: Global GCC Smart Furniture Market Revenue Million Forecast, by DistributionChannel 2019 & 2032
- Table 8: Global GCC Smart Furniture Market Volume K Unit Forecast, by DistributionChannel 2019 & 2032
- Table 9: Global GCC Smart Furniture Market Revenue Million Forecast, by Geography 2019 & 2032
- Table 10: Global GCC Smart Furniture Market Volume K Unit Forecast, by Geography 2019 & 2032
- Table 11: Global GCC Smart Furniture Market Revenue Million Forecast, by Region 2019 & 2032
- Table 12: Global GCC Smart Furniture Market Volume K Unit Forecast, by Region 2019 & 2032
- Table 13: Global GCC Smart Furniture Market Revenue Million Forecast, by Country 2019 & 2032
- Table 14: Global GCC Smart Furniture Market Volume K Unit Forecast, by Country 2019 & 2032
- Table 15: United States GCC Smart Furniture Market Revenue (Million) Forecast, by Application 2019 & 2032
- Table 16: United States GCC Smart Furniture Market Volume (K Unit) Forecast, by Application 2019 & 2032
- Table 17: Canada GCC Smart Furniture Market Revenue (Million) Forecast, by Application 2019 & 2032
- Table 18: Canada GCC Smart Furniture Market Volume (K Unit) Forecast, by Application 2019 & 2032
- Table 19: Mexico GCC Smart Furniture Market Revenue (Million) Forecast, by Application 2019 & 2032
- Table 20: Mexico GCC Smart Furniture Market Volume (K Unit) Forecast, by Application 2019 & 2032
- Table 21: Global GCC Smart Furniture Market Revenue Million Forecast, by Country 2019 & 2032
- Table 22: Global GCC Smart Furniture Market Volume K Unit Forecast, by Country 2019 & 2032
- Table 23: Germany GCC Smart Furniture Market Revenue (Million) Forecast, by Application 2019 & 2032
- Table 24: Germany GCC Smart Furniture Market Volume (K Unit) Forecast, by Application 2019 & 2032
- Table 25: United Kingdom GCC Smart Furniture Market Revenue (Million) Forecast, by Application 2019 & 2032
- Table 26: United Kingdom GCC Smart Furniture Market Volume (K Unit) Forecast, by Application 2019 & 2032
- Table 27: France GCC Smart Furniture Market Revenue (Million) Forecast, by Application 2019 & 2032
- Table 28: France GCC Smart Furniture Market Volume (K Unit) Forecast, by Application 2019 & 2032
- Table 29: Spain GCC Smart Furniture Market Revenue (Million) Forecast, by Application 2019 & 2032
- Table 30: Spain GCC Smart Furniture Market Volume (K Unit) Forecast, by Application 2019 & 2032
- Table 31: Italy GCC Smart Furniture Market Revenue (Million) Forecast, by Application 2019 & 2032
- Table 32: Italy GCC Smart Furniture Market Volume (K Unit) Forecast, by Application 2019 & 2032
- Table 33: Spain GCC Smart Furniture Market Revenue (Million) Forecast, by Application 2019 & 2032
- Table 34: Spain GCC Smart Furniture Market Volume (K Unit) Forecast, by Application 2019 & 2032
- Table 35: Belgium GCC Smart Furniture Market Revenue (Million) Forecast, by Application 2019 & 2032
- Table 36: Belgium GCC Smart Furniture Market Volume (K Unit) Forecast, by Application 2019 & 2032
- Table 37: Netherland GCC Smart Furniture Market Revenue (Million) Forecast, by Application 2019 & 2032
- Table 38: Netherland GCC Smart Furniture Market Volume (K Unit) Forecast, by Application 2019 & 2032
- Table 39: Nordics GCC Smart Furniture Market Revenue (Million) Forecast, by Application 2019 & 2032
- Table 40: Nordics GCC Smart Furniture Market Volume (K Unit) Forecast, by Application 2019 & 2032
- Table 41: Rest of Europe GCC Smart Furniture Market Revenue (Million) Forecast, by Application 2019 & 2032
- Table 42: Rest of Europe GCC Smart Furniture Market Volume (K Unit) Forecast, by Application 2019 & 2032
- Table 43: Global GCC Smart Furniture Market Revenue Million Forecast, by Country 2019 & 2032
- Table 44: Global GCC Smart Furniture Market Volume K Unit Forecast, by Country 2019 & 2032
- Table 45: China GCC Smart Furniture Market Revenue (Million) Forecast, by Application 2019 & 2032
- Table 46: China GCC Smart Furniture Market Volume (K Unit) Forecast, by Application 2019 & 2032
- Table 47: Japan GCC Smart Furniture Market Revenue (Million) Forecast, by Application 2019 & 2032
- Table 48: Japan GCC Smart Furniture Market Volume (K Unit) Forecast, by Application 2019 & 2032
- Table 49: India GCC Smart Furniture Market Revenue (Million) Forecast, by Application 2019 & 2032
- Table 50: India GCC Smart Furniture Market Volume (K Unit) Forecast, by Application 2019 & 2032
- Table 51: South Korea GCC Smart Furniture Market Revenue (Million) Forecast, by Application 2019 & 2032
- Table 52: South Korea GCC Smart Furniture Market Volume (K Unit) Forecast, by Application 2019 & 2032
- Table 53: Southeast Asia GCC Smart Furniture Market Revenue (Million) Forecast, by Application 2019 & 2032
- Table 54: Southeast Asia GCC Smart Furniture Market Volume (K Unit) Forecast, by Application 2019 & 2032
- Table 55: Australia GCC Smart Furniture Market Revenue (Million) Forecast, by Application 2019 & 2032
- Table 56: Australia GCC Smart Furniture Market Volume (K Unit) Forecast, by Application 2019 & 2032
- Table 57: Indonesia GCC Smart Furniture Market Revenue (Million) Forecast, by Application 2019 & 2032
- Table 58: Indonesia GCC Smart Furniture Market Volume (K Unit) Forecast, by Application 2019 & 2032
- Table 59: Phillipes GCC Smart Furniture Market Revenue (Million) Forecast, by Application 2019 & 2032
- Table 60: Phillipes GCC Smart Furniture Market Volume (K Unit) Forecast, by Application 2019 & 2032
- Table 61: Singapore GCC Smart Furniture Market Revenue (Million) Forecast, by Application 2019 & 2032
- Table 62: Singapore GCC Smart Furniture Market Volume (K Unit) Forecast, by Application 2019 & 2032
- Table 63: Thailandc GCC Smart Furniture Market Revenue (Million) Forecast, by Application 2019 & 2032
- Table 64: Thailandc GCC Smart Furniture Market Volume (K Unit) Forecast, by Application 2019 & 2032
- Table 65: Rest of Asia Pacific GCC Smart Furniture Market Revenue (Million) Forecast, by Application 2019 & 2032
- Table 66: Rest of Asia Pacific GCC Smart Furniture Market Volume (K Unit) Forecast, by Application 2019 & 2032
- Table 67: Global GCC Smart Furniture Market Revenue Million Forecast, by Country 2019 & 2032
- Table 68: Global GCC Smart Furniture Market Volume K Unit Forecast, by Country 2019 & 2032
- Table 69: Brazil GCC Smart Furniture Market Revenue (Million) Forecast, by Application 2019 & 2032
- Table 70: Brazil GCC Smart Furniture Market Volume (K Unit) Forecast, by Application 2019 & 2032
- Table 71: Argentina GCC Smart Furniture Market Revenue (Million) Forecast, by Application 2019 & 2032
- Table 72: Argentina GCC Smart Furniture Market Volume (K Unit) Forecast, by Application 2019 & 2032
- Table 73: Peru GCC Smart Furniture Market Revenue (Million) Forecast, by Application 2019 & 2032
- Table 74: Peru GCC Smart Furniture Market Volume (K Unit) Forecast, by Application 2019 & 2032
- Table 75: Chile GCC Smart Furniture Market Revenue (Million) Forecast, by Application 2019 & 2032
- Table 76: Chile GCC Smart Furniture Market Volume (K Unit) Forecast, by Application 2019 & 2032
- Table 77: Colombia GCC Smart Furniture Market Revenue (Million) Forecast, by Application 2019 & 2032
- Table 78: Colombia GCC Smart Furniture Market Volume (K Unit) Forecast, by Application 2019 & 2032
- Table 79: Ecuador GCC Smart Furniture Market Revenue (Million) Forecast, by Application 2019 & 2032
- Table 80: Ecuador GCC Smart Furniture Market Volume (K Unit) Forecast, by Application 2019 & 2032
- Table 81: Venezuela GCC Smart Furniture Market Revenue (Million) Forecast, by Application 2019 & 2032
- Table 82: Venezuela GCC Smart Furniture Market Volume (K Unit) Forecast, by Application 2019 & 2032
- Table 83: Rest of South America GCC Smart Furniture Market Revenue (Million) Forecast, by Application 2019 & 2032
- Table 84: Rest of South America GCC Smart Furniture Market Volume (K Unit) Forecast, by Application 2019 & 2032
- Table 85: Global GCC Smart Furniture Market Revenue Million Forecast, by Country 2019 & 2032
- Table 86: Global GCC Smart Furniture Market Volume K Unit Forecast, by Country 2019 & 2032
- Table 87: United States GCC Smart Furniture Market Revenue (Million) Forecast, by Application 2019 & 2032
- Table 88: United States GCC Smart Furniture Market Volume (K Unit) Forecast, by Application 2019 & 2032
- Table 89: Canada GCC Smart Furniture Market Revenue (Million) Forecast, by Application 2019 & 2032
- Table 90: Canada GCC Smart Furniture Market Volume (K Unit) Forecast, by Application 2019 & 2032
- Table 91: Mexico GCC Smart Furniture Market Revenue (Million) Forecast, by Application 2019 & 2032
- Table 92: Mexico GCC Smart Furniture Market Volume (K Unit) Forecast, by Application 2019 & 2032
- Table 93: Global GCC Smart Furniture Market Revenue Million Forecast, by Country 2019 & 2032
- Table 94: Global GCC Smart Furniture Market Volume K Unit Forecast, by Country 2019 & 2032
- Table 95: United Arab Emirates GCC Smart Furniture Market Revenue (Million) Forecast, by Application 2019 & 2032
- Table 96: United Arab Emirates GCC Smart Furniture Market Volume (K Unit) Forecast, by Application 2019 & 2032
- Table 97: Saudi Arabia GCC Smart Furniture Market Revenue (Million) Forecast, by Application 2019 & 2032
- Table 98: Saudi Arabia GCC Smart Furniture Market Volume (K Unit) Forecast, by Application 2019 & 2032
- Table 99: South Africa GCC Smart Furniture Market Revenue (Million) Forecast, by Application 2019 & 2032
- Table 100: South Africa GCC Smart Furniture Market Volume (K Unit) Forecast, by Application 2019 & 2032
- Table 101: Rest of Middle East and Africa GCC Smart Furniture Market Revenue (Million) Forecast, by Application 2019 & 2032
- Table 102: Rest of Middle East and Africa GCC Smart Furniture Market Volume (K Unit) Forecast, by Application 2019 & 2032
- Table 103: Global GCC Smart Furniture Market Revenue Million Forecast, by Product Type 2019 & 2032
- Table 104: Global GCC Smart Furniture Market Volume K Unit Forecast, by Product Type 2019 & 2032
- Table 105: Global GCC Smart Furniture Market Revenue Million Forecast, by End User 2019 & 2032
- Table 106: Global GCC Smart Furniture Market Volume K Unit Forecast, by End User 2019 & 2032
- Table 107: Global GCC Smart Furniture Market Revenue Million Forecast, by DistributionChannel 2019 & 2032
- Table 108: Global GCC Smart Furniture Market Volume K Unit Forecast, by DistributionChannel 2019 & 2032
- Table 109: Global GCC Smart Furniture Market Revenue Million Forecast, by Geography 2019 & 2032
- Table 110: Global GCC Smart Furniture Market Volume K Unit Forecast, by Geography 2019 & 2032
- Table 111: Global GCC Smart Furniture Market Revenue Million Forecast, by Country 2019 & 2032
- Table 112: Global GCC Smart Furniture Market Volume K Unit Forecast, by Country 2019 & 2032
- Table 113: Global GCC Smart Furniture Market Revenue Million Forecast, by Product Type 2019 & 2032
- Table 114: Global GCC Smart Furniture Market Volume K Unit Forecast, by Product Type 2019 & 2032
- Table 115: Global GCC Smart Furniture Market Revenue Million Forecast, by End User 2019 & 2032
- Table 116: Global GCC Smart Furniture Market Volume K Unit Forecast, by End User 2019 & 2032
- Table 117: Global GCC Smart Furniture Market Revenue Million Forecast, by DistributionChannel 2019 & 2032
- Table 118: Global GCC Smart Furniture Market Volume K Unit Forecast, by DistributionChannel 2019 & 2032
- Table 119: Global GCC Smart Furniture Market Revenue Million Forecast, by Geography 2019 & 2032
- Table 120: Global GCC Smart Furniture Market Volume K Unit Forecast, by Geography 2019 & 2032
- Table 121: Global GCC Smart Furniture Market Revenue Million Forecast, by Country 2019 & 2032
- Table 122: Global GCC Smart Furniture Market Volume K Unit Forecast, by Country 2019 & 2032
- Table 123: Global GCC Smart Furniture Market Revenue Million Forecast, by Product Type 2019 & 2032
- Table 124: Global GCC Smart Furniture Market Volume K Unit Forecast, by Product Type 2019 & 2032
- Table 125: Global GCC Smart Furniture Market Revenue Million Forecast, by End User 2019 & 2032
- Table 126: Global GCC Smart Furniture Market Volume K Unit Forecast, by End User 2019 & 2032
- Table 127: Global GCC Smart Furniture Market Revenue Million Forecast, by DistributionChannel 2019 & 2032
- Table 128: Global GCC Smart Furniture Market Volume K Unit Forecast, by DistributionChannel 2019 & 2032
- Table 129: Global GCC Smart Furniture Market Revenue Million Forecast, by Geography 2019 & 2032
- Table 130: Global GCC Smart Furniture Market Volume K Unit Forecast, by Geography 2019 & 2032
- Table 131: Global GCC Smart Furniture Market Revenue Million Forecast, by Country 2019 & 2032
- Table 132: Global GCC Smart Furniture Market Volume K Unit Forecast, by Country 2019 & 2032
- Table 133: Global GCC Smart Furniture Market Revenue Million Forecast, by Product Type 2019 & 2032
- Table 134: Global GCC Smart Furniture Market Volume K Unit Forecast, by Product Type 2019 & 2032
- Table 135: Global GCC Smart Furniture Market Revenue Million Forecast, by End User 2019 & 2032
- Table 136: Global GCC Smart Furniture Market Volume K Unit Forecast, by End User 2019 & 2032
- Table 137: Global GCC Smart Furniture Market Revenue Million Forecast, by DistributionChannel 2019 & 2032
- Table 138: Global GCC Smart Furniture Market Volume K Unit Forecast, by DistributionChannel 2019 & 2032
- Table 139: Global GCC Smart Furniture Market Revenue Million Forecast, by Geography 2019 & 2032
- Table 140: Global GCC Smart Furniture Market Volume K Unit Forecast, by Geography 2019 & 2032
- Table 141: Global GCC Smart Furniture Market Revenue Million Forecast, by Country 2019 & 2032
- Table 142: Global GCC Smart Furniture Market Volume K Unit Forecast, by Country 2019 & 2032
- Table 143: Global GCC Smart Furniture Market Revenue Million Forecast, by Product Type 2019 & 2032
- Table 144: Global GCC Smart Furniture Market Volume K Unit Forecast, by Product Type 2019 & 2032
- Table 145: Global GCC Smart Furniture Market Revenue Million Forecast, by End User 2019 & 2032
- Table 146: Global GCC Smart Furniture Market Volume K Unit Forecast, by End User 2019 & 2032
- Table 147: Global GCC Smart Furniture Market Revenue Million Forecast, by DistributionChannel 2019 & 2032
- Table 148: Global GCC Smart Furniture Market Volume K Unit Forecast, by DistributionChannel 2019 & 2032
- Table 149: Global GCC Smart Furniture Market Revenue Million Forecast, by Geography 2019 & 2032
- Table 150: Global GCC Smart Furniture Market Volume K Unit Forecast, by Geography 2019 & 2032
- Table 151: Global GCC Smart Furniture Market Revenue Million Forecast, by Country 2019 & 2032
- Table 152: Global GCC Smart Furniture Market Volume K Unit Forecast, by Country 2019 & 2032
Frequently Asked Questions
1. What is the projected Compound Annual Growth Rate (CAGR) of the GCC Smart Furniture Market?
The projected CAGR is approximately > 5.00%.
2. Which companies are prominent players in the GCC Smart Furniture Market?
Key companies in the market include Al Huzaifa, Bukannan Furniture, Mordern Gardens, Pan Emirates, Bakri Furniture, Schuco, Ikea, Sagtco, Royal Furniture.
3. What are the main segments of the GCC Smart Furniture Market?
The market segments include Product Type, End User, DistributionChannel, Geography.
4. Can you provide details about the market size?
The market size is estimated to be USD XX Million as of 2022.
5. What are some drivers contributing to market growth?
Increasing Online Sales is Driving the Market; Growing Urbanisation is Driving need for Small Appliances.
6. What are the notable trends driving market growth?
Rise in Consumer Expenditure on Home Improvement Fuels the Market.
7. Are there any restraints impacting market growth?
Changing Needs of Customers; Limited Usage of the Product.
8. Can you provide examples of recent developments in the market?
N/A
9. What pricing options are available for accessing the report?
Pricing options include single-user, multi-user, and enterprise licenses priced at USD 4750, USD 5250, and USD 8750 respectively.
10. Is the market size provided in terms of value or volume?
The market size is provided in terms of value, measured in Million and volume, measured in K Unit.
11. Are there any specific market keywords associated with the report?
Yes, the market keyword associated with the report is "GCC Smart Furniture Market," which aids in identifying and referencing the specific market segment covered.
12. How do I determine which pricing option suits my needs best?
The pricing options vary based on user requirements and access needs. Individual users may opt for single-user licenses, while businesses requiring broader access may choose multi-user or enterprise licenses for cost-effective access to the report.
13. Are there any additional resources or data provided in the GCC Smart Furniture Market report?
While the report offers comprehensive insights, it's advisable to review the specific contents or supplementary materials provided to ascertain if additional resources or data are available.
14. How can I stay updated on further developments or reports in the GCC Smart Furniture Market?
To stay informed about further developments, trends, and reports in the GCC Smart Furniture Market, consider subscribing to industry newsletters, following relevant companies and organizations, or regularly checking reputable industry news sources and publications.
Methodology
Step 1 - Identification of Relevant Samples Size from Population Database


Step 2 - Approaches for Defining Global Market Size (Value, Volume* & Price*)

Note*: In applicable scenarios
Step 3 - Data Sources
Primary Research
- Web Analytics
- Survey Reports
- Research Institute
- Latest Research Reports
- Opinion Leaders
Secondary Research
- Annual Reports
- White Paper
- Latest Press Release
- Industry Association
- Paid Database
- Investor Presentations

Step 4 - Data Triangulation
Involves using different sources of information in order to increase the validity of a study
These sources are likely to be stakeholders in a program - participants, other researchers, program staff, other community members, and so on.
Then we put all data in single framework & apply various statistical tools to find out the dynamic on the market.
During the analysis stage, feedback from the stakeholder groups would be compared to determine areas of agreement as well as areas of divergence
