

Key Insights
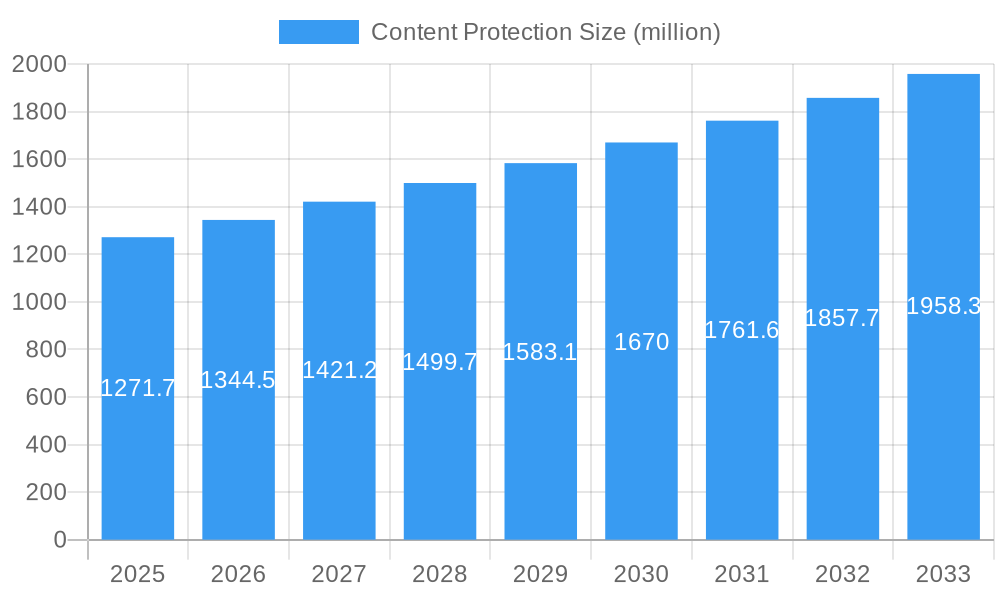
The global content protection market, valued at $1271.7 million in 2025, is projected to experience robust growth, driven by the increasing demand for secure content delivery across various digital platforms. The market's Compound Annual Growth Rate (CAGR) of 5.5% from 2025 to 2033 indicates a significant expansion, fueled by the proliferation of streaming services, the rise of digital media consumption, and escalating concerns about piracy and unauthorized content access. Key drivers include the expanding adoption of digital rights management (DRM) solutions by media companies, internet service providers, and entertainment platforms to safeguard their intellectual property. The increasing sophistication of piracy techniques necessitates continuous innovation in content protection technologies, further stimulating market growth. Furthermore, the growing integration of watermarking and conditional access systems (CAS) into various applications, including online gaming and e-commerce, presents lucrative opportunities for market players. Regional variations exist, with North America and Europe currently dominating the market due to advanced technological infrastructure and higher digital content consumption. However, the Asia-Pacific region is expected to witness significant growth, driven by rising internet penetration and increasing demand for digital entertainment.
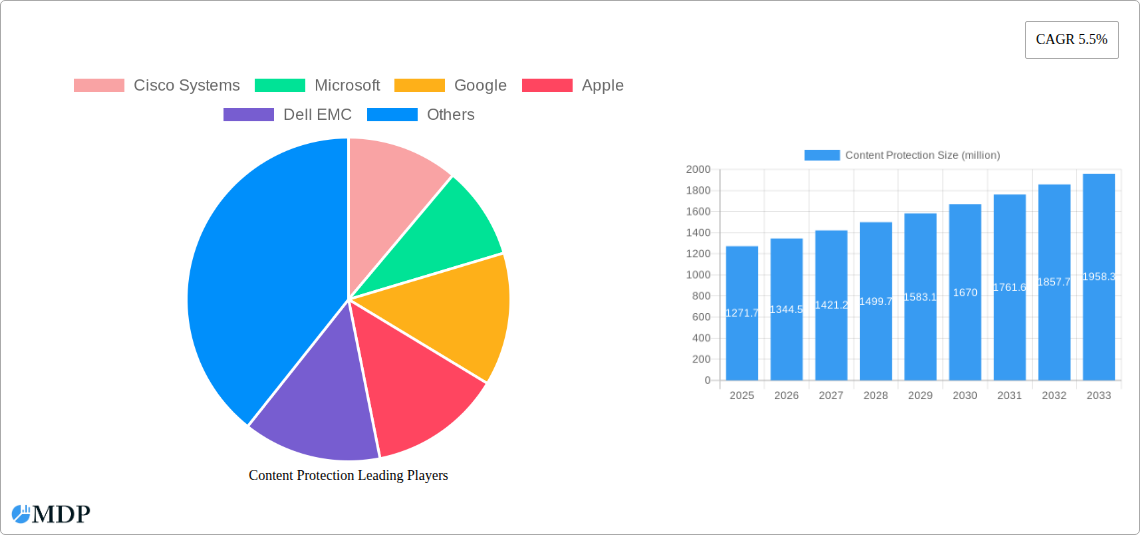
Content Protection Market Size (In Billion)
The market segmentation reveals a diverse landscape. Digital Rights Management (DRM) remains a dominant technology, owing to its widespread adoption across various platforms. However, the demand for more robust and adaptable solutions is driving growth in other segments, including Conditional Access Systems (CAS) and watermarking. The application of content protection technologies spans across internet services, media content delivery, and other sectors including online gaming and e-commerce, each showcasing unique growth trajectories. Competitive dynamics are characterized by the presence of established technology giants like Cisco, Microsoft, and Google, alongside specialized content protection firms like Verimatrix and Irdeto. These companies are investing heavily in research and development to offer innovative and sophisticated content protection solutions, leading to a dynamic and competitive market landscape. The forecast period will likely see increased mergers and acquisitions as companies strive for market consolidation and expanded service offerings.
Content Protection Company Market Share
Content Protection Market Report: A Comprehensive Analysis of a Multi-Billion Dollar Industry (2019-2033)
This comprehensive report delivers an in-depth analysis of the global Content Protection market, projecting a market valuation exceeding $XX billion by 2033. It provides actionable insights for industry stakeholders, investors, and businesses seeking to navigate this rapidly evolving landscape. The report leverages extensive market research conducted over the study period (2019-2024), with a focus on the estimated year 2025 and a forecast spanning 2025-2033. Key players like Cisco Systems, Microsoft, Google, and others are profiled, along with detailed segment analysis across applications and types. Discover crucial market trends, growth drivers, challenges, and opportunities within the digital rights management (DRM), conditional access systems (CAS), and watermarking sectors.
Content Protection Market Dynamics & Concentration
The global Content Protection market exhibits a moderately concentrated landscape, with a few major players holding significant market share. In 2025, the top five companies are estimated to collectively control approximately 40% of the market. This concentration is driven by substantial investments in R&D, strategic acquisitions, and strong brand recognition. However, the market also witnesses the emergence of numerous niche players, particularly in the DRM and watermarking segments.
Market Dynamics:
- Innovation Drivers: Advancements in encryption technologies, AI-powered content authentication, and blockchain integration are key drivers.
- Regulatory Frameworks: Increasingly stringent data privacy regulations and copyright laws significantly influence market dynamics.
- Product Substitutes: While no direct substitutes exist, alternative security measures such as robust access controls and network security can impact market growth.
- End-User Trends: The rising consumption of digital content across various platforms (streaming, OTT, etc.) fuels market growth.
- M&A Activities: The past five years have witnessed approximately XX M&A deals in the Content Protection sector, primarily focused on consolidating market share and acquiring specialized technologies. Companies like Verimatrix and Irdeto have been active acquirers.
Content Protection Industry Trends & Analysis
The Content Protection market is experiencing robust growth, driven by a confluence of factors. The Compound Annual Growth Rate (CAGR) during the forecast period (2025-2033) is projected at XX%. Market penetration is expected to reach XX% by 2033, largely driven by increasing digital content consumption and the need to safeguard intellectual property.
Several key trends shape the industry:
- Technological Disruptions: The increasing adoption of 5G, edge computing, and AI-powered security solutions presents both opportunities and challenges.
- Consumer Preferences: Consumers increasingly value secure and convenient access to digital content, driving demand for robust content protection solutions.
- Competitive Dynamics: The market is characterized by intense competition among established players and emerging startups, leading to continuous innovation and price optimization.
Leading Markets & Segments in Content Protection
The Media Content application segment dominates the Content Protection market, accounting for over 50% of the total revenue in 2025. This dominance stems from the high value and vulnerability of media assets. North America and Europe are the leading regional markets, driven by robust digital infrastructure, high content consumption, and stringent copyright protection laws.
Key Drivers by Segment:
- Media Content: High-value content, stringent copyright regulations, and increasing piracy concerns.
- Internet Services: Growing adoption of cloud-based services and the need to protect sensitive data.
- Digital Rights Management (DRM): Widespread adoption across various platforms (streaming, gaming, etc.).
- Conditional Access System (CAS): Essential for pay-TV and other subscription-based services.
- Watermarking: Effective solution for tracking content distribution and preventing unauthorized copying.
Dominance Analysis: North America's dominance is attributed to the strong presence of major technology companies and a highly developed digital ecosystem. European markets demonstrate strong growth due to increasing regulatory pressure and rising digital content consumption.
Content Protection Product Developments
Recent advancements focus on integrating AI and machine learning to enhance content authentication, detect piracy more effectively, and personalize security measures. Solutions are increasingly cloud-based and incorporate advanced encryption algorithms for improved security. The market emphasizes seamless user experience while providing robust protection against unauthorized access and distribution.
Key Drivers of Content Protection Growth
The market's growth is driven by several factors:
- Technological Advancements: Continuous innovation in encryption, watermarking, and AI-powered security solutions.
- Economic Growth: Increased disposable income and rising demand for digital content across developing economies.
- Stringent Regulations: Governments worldwide are implementing stricter copyright laws and data privacy regulations.
Challenges in the Content Protection Market
Several factors hinder market growth:
- Regulatory Hurdles: Differing regulations across jurisdictions create compliance complexities.
- Supply Chain Issues: Maintaining secure supply chains for hardware and software components is crucial.
- Competitive Pressure: Intense competition among established and emerging players impacts pricing and profitability.
Emerging Opportunities in Content Protection
The long-term growth potential is fueled by the expansion of 5G networks, the growth of the Metaverse, and the increasing adoption of blockchain technology for secure content distribution. Strategic partnerships between content providers and technology firms will play a vital role in driving market expansion.
Leading Players in the Content Protection Sector
- Cisco Systems
- Microsoft
- Apple
- Dell EMC
- Ericsson
- Adobe Systems
- China Digital TV Holding
- ZTE
- Verimatrix
- Digimarc
- Irdeto
- Kudelski Group
- Sony
- Verance
- BS Conditional Access Systems
- Conax
- ARRIS International
- Wellav Technologies
Key Milestones in Content Protection Industry
- 2020: Increased adoption of cloud-based DRM solutions.
- 2021: Launch of several AI-powered content authentication platforms.
- 2022: Several significant M&A activities involving major players.
- 2023: Increased focus on blockchain-based content protection solutions.
- 2024: Growing adoption of watermarking technologies for enhanced security.
Strategic Outlook for Content Protection Market
The Content Protection market holds significant long-term growth potential. The convergence of technological advancements, evolving consumer preferences, and stringent regulations will create a positive outlook for the industry. Focusing on innovative solutions, strategic partnerships, and global market expansion will be crucial for success.
Content Protection Segmentation
-
1. Application
- 1.1. Internet Services
- 1.2. Media Content
- 1.3. Others
-
2. Types
- 2.1. Digital Rights Management (DRM)
- 2.2. Conditional Access System (CAS)
- 2.3. Watermarking
- 2.4. Others
Content Protection Segmentation By Geography
-
1. North America
- 1.1. United States
- 1.2. Canada
- 1.3. Mexico
-
2. South America
- 2.1. Brazil
- 2.2. Argentina
- 2.3. Rest of South America
-
3. Europe
- 3.1. United Kingdom
- 3.2. Germany
- 3.3. France
- 3.4. Italy
- 3.5. Spain
- 3.6. Russia
- 3.7. Benelux
- 3.8. Nordics
- 3.9. Rest of Europe
-
4. Middle East & Africa
- 4.1. Turkey
- 4.2. Israel
- 4.3. GCC
- 4.4. North Africa
- 4.5. South Africa
- 4.6. Rest of Middle East & Africa
-
5. Asia Pacific
- 5.1. China
- 5.2. India
- 5.3. Japan
- 5.4. South Korea
- 5.5. ASEAN
- 5.6. Oceania
- 5.7. Rest of Asia Pacific
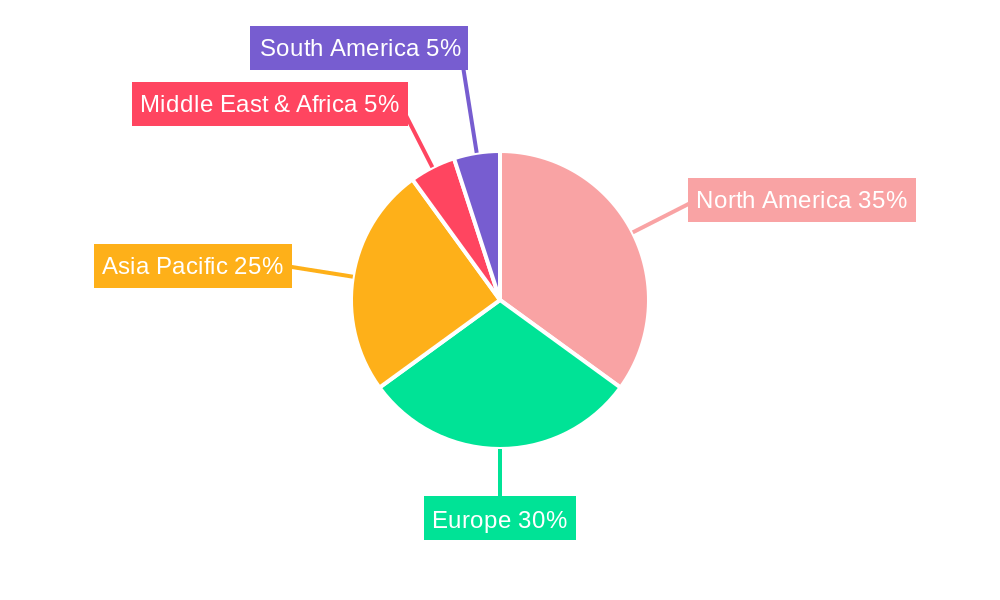
Content Protection Regional Market Share
Geographic Coverage of Content Protection
Content Protection REPORT HIGHLIGHTS
| Aspects | Details |
|---|---|
| Study Period | 2020-2034 |
| Base Year | 2025 |
| Estimated Year | 2026 |
| Forecast Period | 2026-2034 |
| Historical Period | 2020-2025 |
| Growth Rate | CAGR of 5.5% from 2020-2034 |
| Segmentation |
|
Table of Contents
- 1. Introduction
- 1.1. Research Scope
- 1.2. Market Segmentation
- 1.3. Research Methodology
- 1.4. Definitions and Assumptions
- 2. Executive Summary
- 2.1. Introduction
- 3. Market Dynamics
- 3.1. Introduction
- 3.2. Market Drivers
- 3.3. Market Restrains
- 3.4. Market Trends
- 4. Market Factor Analysis
- 4.1. Porters Five Forces
- 4.2. Supply/Value Chain
- 4.3. PESTEL analysis
- 4.4. Market Entropy
- 4.5. Patent/Trademark Analysis
- 5. Global Content Protection Analysis, Insights and Forecast, 2020-2032
- 5.1. Market Analysis, Insights and Forecast - by Application
- 5.1.1. Internet Services
- 5.1.2. Media Content
- 5.1.3. Others
- 5.2. Market Analysis, Insights and Forecast - by Types
- 5.2.1. Digital Rights Management (DRM)
- 5.2.2. Conditional Access System (CAS)
- 5.2.3. Watermarking
- 5.2.4. Others
- 5.3. Market Analysis, Insights and Forecast - by Region
- 5.3.1. North America
- 5.3.2. South America
- 5.3.3. Europe
- 5.3.4. Middle East & Africa
- 5.3.5. Asia Pacific
- 5.1. Market Analysis, Insights and Forecast - by Application
- 6. North America Content Protection Analysis, Insights and Forecast, 2020-2032
- 6.1. Market Analysis, Insights and Forecast - by Application
- 6.1.1. Internet Services
- 6.1.2. Media Content
- 6.1.3. Others
- 6.2. Market Analysis, Insights and Forecast - by Types
- 6.2.1. Digital Rights Management (DRM)
- 6.2.2. Conditional Access System (CAS)
- 6.2.3. Watermarking
- 6.2.4. Others
- 6.1. Market Analysis, Insights and Forecast - by Application
- 7. South America Content Protection Analysis, Insights and Forecast, 2020-2032
- 7.1. Market Analysis, Insights and Forecast - by Application
- 7.1.1. Internet Services
- 7.1.2. Media Content
- 7.1.3. Others
- 7.2. Market Analysis, Insights and Forecast - by Types
- 7.2.1. Digital Rights Management (DRM)
- 7.2.2. Conditional Access System (CAS)
- 7.2.3. Watermarking
- 7.2.4. Others
- 7.1. Market Analysis, Insights and Forecast - by Application
- 8. Europe Content Protection Analysis, Insights and Forecast, 2020-2032
- 8.1. Market Analysis, Insights and Forecast - by Application
- 8.1.1. Internet Services
- 8.1.2. Media Content
- 8.1.3. Others
- 8.2. Market Analysis, Insights and Forecast - by Types
- 8.2.1. Digital Rights Management (DRM)
- 8.2.2. Conditional Access System (CAS)
- 8.2.3. Watermarking
- 8.2.4. Others
- 8.1. Market Analysis, Insights and Forecast - by Application
- 9. Middle East & Africa Content Protection Analysis, Insights and Forecast, 2020-2032
- 9.1. Market Analysis, Insights and Forecast - by Application
- 9.1.1. Internet Services
- 9.1.2. Media Content
- 9.1.3. Others
- 9.2. Market Analysis, Insights and Forecast - by Types
- 9.2.1. Digital Rights Management (DRM)
- 9.2.2. Conditional Access System (CAS)
- 9.2.3. Watermarking
- 9.2.4. Others
- 9.1. Market Analysis, Insights and Forecast - by Application
- 10. Asia Pacific Content Protection Analysis, Insights and Forecast, 2020-2032
- 10.1. Market Analysis, Insights and Forecast - by Application
- 10.1.1. Internet Services
- 10.1.2. Media Content
- 10.1.3. Others
- 10.2. Market Analysis, Insights and Forecast - by Types
- 10.2.1. Digital Rights Management (DRM)
- 10.2.2. Conditional Access System (CAS)
- 10.2.3. Watermarking
- 10.2.4. Others
- 10.1. Market Analysis, Insights and Forecast - by Application
- 11. Competitive Analysis
- 11.1. Global Market Share Analysis 2025
- 11.2. Company Profiles
- 11.2.1 Cisco Systems
- 11.2.1.1. Overview
- 11.2.1.2. Products
- 11.2.1.3. SWOT Analysis
- 11.2.1.4. Recent Developments
- 11.2.1.5. Financials (Based on Availability)
- 11.2.2 Microsoft
- 11.2.2.1. Overview
- 11.2.2.2. Products
- 11.2.2.3. SWOT Analysis
- 11.2.2.4. Recent Developments
- 11.2.2.5. Financials (Based on Availability)
- 11.2.3 Google
- 11.2.3.1. Overview
- 11.2.3.2. Products
- 11.2.3.3. SWOT Analysis
- 11.2.3.4. Recent Developments
- 11.2.3.5. Financials (Based on Availability)
- 11.2.4 Apple
- 11.2.4.1. Overview
- 11.2.4.2. Products
- 11.2.4.3. SWOT Analysis
- 11.2.4.4. Recent Developments
- 11.2.4.5. Financials (Based on Availability)
- 11.2.5 Dell EMC
- 11.2.5.1. Overview
- 11.2.5.2. Products
- 11.2.5.3. SWOT Analysis
- 11.2.5.4. Recent Developments
- 11.2.5.5. Financials (Based on Availability)
- 11.2.6 Ericsson
- 11.2.6.1. Overview
- 11.2.6.2. Products
- 11.2.6.3. SWOT Analysis
- 11.2.6.4. Recent Developments
- 11.2.6.5. Financials (Based on Availability)
- 11.2.7 Adobe Systems
- 11.2.7.1. Overview
- 11.2.7.2. Products
- 11.2.7.3. SWOT Analysis
- 11.2.7.4. Recent Developments
- 11.2.7.5. Financials (Based on Availability)
- 11.2.8 China Digital TV Holding
- 11.2.8.1. Overview
- 11.2.8.2. Products
- 11.2.8.3. SWOT Analysis
- 11.2.8.4. Recent Developments
- 11.2.8.5. Financials (Based on Availability)
- 11.2.9 ZTE
- 11.2.9.1. Overview
- 11.2.9.2. Products
- 11.2.9.3. SWOT Analysis
- 11.2.9.4. Recent Developments
- 11.2.9.5. Financials (Based on Availability)
- 11.2.10 Verimatrix
- 11.2.10.1. Overview
- 11.2.10.2. Products
- 11.2.10.3. SWOT Analysis
- 11.2.10.4. Recent Developments
- 11.2.10.5. Financials (Based on Availability)
- 11.2.11 Digimarc
- 11.2.11.1. Overview
- 11.2.11.2. Products
- 11.2.11.3. SWOT Analysis
- 11.2.11.4. Recent Developments
- 11.2.11.5. Financials (Based on Availability)
- 11.2.12 Irdeto
- 11.2.12.1. Overview
- 11.2.12.2. Products
- 11.2.12.3. SWOT Analysis
- 11.2.12.4. Recent Developments
- 11.2.12.5. Financials (Based on Availability)
- 11.2.13 Kudelski Group
- 11.2.13.1. Overview
- 11.2.13.2. Products
- 11.2.13.3. SWOT Analysis
- 11.2.13.4. Recent Developments
- 11.2.13.5. Financials (Based on Availability)
- 11.2.14 Sony
- 11.2.14.1. Overview
- 11.2.14.2. Products
- 11.2.14.3. SWOT Analysis
- 11.2.14.4. Recent Developments
- 11.2.14.5. Financials (Based on Availability)
- 11.2.15 Verance
- 11.2.15.1. Overview
- 11.2.15.2. Products
- 11.2.15.3. SWOT Analysis
- 11.2.15.4. Recent Developments
- 11.2.15.5. Financials (Based on Availability)
- 11.2.16 BS Conditional Access Systems
- 11.2.16.1. Overview
- 11.2.16.2. Products
- 11.2.16.3. SWOT Analysis
- 11.2.16.4. Recent Developments
- 11.2.16.5. Financials (Based on Availability)
- 11.2.17 Conax
- 11.2.17.1. Overview
- 11.2.17.2. Products
- 11.2.17.3. SWOT Analysis
- 11.2.17.4. Recent Developments
- 11.2.17.5. Financials (Based on Availability)
- 11.2.18 ARRIS International
- 11.2.18.1. Overview
- 11.2.18.2. Products
- 11.2.18.3. SWOT Analysis
- 11.2.18.4. Recent Developments
- 11.2.18.5. Financials (Based on Availability)
- 11.2.19 Wellav Technologies
- 11.2.19.1. Overview
- 11.2.19.2. Products
- 11.2.19.3. SWOT Analysis
- 11.2.19.4. Recent Developments
- 11.2.19.5. Financials (Based on Availability)
- 11.2.1 Cisco Systems
List of Figures
- Figure 1: Global Content Protection Revenue Breakdown (million, %) by Region 2025 & 2033
- Figure 2: North America Content Protection Revenue (million), by Application 2025 & 2033
- Figure 3: North America Content Protection Revenue Share (%), by Application 2025 & 2033
- Figure 4: North America Content Protection Revenue (million), by Types 2025 & 2033
- Figure 5: North America Content Protection Revenue Share (%), by Types 2025 & 2033
- Figure 6: North America Content Protection Revenue (million), by Country 2025 & 2033
- Figure 7: North America Content Protection Revenue Share (%), by Country 2025 & 2033
- Figure 8: South America Content Protection Revenue (million), by Application 2025 & 2033
- Figure 9: South America Content Protection Revenue Share (%), by Application 2025 & 2033
- Figure 10: South America Content Protection Revenue (million), by Types 2025 & 2033
- Figure 11: South America Content Protection Revenue Share (%), by Types 2025 & 2033
- Figure 12: South America Content Protection Revenue (million), by Country 2025 & 2033
- Figure 13: South America Content Protection Revenue Share (%), by Country 2025 & 2033
- Figure 14: Europe Content Protection Revenue (million), by Application 2025 & 2033
- Figure 15: Europe Content Protection Revenue Share (%), by Application 2025 & 2033
- Figure 16: Europe Content Protection Revenue (million), by Types 2025 & 2033
- Figure 17: Europe Content Protection Revenue Share (%), by Types 2025 & 2033
- Figure 18: Europe Content Protection Revenue (million), by Country 2025 & 2033
- Figure 19: Europe Content Protection Revenue Share (%), by Country 2025 & 2033
- Figure 20: Middle East & Africa Content Protection Revenue (million), by Application 2025 & 2033
- Figure 21: Middle East & Africa Content Protection Revenue Share (%), by Application 2025 & 2033
- Figure 22: Middle East & Africa Content Protection Revenue (million), by Types 2025 & 2033
- Figure 23: Middle East & Africa Content Protection Revenue Share (%), by Types 2025 & 2033
- Figure 24: Middle East & Africa Content Protection Revenue (million), by Country 2025 & 2033
- Figure 25: Middle East & Africa Content Protection Revenue Share (%), by Country 2025 & 2033
- Figure 26: Asia Pacific Content Protection Revenue (million), by Application 2025 & 2033
- Figure 27: Asia Pacific Content Protection Revenue Share (%), by Application 2025 & 2033
- Figure 28: Asia Pacific Content Protection Revenue (million), by Types 2025 & 2033
- Figure 29: Asia Pacific Content Protection Revenue Share (%), by Types 2025 & 2033
- Figure 30: Asia Pacific Content Protection Revenue (million), by Country 2025 & 2033
- Figure 31: Asia Pacific Content Protection Revenue Share (%), by Country 2025 & 2033
List of Tables
- Table 1: Global Content Protection Revenue million Forecast, by Application 2020 & 2033
- Table 2: Global Content Protection Revenue million Forecast, by Types 2020 & 2033
- Table 3: Global Content Protection Revenue million Forecast, by Region 2020 & 2033
- Table 4: Global Content Protection Revenue million Forecast, by Application 2020 & 2033
- Table 5: Global Content Protection Revenue million Forecast, by Types 2020 & 2033
- Table 6: Global Content Protection Revenue million Forecast, by Country 2020 & 2033
- Table 7: United States Content Protection Revenue (million) Forecast, by Application 2020 & 2033
- Table 8: Canada Content Protection Revenue (million) Forecast, by Application 2020 & 2033
- Table 9: Mexico Content Protection Revenue (million) Forecast, by Application 2020 & 2033
- Table 10: Global Content Protection Revenue million Forecast, by Application 2020 & 2033
- Table 11: Global Content Protection Revenue million Forecast, by Types 2020 & 2033
- Table 12: Global Content Protection Revenue million Forecast, by Country 2020 & 2033
- Table 13: Brazil Content Protection Revenue (million) Forecast, by Application 2020 & 2033
- Table 14: Argentina Content Protection Revenue (million) Forecast, by Application 2020 & 2033
- Table 15: Rest of South America Content Protection Revenue (million) Forecast, by Application 2020 & 2033
- Table 16: Global Content Protection Revenue million Forecast, by Application 2020 & 2033
- Table 17: Global Content Protection Revenue million Forecast, by Types 2020 & 2033
- Table 18: Global Content Protection Revenue million Forecast, by Country 2020 & 2033
- Table 19: United Kingdom Content Protection Revenue (million) Forecast, by Application 2020 & 2033
- Table 20: Germany Content Protection Revenue (million) Forecast, by Application 2020 & 2033
- Table 21: France Content Protection Revenue (million) Forecast, by Application 2020 & 2033
- Table 22: Italy Content Protection Revenue (million) Forecast, by Application 2020 & 2033
- Table 23: Spain Content Protection Revenue (million) Forecast, by Application 2020 & 2033
- Table 24: Russia Content Protection Revenue (million) Forecast, by Application 2020 & 2033
- Table 25: Benelux Content Protection Revenue (million) Forecast, by Application 2020 & 2033
- Table 26: Nordics Content Protection Revenue (million) Forecast, by Application 2020 & 2033
- Table 27: Rest of Europe Content Protection Revenue (million) Forecast, by Application 2020 & 2033
- Table 28: Global Content Protection Revenue million Forecast, by Application 2020 & 2033
- Table 29: Global Content Protection Revenue million Forecast, by Types 2020 & 2033
- Table 30: Global Content Protection Revenue million Forecast, by Country 2020 & 2033
- Table 31: Turkey Content Protection Revenue (million) Forecast, by Application 2020 & 2033
- Table 32: Israel Content Protection Revenue (million) Forecast, by Application 2020 & 2033
- Table 33: GCC Content Protection Revenue (million) Forecast, by Application 2020 & 2033
- Table 34: North Africa Content Protection Revenue (million) Forecast, by Application 2020 & 2033
- Table 35: South Africa Content Protection Revenue (million) Forecast, by Application 2020 & 2033
- Table 36: Rest of Middle East & Africa Content Protection Revenue (million) Forecast, by Application 2020 & 2033
- Table 37: Global Content Protection Revenue million Forecast, by Application 2020 & 2033
- Table 38: Global Content Protection Revenue million Forecast, by Types 2020 & 2033
- Table 39: Global Content Protection Revenue million Forecast, by Country 2020 & 2033
- Table 40: China Content Protection Revenue (million) Forecast, by Application 2020 & 2033
- Table 41: India Content Protection Revenue (million) Forecast, by Application 2020 & 2033
- Table 42: Japan Content Protection Revenue (million) Forecast, by Application 2020 & 2033
- Table 43: South Korea Content Protection Revenue (million) Forecast, by Application 2020 & 2033
- Table 44: ASEAN Content Protection Revenue (million) Forecast, by Application 2020 & 2033
- Table 45: Oceania Content Protection Revenue (million) Forecast, by Application 2020 & 2033
- Table 46: Rest of Asia Pacific Content Protection Revenue (million) Forecast, by Application 2020 & 2033
Frequently Asked Questions
1. What is the projected Compound Annual Growth Rate (CAGR) of the Content Protection?
The projected CAGR is approximately 5.5%.
2. Which companies are prominent players in the Content Protection?
Key companies in the market include Cisco Systems, Microsoft, Google, Apple, Dell EMC, Ericsson, Adobe Systems, China Digital TV Holding, ZTE, Verimatrix, Digimarc, Irdeto, Kudelski Group, Sony, Verance, BS Conditional Access Systems, Conax, ARRIS International, Wellav Technologies.
3. What are the main segments of the Content Protection?
The market segments include Application, Types.
4. Can you provide details about the market size?
The market size is estimated to be USD 1271.7 million as of 2022.
5. What are some drivers contributing to market growth?
N/A
6. What are the notable trends driving market growth?
N/A
7. Are there any restraints impacting market growth?
N/A
8. Can you provide examples of recent developments in the market?
N/A
9. What pricing options are available for accessing the report?
Pricing options include single-user, multi-user, and enterprise licenses priced at USD 4900.00, USD 7350.00, and USD 9800.00 respectively.
10. Is the market size provided in terms of value or volume?
The market size is provided in terms of value, measured in million.
11. Are there any specific market keywords associated with the report?
Yes, the market keyword associated with the report is "Content Protection," which aids in identifying and referencing the specific market segment covered.
12. How do I determine which pricing option suits my needs best?
The pricing options vary based on user requirements and access needs. Individual users may opt for single-user licenses, while businesses requiring broader access may choose multi-user or enterprise licenses for cost-effective access to the report.
13. Are there any additional resources or data provided in the Content Protection report?
While the report offers comprehensive insights, it's advisable to review the specific contents or supplementary materials provided to ascertain if additional resources or data are available.
14. How can I stay updated on further developments or reports in the Content Protection?
To stay informed about further developments, trends, and reports in the Content Protection, consider subscribing to industry newsletters, following relevant companies and organizations, or regularly checking reputable industry news sources and publications.
Methodology
Step 1 - Identification of Relevant Samples Size from Population Database


Step 2 - Approaches for Defining Global Market Size (Value, Volume* & Price*)

Note*: In applicable scenarios
Step 3 - Data Sources
Primary Research
- Web Analytics
- Survey Reports
- Research Institute
- Latest Research Reports
- Opinion Leaders
Secondary Research
- Annual Reports
- White Paper
- Latest Press Release
- Industry Association
- Paid Database
- Investor Presentations

Step 4 - Data Triangulation
Involves using different sources of information in order to increase the validity of a study
These sources are likely to be stakeholders in a program - participants, other researchers, program staff, other community members, and so on.
Then we put all data in single framework & apply various statistical tools to find out the dynamic on the market.
During the analysis stage, feedback from the stakeholder groups would be compared to determine areas of agreement as well as areas of divergence