

Key Insights
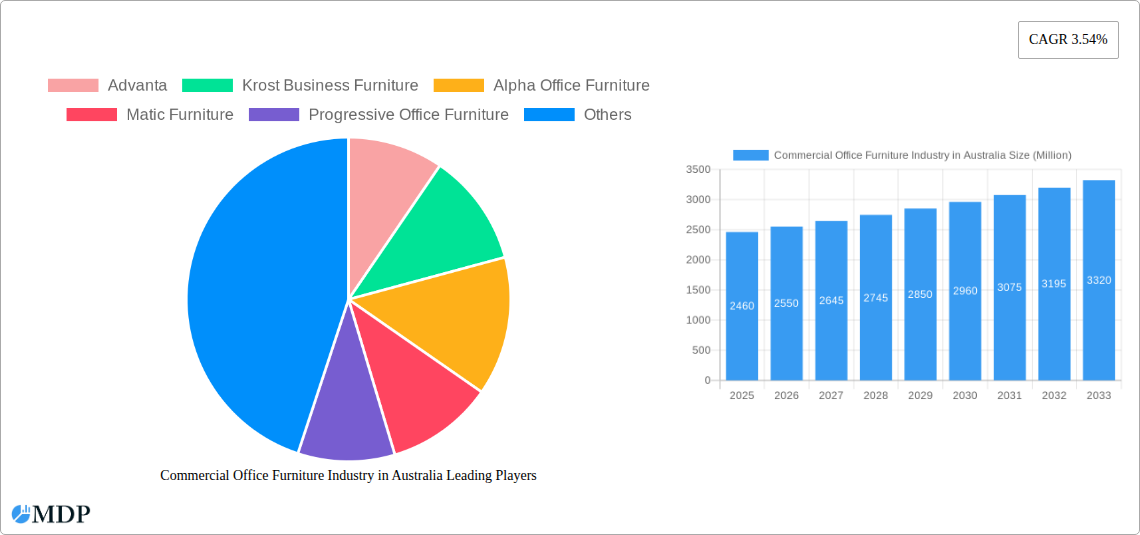
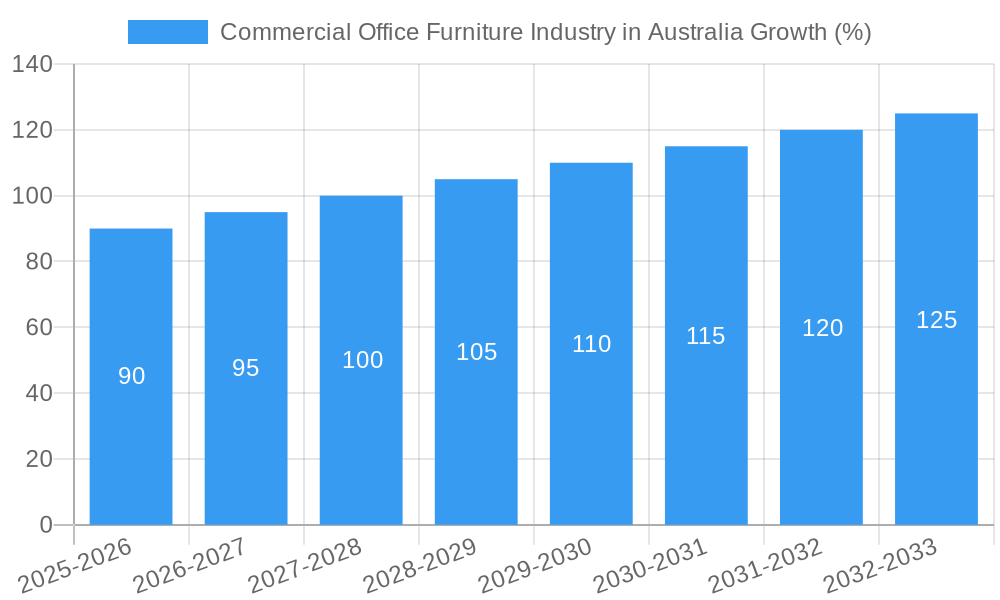
The Australian commercial office furniture market, valued at $2.46 billion in 2025, is projected to experience steady growth, with a compound annual growth rate (CAGR) of 3.54% from 2025 to 2033. This growth is driven by several key factors. The increasing number of businesses establishing offices in Australia, fueled by a robust economy and expanding sectors like technology and finance, is a significant contributor. Furthermore, the trend towards creating more collaborative and ergonomic workspaces is boosting demand for modern office furniture. Companies are investing in high-quality, adaptable furniture to enhance employee well-being and productivity, driving sales of products like ergonomic office chairs, adaptable desks, and collaborative work tables. While the online distribution channel is gaining traction, offline channels remain dominant, benefiting established furniture retailers with strong physical presences. However, the market faces challenges, including fluctuating raw material costs and global supply chain disruptions, which can impact pricing and availability. Competition is relatively high among both domestic and international players, necessitating strategic marketing and product differentiation. Segmentation within the market reveals a strong preference for wood and metal materials across diverse product categories, including seating, storage, and tables.
The forecast period (2025-2033) suggests a continued, albeit moderate, expansion of the Australian commercial office furniture market. This growth will likely be driven by ongoing investment in office infrastructure, particularly in major cities and business hubs. Continued economic stability and a focus on improving office environments are critical factors contributing to this positive outlook. However, potential economic downturns or shifts in remote work patterns could influence the market's trajectory. Therefore, continuous adaptation to changing market dynamics and a focus on sustainability and innovative designs will be essential for success in this competitive landscape. Companies are expected to focus on enhancing their online presence and improving supply chain resilience to mitigate potential disruptions.
Unlock the Potential: Australia's Commercial Office Furniture Market Report (2019-2033)
This comprehensive report provides an in-depth analysis of the Australian commercial office furniture market, offering invaluable insights for stakeholders seeking to navigate this dynamic sector. Covering the period from 2019 to 2033, with a focus on 2025, this report unveils market trends, competitive landscapes, and future growth opportunities. Benefit from detailed segmentation analysis across materials (wood, metal, plastic, others), product types (seating, storage, tables, others), and distribution channels (offline, online). Discover key players like Advanta, Krost Business Furniture, and Alpha Office Furniture, and understand their strategic positioning within a market valued at $XX Million in 2025.
Commercial Office Furniture Industry in Australia Market Dynamics & Concentration
The Australian commercial office furniture market exhibits a moderately concentrated structure, with a handful of major players controlling a significant market share. While precise figures for 2025 market share are unavailable, estimations suggest that the top five players hold approximately xx% of the market. Innovation is driven by a growing demand for ergonomic designs, sustainable materials, and smart office solutions. Regulatory frameworks, particularly those related to workplace safety and environmental standards, significantly influence product design and manufacturing processes. The market also witnesses competition from substitute products such as modular furniture systems and flexible workspace solutions. End-user trends favor adaptable and collaborative workspaces, impacting demand for specific furniture types. M&A activity in recent years has been moderate, with an estimated xx M&A deals occurring between 2019 and 2024, primarily focused on expanding market reach and product portfolios.
- Market Concentration: Moderately concentrated, top 5 players holding approximately xx% in 2025 (estimated).
- Innovation Drivers: Ergonomics, sustainability, smart office technologies.
- Regulatory Framework: Workplace safety, environmental standards.
- Product Substitutes: Modular furniture, flexible workspace solutions.
- End-User Trends: Adaptable and collaborative workspaces.
- M&A Activity (2019-2024): Approximately xx deals.
Commercial Office Furniture Industry in Australia Industry Trends & Analysis
The Australian commercial office furniture market is projected to experience a Compound Annual Growth Rate (CAGR) of xx% during the forecast period (2025-2033). This growth is fueled by several factors, including a recovering economy, increasing urbanization, and a rising demand for modern and functional office spaces. Technological disruptions, such as the integration of smart technology into furniture and the adoption of e-commerce platforms, are reshaping the industry landscape. Consumer preferences are shifting towards sustainable and ethically sourced materials, influencing product development and supply chain strategies. The competitive dynamics are characterized by both price competition and product differentiation, with leading players focusing on enhancing their brand image and providing value-added services. Market penetration of online sales channels is steadily increasing, although offline channels still retain a significant share.
Leading Markets & Segments in Commercial Office Furniture Industry in Australia
The largest segment in the Australian commercial office furniture market in 2025 is estimated to be Seating, specifically office chairs, accounting for approximately xx% of the total market value. This is driven by the increasing emphasis on employee wellbeing and the need for ergonomic seating solutions. The major distribution channel is Offline with xx% while online is steadily increasing with xx% in 2025. Key drivers for the dominance of seating include:
- Strong Emphasis on Employee Wellbeing: Increased awareness of ergonomics and its impact on productivity.
- Growing Office Spaces: Expansion of businesses and development of new office spaces drive demand.
- Hybrid Work Models: Demand for both home and office chairs.
Wood remains a popular material, favoured for its aesthetic appeal and durability, although metal and other materials (e.g., plastic composites) are gaining traction due to their cost-effectiveness and design flexibility. The largest geographical market is concentrated in the major cities like Sydney and Melbourne, driven by high office density and economic activity.
Commercial Office Furniture Industry in Australia Product Developments
Recent product innovations include the incorporation of smart technology into furniture, such as integrated power outlets and USB charging ports, and the use of advanced materials that enhance durability and sustainability. These developments are aimed at improving workplace efficiency and enhancing user experience, increasing market fit and competitiveness. The industry is also seeing a trend towards modular and customizable furniture solutions, allowing businesses to adapt their office layouts to their evolving needs.
Key Drivers of Commercial Office Furniture Industry in Australia Growth
Growth in the Australian commercial office furniture market is primarily driven by economic factors, such as increased construction activity and business investment. Technological advancements, such as the adoption of smart office technologies, are also boosting demand for innovative furniture solutions. Furthermore, favorable government policies and regulations promoting sustainable and ergonomic workspaces contribute to market expansion.
Challenges in the Commercial Office Furniture Industry in Australia Market
The Australian commercial office furniture market faces challenges such as fluctuating raw material prices, impacting production costs. Supply chain disruptions can lead to delays and increased costs. Intense competition, particularly from international manufacturers offering lower prices, presents a significant pressure on profitability. Furthermore, changing consumer preferences require continuous innovation and adaptation to maintain market share. These factors collectively can reduce the overall market growth by an estimated xx% annually.
Emerging Opportunities in Commercial Office Furniture Industry in Australia
The increasing adoption of flexible work arrangements and the growing popularity of co-working spaces present significant opportunities for the Australian commercial office furniture market. The demand for modular and adaptable furniture solutions is expected to rise considerably. Technological advancements, such as the integration of smart technology and sustainable materials, offer further opportunities for product differentiation and market expansion. Strategic partnerships with technology companies and interior designers can provide a competitive edge.
Leading Players in the Commercial Office Furniture Industry in Australia Sector
- Advanta
- Krost Business Furniture
- Alpha Office Furniture
- Matic Furniture
- Progressive Office Furniture
- AMS Furniture
- Aspen Commercial Interiors
- Emanate Design
- Diami
- Burgtec
- Fursys
- BFX Furniture
Key Milestones in Commercial Office Furniture Industry in Australia Industry
- 2021: Increased adoption of ergonomic seating solutions due to work from home surge.
- 2022: Several major players launched sustainable furniture lines.
- 2023: Significant investment in automated manufacturing processes by key players.
- 2024: Growing trend towards modular furniture systems and flexible workspaces.
Strategic Outlook for Commercial Office Furniture Industry in Australia Market
The Australian commercial office furniture market holds substantial long-term growth potential. Continued focus on innovation, sustainable practices, and strategic partnerships will be crucial for success. The integration of technology and the adoption of flexible work models will reshape the market landscape, creating opportunities for companies that can adapt quickly and provide solutions catering to evolving consumer needs. This positive outlook indicates an expected market value of $XX Million by 2033.
Commercial Office Furniture Industry in Australia Segmentation
-
1. Material
- 1.1. Wood
- 1.2. Metal
- 1.3. Plastic
- 1.4. Other Materials
-
2. Product
- 2.1. Seating
- 2.2. Storage Units (Bins & Shelves, Cabinets, Others)
- 2.3. Tables (
-
3. Distribution Channel
- 3.1. Offline
- 3.2. Online
Commercial Office Furniture Industry in Australia Segmentation By Geography
-
1. North America
- 1.1. United States
- 1.2. Canada
- 1.3. Mexico
-
2. South America
- 2.1. Brazil
- 2.2. Argentina
- 2.3. Rest of South America
-
3. Europe
- 3.1. United Kingdom
- 3.2. Germany
- 3.3. France
- 3.4. Italy
- 3.5. Spain
- 3.6. Russia
- 3.7. Benelux
- 3.8. Nordics
- 3.9. Rest of Europe
-
4. Middle East & Africa
- 4.1. Turkey
- 4.2. Israel
- 4.3. GCC
- 4.4. North Africa
- 4.5. South Africa
- 4.6. Rest of Middle East & Africa
-
5. Asia Pacific
- 5.1. China
- 5.2. India
- 5.3. Japan
- 5.4. South Korea
- 5.5. ASEAN
- 5.6. Oceania
- 5.7. Rest of Asia Pacific
Commercial Office Furniture Industry in Australia REPORT HIGHLIGHTS
| Aspects | Details |
|---|---|
| Study Period | 2019-2033 |
| Base Year | 2024 |
| Estimated Year | 2025 |
| Forecast Period | 2025-2033 |
| Historical Period | 2019-2024 |
| Growth Rate | CAGR of 3.54% from 2019-2033 |
| Segmentation |
|
Table of Contents
- 1. Introduction
- 1.1. Research Scope
- 1.2. Market Segmentation
- 1.3. Research Methodology
- 1.4. Definitions and Assumptions
- 2. Executive Summary
- 2.1. Introduction
- 3. Market Dynamics
- 3.1. Introduction
- 3.2. Market Drivers
- 3.2.1. Rise in New Offices in South Korea; Wide Range of Design Broadening Consumer Base
- 3.3. Market Restrains
- 3.3.1. Fluctuations in Raw Material Prices and Rise in Shipping Prices; Intense Competition from Both Local and International Players
- 3.4. Market Trends
- 3.4.1. Rise in Commercial Space Construction
- 4. Market Factor Analysis
- 4.1. Porters Five Forces
- 4.2. Supply/Value Chain
- 4.3. PESTEL analysis
- 4.4. Market Entropy
- 4.5. Patent/Trademark Analysis
- 5. Global Commercial Office Furniture Industry in Australia Analysis, Insights and Forecast, 2019-2031
- 5.1. Market Analysis, Insights and Forecast - by Material
- 5.1.1. Wood
- 5.1.2. Metal
- 5.1.3. Plastic
- 5.1.4. Other Materials
- 5.2. Market Analysis, Insights and Forecast - by Product
- 5.2.1. Seating
- 5.2.2. Storage Units (Bins & Shelves, Cabinets, Others)
- 5.2.3. Tables (
- 5.3. Market Analysis, Insights and Forecast - by Distribution Channel
- 5.3.1. Offline
- 5.3.2. Online
- 5.4. Market Analysis, Insights and Forecast - by Region
- 5.4.1. North America
- 5.4.2. South America
- 5.4.3. Europe
- 5.4.4. Middle East & Africa
- 5.4.5. Asia Pacific
- 5.1. Market Analysis, Insights and Forecast - by Material
- 6. North America Commercial Office Furniture Industry in Australia Analysis, Insights and Forecast, 2019-2031
- 6.1. Market Analysis, Insights and Forecast - by Material
- 6.1.1. Wood
- 6.1.2. Metal
- 6.1.3. Plastic
- 6.1.4. Other Materials
- 6.2. Market Analysis, Insights and Forecast - by Product
- 6.2.1. Seating
- 6.2.2. Storage Units (Bins & Shelves, Cabinets, Others)
- 6.2.3. Tables (
- 6.3. Market Analysis, Insights and Forecast - by Distribution Channel
- 6.3.1. Offline
- 6.3.2. Online
- 6.1. Market Analysis, Insights and Forecast - by Material
- 7. South America Commercial Office Furniture Industry in Australia Analysis, Insights and Forecast, 2019-2031
- 7.1. Market Analysis, Insights and Forecast - by Material
- 7.1.1. Wood
- 7.1.2. Metal
- 7.1.3. Plastic
- 7.1.4. Other Materials
- 7.2. Market Analysis, Insights and Forecast - by Product
- 7.2.1. Seating
- 7.2.2. Storage Units (Bins & Shelves, Cabinets, Others)
- 7.2.3. Tables (
- 7.3. Market Analysis, Insights and Forecast - by Distribution Channel
- 7.3.1. Offline
- 7.3.2. Online
- 7.1. Market Analysis, Insights and Forecast - by Material
- 8. Europe Commercial Office Furniture Industry in Australia Analysis, Insights and Forecast, 2019-2031
- 8.1. Market Analysis, Insights and Forecast - by Material
- 8.1.1. Wood
- 8.1.2. Metal
- 8.1.3. Plastic
- 8.1.4. Other Materials
- 8.2. Market Analysis, Insights and Forecast - by Product
- 8.2.1. Seating
- 8.2.2. Storage Units (Bins & Shelves, Cabinets, Others)
- 8.2.3. Tables (
- 8.3. Market Analysis, Insights and Forecast - by Distribution Channel
- 8.3.1. Offline
- 8.3.2. Online
- 8.1. Market Analysis, Insights and Forecast - by Material
- 9. Middle East & Africa Commercial Office Furniture Industry in Australia Analysis, Insights and Forecast, 2019-2031
- 9.1. Market Analysis, Insights and Forecast - by Material
- 9.1.1. Wood
- 9.1.2. Metal
- 9.1.3. Plastic
- 9.1.4. Other Materials
- 9.2. Market Analysis, Insights and Forecast - by Product
- 9.2.1. Seating
- 9.2.2. Storage Units (Bins & Shelves, Cabinets, Others)
- 9.2.3. Tables (
- 9.3. Market Analysis, Insights and Forecast - by Distribution Channel
- 9.3.1. Offline
- 9.3.2. Online
- 9.1. Market Analysis, Insights and Forecast - by Material
- 10. Asia Pacific Commercial Office Furniture Industry in Australia Analysis, Insights and Forecast, 2019-2031
- 10.1. Market Analysis, Insights and Forecast - by Material
- 10.1.1. Wood
- 10.1.2. Metal
- 10.1.3. Plastic
- 10.1.4. Other Materials
- 10.2. Market Analysis, Insights and Forecast - by Product
- 10.2.1. Seating
- 10.2.2. Storage Units (Bins & Shelves, Cabinets, Others)
- 10.2.3. Tables (
- 10.3. Market Analysis, Insights and Forecast - by Distribution Channel
- 10.3.1. Offline
- 10.3.2. Online
- 10.1. Market Analysis, Insights and Forecast - by Material
- 11. Competitive Analysis
- 11.1. Global Market Share Analysis 2024
- 11.2. Company Profiles
- 11.2.1 Advanta
- 11.2.1.1. Overview
- 11.2.1.2. Products
- 11.2.1.3. SWOT Analysis
- 11.2.1.4. Recent Developments
- 11.2.1.5. Financials (Based on Availability)
- 11.2.2 Krost Business Furniture
- 11.2.2.1. Overview
- 11.2.2.2. Products
- 11.2.2.3. SWOT Analysis
- 11.2.2.4. Recent Developments
- 11.2.2.5. Financials (Based on Availability)
- 11.2.3 Alpha Office Furniture
- 11.2.3.1. Overview
- 11.2.3.2. Products
- 11.2.3.3. SWOT Analysis
- 11.2.3.4. Recent Developments
- 11.2.3.5. Financials (Based on Availability)
- 11.2.4 Matic Furniture
- 11.2.4.1. Overview
- 11.2.4.2. Products
- 11.2.4.3. SWOT Analysis
- 11.2.4.4. Recent Developments
- 11.2.4.5. Financials (Based on Availability)
- 11.2.5 Progressive Office Furniture
- 11.2.5.1. Overview
- 11.2.5.2. Products
- 11.2.5.3. SWOT Analysis
- 11.2.5.4. Recent Developments
- 11.2.5.5. Financials (Based on Availability)
- 11.2.6 AMS Furniture
- 11.2.6.1. Overview
- 11.2.6.2. Products
- 11.2.6.3. SWOT Analysis
- 11.2.6.4. Recent Developments
- 11.2.6.5. Financials (Based on Availability)
- 11.2.7 Aspen Commercial Interiors
- 11.2.7.1. Overview
- 11.2.7.2. Products
- 11.2.7.3. SWOT Analysis
- 11.2.7.4. Recent Developments
- 11.2.7.5. Financials (Based on Availability)
- 11.2.8 Emanate Design
- 11.2.8.1. Overview
- 11.2.8.2. Products
- 11.2.8.3. SWOT Analysis
- 11.2.8.4. Recent Developments
- 11.2.8.5. Financials (Based on Availability)
- 11.2.9 Diami
- 11.2.9.1. Overview
- 11.2.9.2. Products
- 11.2.9.3. SWOT Analysis
- 11.2.9.4. Recent Developments
- 11.2.9.5. Financials (Based on Availability)
- 11.2.10 Burgtec
- 11.2.10.1. Overview
- 11.2.10.2. Products
- 11.2.10.3. SWOT Analysis
- 11.2.10.4. Recent Developments
- 11.2.10.5. Financials (Based on Availability)
- 11.2.11 Fursys
- 11.2.11.1. Overview
- 11.2.11.2. Products
- 11.2.11.3. SWOT Analysis
- 11.2.11.4. Recent Developments
- 11.2.11.5. Financials (Based on Availability)
- 11.2.12 BFX Furniture
- 11.2.12.1. Overview
- 11.2.12.2. Products
- 11.2.12.3. SWOT Analysis
- 11.2.12.4. Recent Developments
- 11.2.12.5. Financials (Based on Availability)
- 11.2.1 Advanta
List of Figures
- Figure 1: Global Commercial Office Furniture Industry in Australia Revenue Breakdown (Million, %) by Region 2024 & 2032
- Figure 2: Global Commercial Office Furniture Industry in Australia Volume Breakdown (K Unit, %) by Region 2024 & 2032
- Figure 3: Australia Commercial Office Furniture Industry in Australia Revenue (Million), by Country 2024 & 2032
- Figure 4: Australia Commercial Office Furniture Industry in Australia Volume (K Unit), by Country 2024 & 2032
- Figure 5: Australia Commercial Office Furniture Industry in Australia Revenue Share (%), by Country 2024 & 2032
- Figure 6: Australia Commercial Office Furniture Industry in Australia Volume Share (%), by Country 2024 & 2032
- Figure 7: North America Commercial Office Furniture Industry in Australia Revenue (Million), by Material 2024 & 2032
- Figure 8: North America Commercial Office Furniture Industry in Australia Volume (K Unit), by Material 2024 & 2032
- Figure 9: North America Commercial Office Furniture Industry in Australia Revenue Share (%), by Material 2024 & 2032
- Figure 10: North America Commercial Office Furniture Industry in Australia Volume Share (%), by Material 2024 & 2032
- Figure 11: North America Commercial Office Furniture Industry in Australia Revenue (Million), by Product 2024 & 2032
- Figure 12: North America Commercial Office Furniture Industry in Australia Volume (K Unit), by Product 2024 & 2032
- Figure 13: North America Commercial Office Furniture Industry in Australia Revenue Share (%), by Product 2024 & 2032
- Figure 14: North America Commercial Office Furniture Industry in Australia Volume Share (%), by Product 2024 & 2032
- Figure 15: North America Commercial Office Furniture Industry in Australia Revenue (Million), by Distribution Channel 2024 & 2032
- Figure 16: North America Commercial Office Furniture Industry in Australia Volume (K Unit), by Distribution Channel 2024 & 2032
- Figure 17: North America Commercial Office Furniture Industry in Australia Revenue Share (%), by Distribution Channel 2024 & 2032
- Figure 18: North America Commercial Office Furniture Industry in Australia Volume Share (%), by Distribution Channel 2024 & 2032
- Figure 19: North America Commercial Office Furniture Industry in Australia Revenue (Million), by Country 2024 & 2032
- Figure 20: North America Commercial Office Furniture Industry in Australia Volume (K Unit), by Country 2024 & 2032
- Figure 21: North America Commercial Office Furniture Industry in Australia Revenue Share (%), by Country 2024 & 2032
- Figure 22: North America Commercial Office Furniture Industry in Australia Volume Share (%), by Country 2024 & 2032
- Figure 23: South America Commercial Office Furniture Industry in Australia Revenue (Million), by Material 2024 & 2032
- Figure 24: South America Commercial Office Furniture Industry in Australia Volume (K Unit), by Material 2024 & 2032
- Figure 25: South America Commercial Office Furniture Industry in Australia Revenue Share (%), by Material 2024 & 2032
- Figure 26: South America Commercial Office Furniture Industry in Australia Volume Share (%), by Material 2024 & 2032
- Figure 27: South America Commercial Office Furniture Industry in Australia Revenue (Million), by Product 2024 & 2032
- Figure 28: South America Commercial Office Furniture Industry in Australia Volume (K Unit), by Product 2024 & 2032
- Figure 29: South America Commercial Office Furniture Industry in Australia Revenue Share (%), by Product 2024 & 2032
- Figure 30: South America Commercial Office Furniture Industry in Australia Volume Share (%), by Product 2024 & 2032
- Figure 31: South America Commercial Office Furniture Industry in Australia Revenue (Million), by Distribution Channel 2024 & 2032
- Figure 32: South America Commercial Office Furniture Industry in Australia Volume (K Unit), by Distribution Channel 2024 & 2032
- Figure 33: South America Commercial Office Furniture Industry in Australia Revenue Share (%), by Distribution Channel 2024 & 2032
- Figure 34: South America Commercial Office Furniture Industry in Australia Volume Share (%), by Distribution Channel 2024 & 2032
- Figure 35: South America Commercial Office Furniture Industry in Australia Revenue (Million), by Country 2024 & 2032
- Figure 36: South America Commercial Office Furniture Industry in Australia Volume (K Unit), by Country 2024 & 2032
- Figure 37: South America Commercial Office Furniture Industry in Australia Revenue Share (%), by Country 2024 & 2032
- Figure 38: South America Commercial Office Furniture Industry in Australia Volume Share (%), by Country 2024 & 2032
- Figure 39: Europe Commercial Office Furniture Industry in Australia Revenue (Million), by Material 2024 & 2032
- Figure 40: Europe Commercial Office Furniture Industry in Australia Volume (K Unit), by Material 2024 & 2032
- Figure 41: Europe Commercial Office Furniture Industry in Australia Revenue Share (%), by Material 2024 & 2032
- Figure 42: Europe Commercial Office Furniture Industry in Australia Volume Share (%), by Material 2024 & 2032
- Figure 43: Europe Commercial Office Furniture Industry in Australia Revenue (Million), by Product 2024 & 2032
- Figure 44: Europe Commercial Office Furniture Industry in Australia Volume (K Unit), by Product 2024 & 2032
- Figure 45: Europe Commercial Office Furniture Industry in Australia Revenue Share (%), by Product 2024 & 2032
- Figure 46: Europe Commercial Office Furniture Industry in Australia Volume Share (%), by Product 2024 & 2032
- Figure 47: Europe Commercial Office Furniture Industry in Australia Revenue (Million), by Distribution Channel 2024 & 2032
- Figure 48: Europe Commercial Office Furniture Industry in Australia Volume (K Unit), by Distribution Channel 2024 & 2032
- Figure 49: Europe Commercial Office Furniture Industry in Australia Revenue Share (%), by Distribution Channel 2024 & 2032
- Figure 50: Europe Commercial Office Furniture Industry in Australia Volume Share (%), by Distribution Channel 2024 & 2032
- Figure 51: Europe Commercial Office Furniture Industry in Australia Revenue (Million), by Country 2024 & 2032
- Figure 52: Europe Commercial Office Furniture Industry in Australia Volume (K Unit), by Country 2024 & 2032
- Figure 53: Europe Commercial Office Furniture Industry in Australia Revenue Share (%), by Country 2024 & 2032
- Figure 54: Europe Commercial Office Furniture Industry in Australia Volume Share (%), by Country 2024 & 2032
- Figure 55: Middle East & Africa Commercial Office Furniture Industry in Australia Revenue (Million), by Material 2024 & 2032
- Figure 56: Middle East & Africa Commercial Office Furniture Industry in Australia Volume (K Unit), by Material 2024 & 2032
- Figure 57: Middle East & Africa Commercial Office Furniture Industry in Australia Revenue Share (%), by Material 2024 & 2032
- Figure 58: Middle East & Africa Commercial Office Furniture Industry in Australia Volume Share (%), by Material 2024 & 2032
- Figure 59: Middle East & Africa Commercial Office Furniture Industry in Australia Revenue (Million), by Product 2024 & 2032
- Figure 60: Middle East & Africa Commercial Office Furniture Industry in Australia Volume (K Unit), by Product 2024 & 2032
- Figure 61: Middle East & Africa Commercial Office Furniture Industry in Australia Revenue Share (%), by Product 2024 & 2032
- Figure 62: Middle East & Africa Commercial Office Furniture Industry in Australia Volume Share (%), by Product 2024 & 2032
- Figure 63: Middle East & Africa Commercial Office Furniture Industry in Australia Revenue (Million), by Distribution Channel 2024 & 2032
- Figure 64: Middle East & Africa Commercial Office Furniture Industry in Australia Volume (K Unit), by Distribution Channel 2024 & 2032
- Figure 65: Middle East & Africa Commercial Office Furniture Industry in Australia Revenue Share (%), by Distribution Channel 2024 & 2032
- Figure 66: Middle East & Africa Commercial Office Furniture Industry in Australia Volume Share (%), by Distribution Channel 2024 & 2032
- Figure 67: Middle East & Africa Commercial Office Furniture Industry in Australia Revenue (Million), by Country 2024 & 2032
- Figure 68: Middle East & Africa Commercial Office Furniture Industry in Australia Volume (K Unit), by Country 2024 & 2032
- Figure 69: Middle East & Africa Commercial Office Furniture Industry in Australia Revenue Share (%), by Country 2024 & 2032
- Figure 70: Middle East & Africa Commercial Office Furniture Industry in Australia Volume Share (%), by Country 2024 & 2032
- Figure 71: Asia Pacific Commercial Office Furniture Industry in Australia Revenue (Million), by Material 2024 & 2032
- Figure 72: Asia Pacific Commercial Office Furniture Industry in Australia Volume (K Unit), by Material 2024 & 2032
- Figure 73: Asia Pacific Commercial Office Furniture Industry in Australia Revenue Share (%), by Material 2024 & 2032
- Figure 74: Asia Pacific Commercial Office Furniture Industry in Australia Volume Share (%), by Material 2024 & 2032
- Figure 75: Asia Pacific Commercial Office Furniture Industry in Australia Revenue (Million), by Product 2024 & 2032
- Figure 76: Asia Pacific Commercial Office Furniture Industry in Australia Volume (K Unit), by Product 2024 & 2032
- Figure 77: Asia Pacific Commercial Office Furniture Industry in Australia Revenue Share (%), by Product 2024 & 2032
- Figure 78: Asia Pacific Commercial Office Furniture Industry in Australia Volume Share (%), by Product 2024 & 2032
- Figure 79: Asia Pacific Commercial Office Furniture Industry in Australia Revenue (Million), by Distribution Channel 2024 & 2032
- Figure 80: Asia Pacific Commercial Office Furniture Industry in Australia Volume (K Unit), by Distribution Channel 2024 & 2032
- Figure 81: Asia Pacific Commercial Office Furniture Industry in Australia Revenue Share (%), by Distribution Channel 2024 & 2032
- Figure 82: Asia Pacific Commercial Office Furniture Industry in Australia Volume Share (%), by Distribution Channel 2024 & 2032
- Figure 83: Asia Pacific Commercial Office Furniture Industry in Australia Revenue (Million), by Country 2024 & 2032
- Figure 84: Asia Pacific Commercial Office Furniture Industry in Australia Volume (K Unit), by Country 2024 & 2032
- Figure 85: Asia Pacific Commercial Office Furniture Industry in Australia Revenue Share (%), by Country 2024 & 2032
- Figure 86: Asia Pacific Commercial Office Furniture Industry in Australia Volume Share (%), by Country 2024 & 2032
List of Tables
- Table 1: Global Commercial Office Furniture Industry in Australia Revenue Million Forecast, by Region 2019 & 2032
- Table 2: Global Commercial Office Furniture Industry in Australia Volume K Unit Forecast, by Region 2019 & 2032
- Table 3: Global Commercial Office Furniture Industry in Australia Revenue Million Forecast, by Material 2019 & 2032
- Table 4: Global Commercial Office Furniture Industry in Australia Volume K Unit Forecast, by Material 2019 & 2032
- Table 5: Global Commercial Office Furniture Industry in Australia Revenue Million Forecast, by Product 2019 & 2032
- Table 6: Global Commercial Office Furniture Industry in Australia Volume K Unit Forecast, by Product 2019 & 2032
- Table 7: Global Commercial Office Furniture Industry in Australia Revenue Million Forecast, by Distribution Channel 2019 & 2032
- Table 8: Global Commercial Office Furniture Industry in Australia Volume K Unit Forecast, by Distribution Channel 2019 & 2032
- Table 9: Global Commercial Office Furniture Industry in Australia Revenue Million Forecast, by Region 2019 & 2032
- Table 10: Global Commercial Office Furniture Industry in Australia Volume K Unit Forecast, by Region 2019 & 2032
- Table 11: Global Commercial Office Furniture Industry in Australia Revenue Million Forecast, by Country 2019 & 2032
- Table 12: Global Commercial Office Furniture Industry in Australia Volume K Unit Forecast, by Country 2019 & 2032
- Table 13: Global Commercial Office Furniture Industry in Australia Revenue Million Forecast, by Material 2019 & 2032
- Table 14: Global Commercial Office Furniture Industry in Australia Volume K Unit Forecast, by Material 2019 & 2032
- Table 15: Global Commercial Office Furniture Industry in Australia Revenue Million Forecast, by Product 2019 & 2032
- Table 16: Global Commercial Office Furniture Industry in Australia Volume K Unit Forecast, by Product 2019 & 2032
- Table 17: Global Commercial Office Furniture Industry in Australia Revenue Million Forecast, by Distribution Channel 2019 & 2032
- Table 18: Global Commercial Office Furniture Industry in Australia Volume K Unit Forecast, by Distribution Channel 2019 & 2032
- Table 19: Global Commercial Office Furniture Industry in Australia Revenue Million Forecast, by Country 2019 & 2032
- Table 20: Global Commercial Office Furniture Industry in Australia Volume K Unit Forecast, by Country 2019 & 2032
- Table 21: United States Commercial Office Furniture Industry in Australia Revenue (Million) Forecast, by Application 2019 & 2032
- Table 22: United States Commercial Office Furniture Industry in Australia Volume (K Unit) Forecast, by Application 2019 & 2032
- Table 23: Canada Commercial Office Furniture Industry in Australia Revenue (Million) Forecast, by Application 2019 & 2032
- Table 24: Canada Commercial Office Furniture Industry in Australia Volume (K Unit) Forecast, by Application 2019 & 2032
- Table 25: Mexico Commercial Office Furniture Industry in Australia Revenue (Million) Forecast, by Application 2019 & 2032
- Table 26: Mexico Commercial Office Furniture Industry in Australia Volume (K Unit) Forecast, by Application 2019 & 2032
- Table 27: Global Commercial Office Furniture Industry in Australia Revenue Million Forecast, by Material 2019 & 2032
- Table 28: Global Commercial Office Furniture Industry in Australia Volume K Unit Forecast, by Material 2019 & 2032
- Table 29: Global Commercial Office Furniture Industry in Australia Revenue Million Forecast, by Product 2019 & 2032
- Table 30: Global Commercial Office Furniture Industry in Australia Volume K Unit Forecast, by Product 2019 & 2032
- Table 31: Global Commercial Office Furniture Industry in Australia Revenue Million Forecast, by Distribution Channel 2019 & 2032
- Table 32: Global Commercial Office Furniture Industry in Australia Volume K Unit Forecast, by Distribution Channel 2019 & 2032
- Table 33: Global Commercial Office Furniture Industry in Australia Revenue Million Forecast, by Country 2019 & 2032
- Table 34: Global Commercial Office Furniture Industry in Australia Volume K Unit Forecast, by Country 2019 & 2032
- Table 35: Brazil Commercial Office Furniture Industry in Australia Revenue (Million) Forecast, by Application 2019 & 2032
- Table 36: Brazil Commercial Office Furniture Industry in Australia Volume (K Unit) Forecast, by Application 2019 & 2032
- Table 37: Argentina Commercial Office Furniture Industry in Australia Revenue (Million) Forecast, by Application 2019 & 2032
- Table 38: Argentina Commercial Office Furniture Industry in Australia Volume (K Unit) Forecast, by Application 2019 & 2032
- Table 39: Rest of South America Commercial Office Furniture Industry in Australia Revenue (Million) Forecast, by Application 2019 & 2032
- Table 40: Rest of South America Commercial Office Furniture Industry in Australia Volume (K Unit) Forecast, by Application 2019 & 2032
- Table 41: Global Commercial Office Furniture Industry in Australia Revenue Million Forecast, by Material 2019 & 2032
- Table 42: Global Commercial Office Furniture Industry in Australia Volume K Unit Forecast, by Material 2019 & 2032
- Table 43: Global Commercial Office Furniture Industry in Australia Revenue Million Forecast, by Product 2019 & 2032
- Table 44: Global Commercial Office Furniture Industry in Australia Volume K Unit Forecast, by Product 2019 & 2032
- Table 45: Global Commercial Office Furniture Industry in Australia Revenue Million Forecast, by Distribution Channel 2019 & 2032
- Table 46: Global Commercial Office Furniture Industry in Australia Volume K Unit Forecast, by Distribution Channel 2019 & 2032
- Table 47: Global Commercial Office Furniture Industry in Australia Revenue Million Forecast, by Country 2019 & 2032
- Table 48: Global Commercial Office Furniture Industry in Australia Volume K Unit Forecast, by Country 2019 & 2032
- Table 49: United Kingdom Commercial Office Furniture Industry in Australia Revenue (Million) Forecast, by Application 2019 & 2032
- Table 50: United Kingdom Commercial Office Furniture Industry in Australia Volume (K Unit) Forecast, by Application 2019 & 2032
- Table 51: Germany Commercial Office Furniture Industry in Australia Revenue (Million) Forecast, by Application 2019 & 2032
- Table 52: Germany Commercial Office Furniture Industry in Australia Volume (K Unit) Forecast, by Application 2019 & 2032
- Table 53: France Commercial Office Furniture Industry in Australia Revenue (Million) Forecast, by Application 2019 & 2032
- Table 54: France Commercial Office Furniture Industry in Australia Volume (K Unit) Forecast, by Application 2019 & 2032
- Table 55: Italy Commercial Office Furniture Industry in Australia Revenue (Million) Forecast, by Application 2019 & 2032
- Table 56: Italy Commercial Office Furniture Industry in Australia Volume (K Unit) Forecast, by Application 2019 & 2032
- Table 57: Spain Commercial Office Furniture Industry in Australia Revenue (Million) Forecast, by Application 2019 & 2032
- Table 58: Spain Commercial Office Furniture Industry in Australia Volume (K Unit) Forecast, by Application 2019 & 2032
- Table 59: Russia Commercial Office Furniture Industry in Australia Revenue (Million) Forecast, by Application 2019 & 2032
- Table 60: Russia Commercial Office Furniture Industry in Australia Volume (K Unit) Forecast, by Application 2019 & 2032
- Table 61: Benelux Commercial Office Furniture Industry in Australia Revenue (Million) Forecast, by Application 2019 & 2032
- Table 62: Benelux Commercial Office Furniture Industry in Australia Volume (K Unit) Forecast, by Application 2019 & 2032
- Table 63: Nordics Commercial Office Furniture Industry in Australia Revenue (Million) Forecast, by Application 2019 & 2032
- Table 64: Nordics Commercial Office Furniture Industry in Australia Volume (K Unit) Forecast, by Application 2019 & 2032
- Table 65: Rest of Europe Commercial Office Furniture Industry in Australia Revenue (Million) Forecast, by Application 2019 & 2032
- Table 66: Rest of Europe Commercial Office Furniture Industry in Australia Volume (K Unit) Forecast, by Application 2019 & 2032
- Table 67: Global Commercial Office Furniture Industry in Australia Revenue Million Forecast, by Material 2019 & 2032
- Table 68: Global Commercial Office Furniture Industry in Australia Volume K Unit Forecast, by Material 2019 & 2032
- Table 69: Global Commercial Office Furniture Industry in Australia Revenue Million Forecast, by Product 2019 & 2032
- Table 70: Global Commercial Office Furniture Industry in Australia Volume K Unit Forecast, by Product 2019 & 2032
- Table 71: Global Commercial Office Furniture Industry in Australia Revenue Million Forecast, by Distribution Channel 2019 & 2032
- Table 72: Global Commercial Office Furniture Industry in Australia Volume K Unit Forecast, by Distribution Channel 2019 & 2032
- Table 73: Global Commercial Office Furniture Industry in Australia Revenue Million Forecast, by Country 2019 & 2032
- Table 74: Global Commercial Office Furniture Industry in Australia Volume K Unit Forecast, by Country 2019 & 2032
- Table 75: Turkey Commercial Office Furniture Industry in Australia Revenue (Million) Forecast, by Application 2019 & 2032
- Table 76: Turkey Commercial Office Furniture Industry in Australia Volume (K Unit) Forecast, by Application 2019 & 2032
- Table 77: Israel Commercial Office Furniture Industry in Australia Revenue (Million) Forecast, by Application 2019 & 2032
- Table 78: Israel Commercial Office Furniture Industry in Australia Volume (K Unit) Forecast, by Application 2019 & 2032
- Table 79: GCC Commercial Office Furniture Industry in Australia Revenue (Million) Forecast, by Application 2019 & 2032
- Table 80: GCC Commercial Office Furniture Industry in Australia Volume (K Unit) Forecast, by Application 2019 & 2032
- Table 81: North Africa Commercial Office Furniture Industry in Australia Revenue (Million) Forecast, by Application 2019 & 2032
- Table 82: North Africa Commercial Office Furniture Industry in Australia Volume (K Unit) Forecast, by Application 2019 & 2032
- Table 83: South Africa Commercial Office Furniture Industry in Australia Revenue (Million) Forecast, by Application 2019 & 2032
- Table 84: South Africa Commercial Office Furniture Industry in Australia Volume (K Unit) Forecast, by Application 2019 & 2032
- Table 85: Rest of Middle East & Africa Commercial Office Furniture Industry in Australia Revenue (Million) Forecast, by Application 2019 & 2032
- Table 86: Rest of Middle East & Africa Commercial Office Furniture Industry in Australia Volume (K Unit) Forecast, by Application 2019 & 2032
- Table 87: Global Commercial Office Furniture Industry in Australia Revenue Million Forecast, by Material 2019 & 2032
- Table 88: Global Commercial Office Furniture Industry in Australia Volume K Unit Forecast, by Material 2019 & 2032
- Table 89: Global Commercial Office Furniture Industry in Australia Revenue Million Forecast, by Product 2019 & 2032
- Table 90: Global Commercial Office Furniture Industry in Australia Volume K Unit Forecast, by Product 2019 & 2032
- Table 91: Global Commercial Office Furniture Industry in Australia Revenue Million Forecast, by Distribution Channel 2019 & 2032
- Table 92: Global Commercial Office Furniture Industry in Australia Volume K Unit Forecast, by Distribution Channel 2019 & 2032
- Table 93: Global Commercial Office Furniture Industry in Australia Revenue Million Forecast, by Country 2019 & 2032
- Table 94: Global Commercial Office Furniture Industry in Australia Volume K Unit Forecast, by Country 2019 & 2032
- Table 95: China Commercial Office Furniture Industry in Australia Revenue (Million) Forecast, by Application 2019 & 2032
- Table 96: China Commercial Office Furniture Industry in Australia Volume (K Unit) Forecast, by Application 2019 & 2032
- Table 97: India Commercial Office Furniture Industry in Australia Revenue (Million) Forecast, by Application 2019 & 2032
- Table 98: India Commercial Office Furniture Industry in Australia Volume (K Unit) Forecast, by Application 2019 & 2032
- Table 99: Japan Commercial Office Furniture Industry in Australia Revenue (Million) Forecast, by Application 2019 & 2032
- Table 100: Japan Commercial Office Furniture Industry in Australia Volume (K Unit) Forecast, by Application 2019 & 2032
- Table 101: South Korea Commercial Office Furniture Industry in Australia Revenue (Million) Forecast, by Application 2019 & 2032
- Table 102: South Korea Commercial Office Furniture Industry in Australia Volume (K Unit) Forecast, by Application 2019 & 2032
- Table 103: ASEAN Commercial Office Furniture Industry in Australia Revenue (Million) Forecast, by Application 2019 & 2032
- Table 104: ASEAN Commercial Office Furniture Industry in Australia Volume (K Unit) Forecast, by Application 2019 & 2032
- Table 105: Oceania Commercial Office Furniture Industry in Australia Revenue (Million) Forecast, by Application 2019 & 2032
- Table 106: Oceania Commercial Office Furniture Industry in Australia Volume (K Unit) Forecast, by Application 2019 & 2032
- Table 107: Rest of Asia Pacific Commercial Office Furniture Industry in Australia Revenue (Million) Forecast, by Application 2019 & 2032
- Table 108: Rest of Asia Pacific Commercial Office Furniture Industry in Australia Volume (K Unit) Forecast, by Application 2019 & 2032
Frequently Asked Questions
1. What is the projected Compound Annual Growth Rate (CAGR) of the Commercial Office Furniture Industry in Australia?
The projected CAGR is approximately 3.54%.
2. Which companies are prominent players in the Commercial Office Furniture Industry in Australia?
Key companies in the market include Advanta, Krost Business Furniture, Alpha Office Furniture, Matic Furniture, Progressive Office Furniture, AMS Furniture, Aspen Commercial Interiors, Emanate Design, Diami, Burgtec, Fursys, BFX Furniture.
3. What are the main segments of the Commercial Office Furniture Industry in Australia?
The market segments include Material, Product, Distribution Channel.
4. Can you provide details about the market size?
The market size is estimated to be USD 2.46 Million as of 2022.
5. What are some drivers contributing to market growth?
Rise in New Offices in South Korea; Wide Range of Design Broadening Consumer Base.
6. What are the notable trends driving market growth?
Rise in Commercial Space Construction.
7. Are there any restraints impacting market growth?
Fluctuations in Raw Material Prices and Rise in Shipping Prices; Intense Competition from Both Local and International Players.
8. Can you provide examples of recent developments in the market?
N/A
9. What pricing options are available for accessing the report?
Pricing options include single-user, multi-user, and enterprise licenses priced at USD 3800, USD 4500, and USD 5800 respectively.
10. Is the market size provided in terms of value or volume?
The market size is provided in terms of value, measured in Million and volume, measured in K Unit.
11. Are there any specific market keywords associated with the report?
Yes, the market keyword associated with the report is "Commercial Office Furniture Industry in Australia," which aids in identifying and referencing the specific market segment covered.
12. How do I determine which pricing option suits my needs best?
The pricing options vary based on user requirements and access needs. Individual users may opt for single-user licenses, while businesses requiring broader access may choose multi-user or enterprise licenses for cost-effective access to the report.
13. Are there any additional resources or data provided in the Commercial Office Furniture Industry in Australia report?
While the report offers comprehensive insights, it's advisable to review the specific contents or supplementary materials provided to ascertain if additional resources or data are available.
14. How can I stay updated on further developments or reports in the Commercial Office Furniture Industry in Australia?
To stay informed about further developments, trends, and reports in the Commercial Office Furniture Industry in Australia, consider subscribing to industry newsletters, following relevant companies and organizations, or regularly checking reputable industry news sources and publications.
Methodology
Step 1 - Identification of Relevant Samples Size from Population Database


Step 2 - Approaches for Defining Global Market Size (Value, Volume* & Price*)

Note*: In applicable scenarios
Step 3 - Data Sources
Primary Research
- Web Analytics
- Survey Reports
- Research Institute
- Latest Research Reports
- Opinion Leaders
Secondary Research
- Annual Reports
- White Paper
- Latest Press Release
- Industry Association
- Paid Database
- Investor Presentations

Step 4 - Data Triangulation
Involves using different sources of information in order to increase the validity of a study
These sources are likely to be stakeholders in a program - participants, other researchers, program staff, other community members, and so on.
Then we put all data in single framework & apply various statistical tools to find out the dynamic on the market.
During the analysis stage, feedback from the stakeholder groups would be compared to determine areas of agreement as well as areas of divergence
