

Key Insights
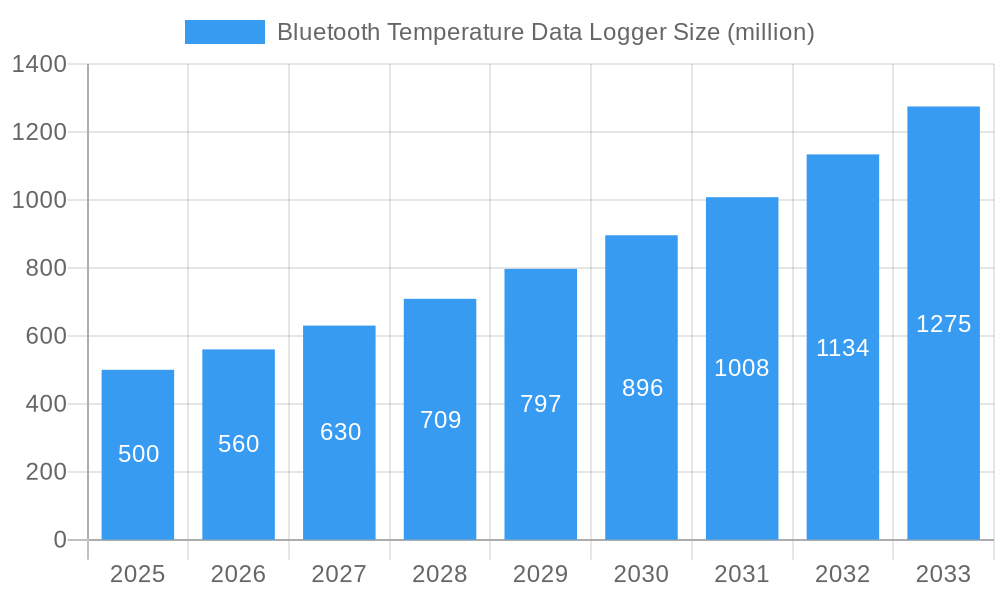
The global Bluetooth temperature data logger market is experiencing robust growth, driven by increasing demand across diverse sectors. The convergence of IoT technologies, enhanced data analytics capabilities, and the need for real-time temperature monitoring in sensitive applications like life sciences (pharmaceutical cold chain, clinical trials), healthcare (patient monitoring, vaccine storage), and food & beverage (supply chain integrity) are key propellants. The market is segmented by application (life sciences, healthcare, food and beverage, cold chain logistics, industrial, others) and type (wired, wireless), with wireless, particularly Bluetooth-enabled loggers, dominating due to their ease of use, remote monitoring capabilities, and cost-effectiveness. The market's expansion is further fueled by stringent regulatory compliance requirements and rising consumer awareness regarding product safety and quality. We estimate the 2025 market size to be approximately $500 million, projecting a Compound Annual Growth Rate (CAGR) of 12% through 2033. This growth is anticipated to be driven by increasing adoption in emerging economies and the continuous development of advanced functionalities, such as longer battery life, improved data security, and integration with cloud-based platforms.
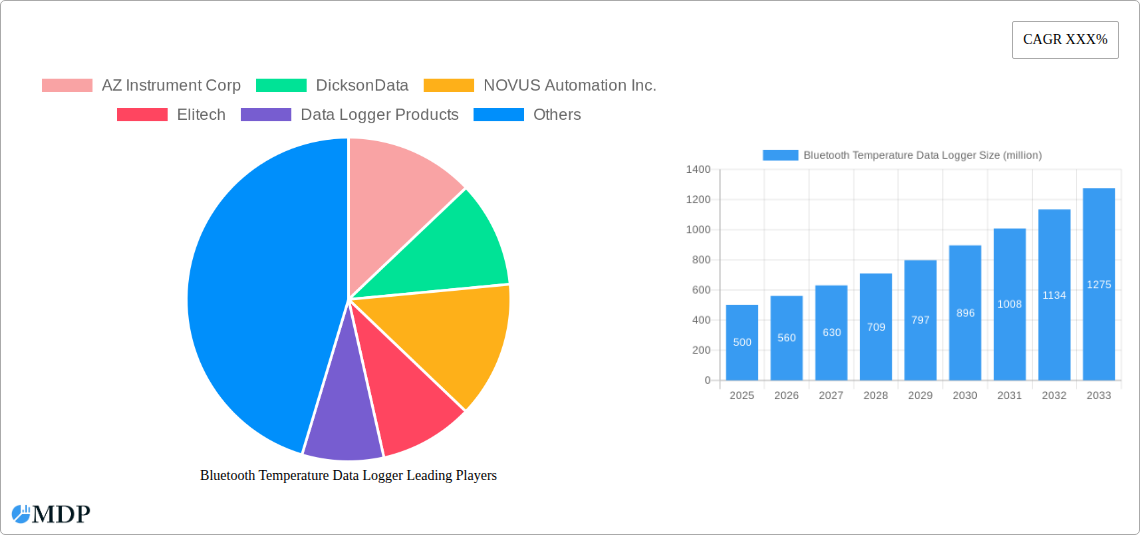
Bluetooth Temperature Data Logger Market Size (In Million)
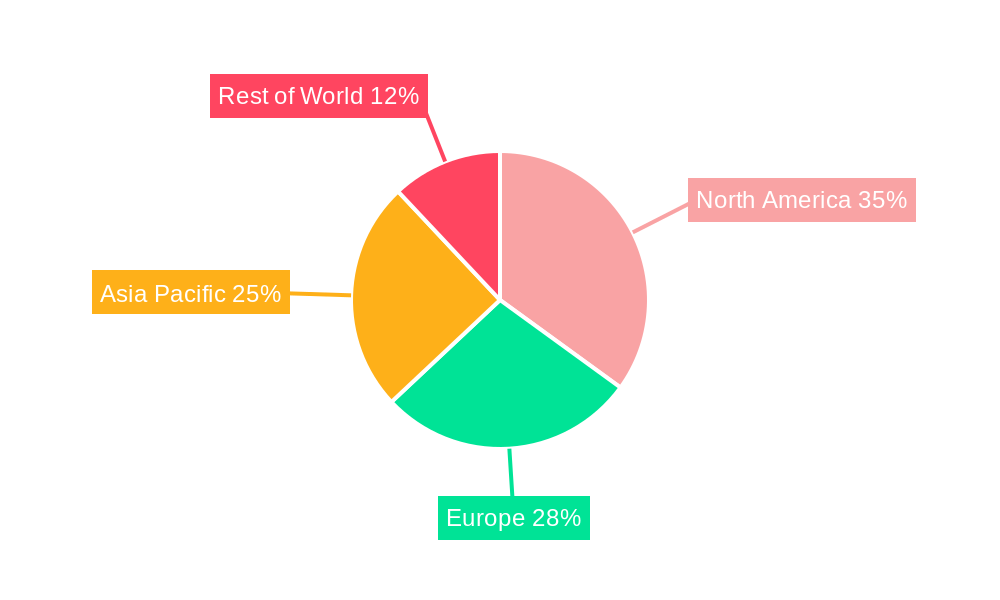
Despite the positive outlook, certain restraints exist. High initial investment costs for sophisticated data logging systems and concerns about data security and interoperability could impede market growth to some degree. Nevertheless, ongoing technological advancements and the development of more cost-effective solutions are expected to mitigate these challenges. The competitive landscape is characterized by a mix of established players and emerging companies, leading to innovation and diversification of product offerings. North America currently holds a significant market share, driven by advanced infrastructure and regulatory standards, but the Asia-Pacific region is anticipated to exhibit the highest growth rate, propelled by rising industrialization and expanding healthcare sectors in countries like China and India. The market is witnessing a shift towards more sophisticated data loggers with advanced features and cloud connectivity, allowing for enhanced data analysis and proactive decision-making.
Bluetooth Temperature Data Logger Company Market Share
Bluetooth Temperature Data Logger Market Report: 2019-2033
Uncover the lucrative opportunities and challenges within the booming Bluetooth Temperature Data Logger market, projected to reach $XX million by 2033. This comprehensive report provides an in-depth analysis of market dynamics, leading players, technological advancements, and future growth prospects across diverse segments. Benefit from actionable insights based on rigorous market research covering the period 2019-2033, with a focus on 2025.
Bluetooth Temperature Data Logger Market Dynamics & Concentration
The global Bluetooth Temperature Data Logger market, valued at $XX million in 2025, exhibits a moderately consolidated structure. Several key players, including AZ Instrument Corp, DicksonData, NOVUS Automation Inc., and Elitech, hold significant market share, while numerous smaller companies compete for niche segments. Market concentration is expected to remain relatively stable throughout the forecast period (2025-2033), with larger companies focusing on expanding product lines and geographic reach.
Innovation Drivers: Miniaturization, enhanced accuracy, improved data security features, and cloud integration capabilities are key drivers of innovation. The increasing demand for real-time monitoring and data analysis across various applications fuels continuous product development.
Regulatory Frameworks: Stringent regulations concerning data security and food safety, particularly in the healthcare and food & beverage sectors, significantly impact market growth. Compliance with these regulations presents both challenges and opportunities for market participants.
Product Substitutes: Traditional wired data loggers and alternative monitoring methods pose a moderate competitive threat. However, the convenience, cost-effectiveness, and wireless connectivity offered by Bluetooth data loggers continue to drive market growth.
End-User Trends: The increasing adoption of IoT technologies and digitalization across various industries is a major catalyst for market expansion. The demand for remote monitoring solutions is growing rapidly, especially in cold chain logistics and healthcare.
M&A Activities: The market has witnessed a moderate level of M&A activity in recent years, with xx major deals recorded between 2019 and 2024. This consolidation trend is likely to continue, driven by the need for enhanced market reach and technological capabilities. Market share data reveals that the top 5 companies collectively hold approximately xx% of the market.
Bluetooth Temperature Data Logger Industry Trends & Analysis
The global Bluetooth Temperature Data Logger market is experiencing robust growth, with a projected CAGR of xx% during the forecast period (2025-2033). This growth is fueled by several factors, including the rising demand for efficient cold chain management solutions, stringent regulatory compliance requirements, and increasing adoption of wireless technologies across various sectors. Market penetration within the healthcare and food and beverage sectors is particularly strong, with xx% market penetration by 2025. Technological disruptions, such as the development of low-power, long-range Bluetooth technologies, are further boosting market expansion. Competitive dynamics are shaped by intense price competition, technological innovation, and strategic partnerships. Consumer preferences are shifting towards data loggers with advanced features like data visualization tools, cloud connectivity, and user-friendly interfaces. The market exhibits a regional disparity, with North America and Europe demonstrating higher adoption rates compared to other regions.
Leading Markets & Segments in Bluetooth Temperature Data Logger
Dominant Region/Segment: North America currently holds the largest market share, driven by strong regulatory compliance requirements, advanced technological infrastructure, and high adoption rates within the healthcare and life sciences sectors. Within the application segments, the healthcare and cold chain logistics sectors are the most significant contributors to market growth.
Key Drivers by Segment:
- Life Sciences: Stringent regulatory compliance, increasing research activities, and the need for precise temperature monitoring during drug development and storage.
- Healthcare: The demand for reliable temperature monitoring in hospitals, pharmaceutical supply chains, and patient care.
- Food and Beverage: Growing consumer demand for safe and high-quality food products, stringent quality control regulations, and increasing emphasis on cold chain management.
- Cold Chain Logistics: Need for real-time temperature monitoring and efficient tracking of temperature-sensitive goods during transportation and storage.
- Industrial: Monitoring critical processes in manufacturing, storage, and transportation, particularly in industries dealing with temperature-sensitive materials.
- Others: Applications in environmental monitoring, agriculture, and research contribute to steady growth in this segment.
Type: Wireless Bluetooth data loggers significantly dominate the market due to their ease of use, mobility, and reduced infrastructure costs compared to wired counterparts. The market share for wireless devices is estimated to be approximately xx% in 2025.
Bluetooth Temperature Data Logger Product Developments
Recent advancements in Bluetooth temperature data loggers include the integration of advanced sensors, improved data security features, and enhanced connectivity options. Manufacturers are focusing on developing smaller, more accurate, and user-friendly devices with better battery life and increased data storage capacity. The integration of cloud-based data platforms enables real-time monitoring and analysis, creating a significant competitive advantage. This focus on enhanced functionality and user experience is driving increased market adoption.
Key Drivers of Bluetooth Temperature Data Logger Growth
The market's growth is primarily driven by:
- Technological Advancements: The development of low-power, long-range Bluetooth technologies, improved sensor accuracy, and enhanced data analysis capabilities.
- Economic Growth: Rising disposable incomes in developing countries are driving increased demand for better food safety and healthcare solutions.
- Stringent Regulations: Stricter regulations related to cold chain management and data security in various industries are boosting market growth.
Challenges in the Bluetooth Temperature Data Logger Market
Significant challenges include:
- Regulatory Hurdles: The need to comply with diverse regulatory standards across different regions can increase manufacturing costs and complicate market entry.
- Supply Chain Disruptions: Global supply chain bottlenecks can affect the availability of components, leading to production delays and price fluctuations.
- Competitive Pressures: Intense competition among established players and emerging companies can create pricing pressures and limit profit margins.
Emerging Opportunities in Bluetooth Temperature Data Logger
The market presents several exciting opportunities, particularly in:
- IoT Integration: Expanding the use of Bluetooth data loggers within the Internet of Things (IoT) ecosystem for improved data management and remote monitoring.
- Strategic Partnerships: Collaborations between data logger manufacturers and software providers can lead to the development of comprehensive monitoring solutions.
- Market Expansion: The market presents significant opportunities for expansion in developing economies with growing demand for cold chain and healthcare infrastructure.
Leading Players in the Bluetooth Temperature Data Logger Sector
- AZ Instrument Corp
- DicksonData
- NOVUS Automation Inc.
- Elitech
- Data Logger Products
- TempSen
- Traceable Products
- Hangzhou Zeda Instruments
- Tzone Digital Technology Co
- MSR-Electronic GmbH
- Synotronics
- Onset
- Lascar Electronics
- DeltaTrak Inc.
- OCEASOFT
- Wagner Meters
- Data Harvest
- Smashtag
- Tecnosoft
- METER Group
- Labfacility Limited
Key Milestones in Bluetooth Temperature Data Logger Industry
- 2020: Introduction of low-power, long-range Bluetooth 5.0 enabled data loggers by several major players.
- 2022: Several key acquisitions and mergers within the sector, leading to increased market consolidation.
- 2023: Launch of cloud-based data platforms offering real-time monitoring and analysis capabilities.
- 2024: Growing focus on data security and compliance standards.
Strategic Outlook for Bluetooth Temperature Data Logger Market
The Bluetooth Temperature Data Logger market is poised for continued expansion, driven by technological advancements, regulatory compliance requirements, and the increasing demand for efficient monitoring solutions. Strategic opportunities lie in developing innovative products with enhanced features, expanding into new geographical markets, and forging strategic partnerships to consolidate market share and offer integrated solutions. This is a market ripe for investment and innovation.
Bluetooth Temperature Data Logger Segmentation
-
1. Application
- 1.1. Life Sciences
- 1.2. Healthcare
- 1.3. Food and Beverage
- 1.4. Cold Chain logistics
- 1.5. Industrial
- 1.6. Others
-
2. Type
- 2.1. Wired
- 2.2. Wireless
Bluetooth Temperature Data Logger Segmentation By Geography
-
1. North America
- 1.1. United States
- 1.2. Canada
- 1.3. Mexico
-
2. South America
- 2.1. Brazil
- 2.2. Argentina
- 2.3. Rest of South America
-
3. Europe
- 3.1. United Kingdom
- 3.2. Germany
- 3.3. France
- 3.4. Italy
- 3.5. Spain
- 3.6. Russia
- 3.7. Benelux
- 3.8. Nordics
- 3.9. Rest of Europe
-
4. Middle East & Africa
- 4.1. Turkey
- 4.2. Israel
- 4.3. GCC
- 4.4. North Africa
- 4.5. South Africa
- 4.6. Rest of Middle East & Africa
-
5. Asia Pacific
- 5.1. China
- 5.2. India
- 5.3. Japan
- 5.4. South Korea
- 5.5. ASEAN
- 5.6. Oceania
- 5.7. Rest of Asia Pacific
Bluetooth Temperature Data Logger Regional Market Share
Geographic Coverage of Bluetooth Temperature Data Logger
Bluetooth Temperature Data Logger REPORT HIGHLIGHTS
| Aspects | Details |
|---|---|
| Study Period | 2020-2034 |
| Base Year | 2025 |
| Estimated Year | 2026 |
| Forecast Period | 2026-2034 |
| Historical Period | 2020-2025 |
| Growth Rate | CAGR of 12.78% from 2020-2034 |
| Segmentation |
|
Table of Contents
- 1. Introduction
- 1.1. Research Scope
- 1.2. Market Segmentation
- 1.3. Research Methodology
- 1.4. Definitions and Assumptions
- 2. Executive Summary
- 2.1. Introduction
- 3. Market Dynamics
- 3.1. Introduction
- 3.2. Market Drivers
- 3.3. Market Restrains
- 3.4. Market Trends
- 4. Market Factor Analysis
- 4.1. Porters Five Forces
- 4.2. Supply/Value Chain
- 4.3. PESTEL analysis
- 4.4. Market Entropy
- 4.5. Patent/Trademark Analysis
- 5. Global Bluetooth Temperature Data Logger Analysis, Insights and Forecast, 2020-2032
- 5.1. Market Analysis, Insights and Forecast - by Application
- 5.1.1. Life Sciences
- 5.1.2. Healthcare
- 5.1.3. Food and Beverage
- 5.1.4. Cold Chain logistics
- 5.1.5. Industrial
- 5.1.6. Others
- 5.2. Market Analysis, Insights and Forecast - by Type
- 5.2.1. Wired
- 5.2.2. Wireless
- 5.3. Market Analysis, Insights and Forecast - by Region
- 5.3.1. North America
- 5.3.2. South America
- 5.3.3. Europe
- 5.3.4. Middle East & Africa
- 5.3.5. Asia Pacific
- 5.1. Market Analysis, Insights and Forecast - by Application
- 6. North America Bluetooth Temperature Data Logger Analysis, Insights and Forecast, 2020-2032
- 6.1. Market Analysis, Insights and Forecast - by Application
- 6.1.1. Life Sciences
- 6.1.2. Healthcare
- 6.1.3. Food and Beverage
- 6.1.4. Cold Chain logistics
- 6.1.5. Industrial
- 6.1.6. Others
- 6.2. Market Analysis, Insights and Forecast - by Type
- 6.2.1. Wired
- 6.2.2. Wireless
- 6.1. Market Analysis, Insights and Forecast - by Application
- 7. South America Bluetooth Temperature Data Logger Analysis, Insights and Forecast, 2020-2032
- 7.1. Market Analysis, Insights and Forecast - by Application
- 7.1.1. Life Sciences
- 7.1.2. Healthcare
- 7.1.3. Food and Beverage
- 7.1.4. Cold Chain logistics
- 7.1.5. Industrial
- 7.1.6. Others
- 7.2. Market Analysis, Insights and Forecast - by Type
- 7.2.1. Wired
- 7.2.2. Wireless
- 7.1. Market Analysis, Insights and Forecast - by Application
- 8. Europe Bluetooth Temperature Data Logger Analysis, Insights and Forecast, 2020-2032
- 8.1. Market Analysis, Insights and Forecast - by Application
- 8.1.1. Life Sciences
- 8.1.2. Healthcare
- 8.1.3. Food and Beverage
- 8.1.4. Cold Chain logistics
- 8.1.5. Industrial
- 8.1.6. Others
- 8.2. Market Analysis, Insights and Forecast - by Type
- 8.2.1. Wired
- 8.2.2. Wireless
- 8.1. Market Analysis, Insights and Forecast - by Application
- 9. Middle East & Africa Bluetooth Temperature Data Logger Analysis, Insights and Forecast, 2020-2032
- 9.1. Market Analysis, Insights and Forecast - by Application
- 9.1.1. Life Sciences
- 9.1.2. Healthcare
- 9.1.3. Food and Beverage
- 9.1.4. Cold Chain logistics
- 9.1.5. Industrial
- 9.1.6. Others
- 9.2. Market Analysis, Insights and Forecast - by Type
- 9.2.1. Wired
- 9.2.2. Wireless
- 9.1. Market Analysis, Insights and Forecast - by Application
- 10. Asia Pacific Bluetooth Temperature Data Logger Analysis, Insights and Forecast, 2020-2032
- 10.1. Market Analysis, Insights and Forecast - by Application
- 10.1.1. Life Sciences
- 10.1.2. Healthcare
- 10.1.3. Food and Beverage
- 10.1.4. Cold Chain logistics
- 10.1.5. Industrial
- 10.1.6. Others
- 10.2. Market Analysis, Insights and Forecast - by Type
- 10.2.1. Wired
- 10.2.2. Wireless
- 10.1. Market Analysis, Insights and Forecast - by Application
- 11. Competitive Analysis
- 11.1. Global Market Share Analysis 2025
- 11.2. Company Profiles
- 11.2.1 AZ Instrument Corp
- 11.2.1.1. Overview
- 11.2.1.2. Products
- 11.2.1.3. SWOT Analysis
- 11.2.1.4. Recent Developments
- 11.2.1.5. Financials (Based on Availability)
- 11.2.2 DicksonData
- 11.2.2.1. Overview
- 11.2.2.2. Products
- 11.2.2.3. SWOT Analysis
- 11.2.2.4. Recent Developments
- 11.2.2.5. Financials (Based on Availability)
- 11.2.3 NOVUS Automation Inc.
- 11.2.3.1. Overview
- 11.2.3.2. Products
- 11.2.3.3. SWOT Analysis
- 11.2.3.4. Recent Developments
- 11.2.3.5. Financials (Based on Availability)
- 11.2.4 Elitech
- 11.2.4.1. Overview
- 11.2.4.2. Products
- 11.2.4.3. SWOT Analysis
- 11.2.4.4. Recent Developments
- 11.2.4.5. Financials (Based on Availability)
- 11.2.5 Data Logger Products
- 11.2.5.1. Overview
- 11.2.5.2. Products
- 11.2.5.3. SWOT Analysis
- 11.2.5.4. Recent Developments
- 11.2.5.5. Financials (Based on Availability)
- 11.2.6 TempSen
- 11.2.6.1. Overview
- 11.2.6.2. Products
- 11.2.6.3. SWOT Analysis
- 11.2.6.4. Recent Developments
- 11.2.6.5. Financials (Based on Availability)
- 11.2.7 Traceable Products
- 11.2.7.1. Overview
- 11.2.7.2. Products
- 11.2.7.3. SWOT Analysis
- 11.2.7.4. Recent Developments
- 11.2.7.5. Financials (Based on Availability)
- 11.2.8 Hangzhou Zeda Instruments
- 11.2.8.1. Overview
- 11.2.8.2. Products
- 11.2.8.3. SWOT Analysis
- 11.2.8.4. Recent Developments
- 11.2.8.5. Financials (Based on Availability)
- 11.2.9 Tzone Digital Technology Co
- 11.2.9.1. Overview
- 11.2.9.2. Products
- 11.2.9.3. SWOT Analysis
- 11.2.9.4. Recent Developments
- 11.2.9.5. Financials (Based on Availability)
- 11.2.10 MSR-Electronic GmbH
- 11.2.10.1. Overview
- 11.2.10.2. Products
- 11.2.10.3. SWOT Analysis
- 11.2.10.4. Recent Developments
- 11.2.10.5. Financials (Based on Availability)
- 11.2.11 Synotronics
- 11.2.11.1. Overview
- 11.2.11.2. Products
- 11.2.11.3. SWOT Analysis
- 11.2.11.4. Recent Developments
- 11.2.11.5. Financials (Based on Availability)
- 11.2.12 Onset
- 11.2.12.1. Overview
- 11.2.12.2. Products
- 11.2.12.3. SWOT Analysis
- 11.2.12.4. Recent Developments
- 11.2.12.5. Financials (Based on Availability)
- 11.2.13 Lascar Electronics
- 11.2.13.1. Overview
- 11.2.13.2. Products
- 11.2.13.3. SWOT Analysis
- 11.2.13.4. Recent Developments
- 11.2.13.5. Financials (Based on Availability)
- 11.2.14 DeltaTrak Inc.
- 11.2.14.1. Overview
- 11.2.14.2. Products
- 11.2.14.3. SWOT Analysis
- 11.2.14.4. Recent Developments
- 11.2.14.5. Financials (Based on Availability)
- 11.2.15 OCEASOFT
- 11.2.15.1. Overview
- 11.2.15.2. Products
- 11.2.15.3. SWOT Analysis
- 11.2.15.4. Recent Developments
- 11.2.15.5. Financials (Based on Availability)
- 11.2.16 Wagner Meters
- 11.2.16.1. Overview
- 11.2.16.2. Products
- 11.2.16.3. SWOT Analysis
- 11.2.16.4. Recent Developments
- 11.2.16.5. Financials (Based on Availability)
- 11.2.17 Data Harvest
- 11.2.17.1. Overview
- 11.2.17.2. Products
- 11.2.17.3. SWOT Analysis
- 11.2.17.4. Recent Developments
- 11.2.17.5. Financials (Based on Availability)
- 11.2.18 Smashtag
- 11.2.18.1. Overview
- 11.2.18.2. Products
- 11.2.18.3. SWOT Analysis
- 11.2.18.4. Recent Developments
- 11.2.18.5. Financials (Based on Availability)
- 11.2.19 Tecnosoft
- 11.2.19.1. Overview
- 11.2.19.2. Products
- 11.2.19.3. SWOT Analysis
- 11.2.19.4. Recent Developments
- 11.2.19.5. Financials (Based on Availability)
- 11.2.20 METER Group
- 11.2.20.1. Overview
- 11.2.20.2. Products
- 11.2.20.3. SWOT Analysis
- 11.2.20.4. Recent Developments
- 11.2.20.5. Financials (Based on Availability)
- 11.2.21 Labfacility Limited
- 11.2.21.1. Overview
- 11.2.21.2. Products
- 11.2.21.3. SWOT Analysis
- 11.2.21.4. Recent Developments
- 11.2.21.5. Financials (Based on Availability)
- 11.2.1 AZ Instrument Corp
List of Figures
- Figure 1: Global Bluetooth Temperature Data Logger Revenue Breakdown (undefined, %) by Region 2025 & 2033
- Figure 2: North America Bluetooth Temperature Data Logger Revenue (undefined), by Application 2025 & 2033
- Figure 3: North America Bluetooth Temperature Data Logger Revenue Share (%), by Application 2025 & 2033
- Figure 4: North America Bluetooth Temperature Data Logger Revenue (undefined), by Type 2025 & 2033
- Figure 5: North America Bluetooth Temperature Data Logger Revenue Share (%), by Type 2025 & 2033
- Figure 6: North America Bluetooth Temperature Data Logger Revenue (undefined), by Country 2025 & 2033
- Figure 7: North America Bluetooth Temperature Data Logger Revenue Share (%), by Country 2025 & 2033
- Figure 8: South America Bluetooth Temperature Data Logger Revenue (undefined), by Application 2025 & 2033
- Figure 9: South America Bluetooth Temperature Data Logger Revenue Share (%), by Application 2025 & 2033
- Figure 10: South America Bluetooth Temperature Data Logger Revenue (undefined), by Type 2025 & 2033
- Figure 11: South America Bluetooth Temperature Data Logger Revenue Share (%), by Type 2025 & 2033
- Figure 12: South America Bluetooth Temperature Data Logger Revenue (undefined), by Country 2025 & 2033
- Figure 13: South America Bluetooth Temperature Data Logger Revenue Share (%), by Country 2025 & 2033
- Figure 14: Europe Bluetooth Temperature Data Logger Revenue (undefined), by Application 2025 & 2033
- Figure 15: Europe Bluetooth Temperature Data Logger Revenue Share (%), by Application 2025 & 2033
- Figure 16: Europe Bluetooth Temperature Data Logger Revenue (undefined), by Type 2025 & 2033
- Figure 17: Europe Bluetooth Temperature Data Logger Revenue Share (%), by Type 2025 & 2033
- Figure 18: Europe Bluetooth Temperature Data Logger Revenue (undefined), by Country 2025 & 2033
- Figure 19: Europe Bluetooth Temperature Data Logger Revenue Share (%), by Country 2025 & 2033
- Figure 20: Middle East & Africa Bluetooth Temperature Data Logger Revenue (undefined), by Application 2025 & 2033
- Figure 21: Middle East & Africa Bluetooth Temperature Data Logger Revenue Share (%), by Application 2025 & 2033
- Figure 22: Middle East & Africa Bluetooth Temperature Data Logger Revenue (undefined), by Type 2025 & 2033
- Figure 23: Middle East & Africa Bluetooth Temperature Data Logger Revenue Share (%), by Type 2025 & 2033
- Figure 24: Middle East & Africa Bluetooth Temperature Data Logger Revenue (undefined), by Country 2025 & 2033
- Figure 25: Middle East & Africa Bluetooth Temperature Data Logger Revenue Share (%), by Country 2025 & 2033
- Figure 26: Asia Pacific Bluetooth Temperature Data Logger Revenue (undefined), by Application 2025 & 2033
- Figure 27: Asia Pacific Bluetooth Temperature Data Logger Revenue Share (%), by Application 2025 & 2033
- Figure 28: Asia Pacific Bluetooth Temperature Data Logger Revenue (undefined), by Type 2025 & 2033
- Figure 29: Asia Pacific Bluetooth Temperature Data Logger Revenue Share (%), by Type 2025 & 2033
- Figure 30: Asia Pacific Bluetooth Temperature Data Logger Revenue (undefined), by Country 2025 & 2033
- Figure 31: Asia Pacific Bluetooth Temperature Data Logger Revenue Share (%), by Country 2025 & 2033
List of Tables
- Table 1: Global Bluetooth Temperature Data Logger Revenue undefined Forecast, by Application 2020 & 2033
- Table 2: Global Bluetooth Temperature Data Logger Revenue undefined Forecast, by Type 2020 & 2033
- Table 3: Global Bluetooth Temperature Data Logger Revenue undefined Forecast, by Region 2020 & 2033
- Table 4: Global Bluetooth Temperature Data Logger Revenue undefined Forecast, by Application 2020 & 2033
- Table 5: Global Bluetooth Temperature Data Logger Revenue undefined Forecast, by Type 2020 & 2033
- Table 6: Global Bluetooth Temperature Data Logger Revenue undefined Forecast, by Country 2020 & 2033
- Table 7: United States Bluetooth Temperature Data Logger Revenue (undefined) Forecast, by Application 2020 & 2033
- Table 8: Canada Bluetooth Temperature Data Logger Revenue (undefined) Forecast, by Application 2020 & 2033
- Table 9: Mexico Bluetooth Temperature Data Logger Revenue (undefined) Forecast, by Application 2020 & 2033
- Table 10: Global Bluetooth Temperature Data Logger Revenue undefined Forecast, by Application 2020 & 2033
- Table 11: Global Bluetooth Temperature Data Logger Revenue undefined Forecast, by Type 2020 & 2033
- Table 12: Global Bluetooth Temperature Data Logger Revenue undefined Forecast, by Country 2020 & 2033
- Table 13: Brazil Bluetooth Temperature Data Logger Revenue (undefined) Forecast, by Application 2020 & 2033
- Table 14: Argentina Bluetooth Temperature Data Logger Revenue (undefined) Forecast, by Application 2020 & 2033
- Table 15: Rest of South America Bluetooth Temperature Data Logger Revenue (undefined) Forecast, by Application 2020 & 2033
- Table 16: Global Bluetooth Temperature Data Logger Revenue undefined Forecast, by Application 2020 & 2033
- Table 17: Global Bluetooth Temperature Data Logger Revenue undefined Forecast, by Type 2020 & 2033
- Table 18: Global Bluetooth Temperature Data Logger Revenue undefined Forecast, by Country 2020 & 2033
- Table 19: United Kingdom Bluetooth Temperature Data Logger Revenue (undefined) Forecast, by Application 2020 & 2033
- Table 20: Germany Bluetooth Temperature Data Logger Revenue (undefined) Forecast, by Application 2020 & 2033
- Table 21: France Bluetooth Temperature Data Logger Revenue (undefined) Forecast, by Application 2020 & 2033
- Table 22: Italy Bluetooth Temperature Data Logger Revenue (undefined) Forecast, by Application 2020 & 2033
- Table 23: Spain Bluetooth Temperature Data Logger Revenue (undefined) Forecast, by Application 2020 & 2033
- Table 24: Russia Bluetooth Temperature Data Logger Revenue (undefined) Forecast, by Application 2020 & 2033
- Table 25: Benelux Bluetooth Temperature Data Logger Revenue (undefined) Forecast, by Application 2020 & 2033
- Table 26: Nordics Bluetooth Temperature Data Logger Revenue (undefined) Forecast, by Application 2020 & 2033
- Table 27: Rest of Europe Bluetooth Temperature Data Logger Revenue (undefined) Forecast, by Application 2020 & 2033
- Table 28: Global Bluetooth Temperature Data Logger Revenue undefined Forecast, by Application 2020 & 2033
- Table 29: Global Bluetooth Temperature Data Logger Revenue undefined Forecast, by Type 2020 & 2033
- Table 30: Global Bluetooth Temperature Data Logger Revenue undefined Forecast, by Country 2020 & 2033
- Table 31: Turkey Bluetooth Temperature Data Logger Revenue (undefined) Forecast, by Application 2020 & 2033
- Table 32: Israel Bluetooth Temperature Data Logger Revenue (undefined) Forecast, by Application 2020 & 2033
- Table 33: GCC Bluetooth Temperature Data Logger Revenue (undefined) Forecast, by Application 2020 & 2033
- Table 34: North Africa Bluetooth Temperature Data Logger Revenue (undefined) Forecast, by Application 2020 & 2033
- Table 35: South Africa Bluetooth Temperature Data Logger Revenue (undefined) Forecast, by Application 2020 & 2033
- Table 36: Rest of Middle East & Africa Bluetooth Temperature Data Logger Revenue (undefined) Forecast, by Application 2020 & 2033
- Table 37: Global Bluetooth Temperature Data Logger Revenue undefined Forecast, by Application 2020 & 2033
- Table 38: Global Bluetooth Temperature Data Logger Revenue undefined Forecast, by Type 2020 & 2033
- Table 39: Global Bluetooth Temperature Data Logger Revenue undefined Forecast, by Country 2020 & 2033
- Table 40: China Bluetooth Temperature Data Logger Revenue (undefined) Forecast, by Application 2020 & 2033
- Table 41: India Bluetooth Temperature Data Logger Revenue (undefined) Forecast, by Application 2020 & 2033
- Table 42: Japan Bluetooth Temperature Data Logger Revenue (undefined) Forecast, by Application 2020 & 2033
- Table 43: South Korea Bluetooth Temperature Data Logger Revenue (undefined) Forecast, by Application 2020 & 2033
- Table 44: ASEAN Bluetooth Temperature Data Logger Revenue (undefined) Forecast, by Application 2020 & 2033
- Table 45: Oceania Bluetooth Temperature Data Logger Revenue (undefined) Forecast, by Application 2020 & 2033
- Table 46: Rest of Asia Pacific Bluetooth Temperature Data Logger Revenue (undefined) Forecast, by Application 2020 & 2033
Frequently Asked Questions
1. What is the projected Compound Annual Growth Rate (CAGR) of the Bluetooth Temperature Data Logger?
The projected CAGR is approximately 12.78%.
2. Which companies are prominent players in the Bluetooth Temperature Data Logger?
Key companies in the market include AZ Instrument Corp, DicksonData, NOVUS Automation Inc., Elitech, Data Logger Products, TempSen, Traceable Products, Hangzhou Zeda Instruments, Tzone Digital Technology Co, MSR-Electronic GmbH, Synotronics, Onset, Lascar Electronics, DeltaTrak Inc., OCEASOFT, Wagner Meters, Data Harvest, Smashtag, Tecnosoft, METER Group, Labfacility Limited.
3. What are the main segments of the Bluetooth Temperature Data Logger?
The market segments include Application, Type.
4. Can you provide details about the market size?
The market size is estimated to be USD XXX N/A as of 2022.
5. What are some drivers contributing to market growth?
N/A
6. What are the notable trends driving market growth?
N/A
7. Are there any restraints impacting market growth?
N/A
8. Can you provide examples of recent developments in the market?
N/A
9. What pricing options are available for accessing the report?
Pricing options include single-user, multi-user, and enterprise licenses priced at USD 2900.00, USD 4350.00, and USD 5800.00 respectively.
10. Is the market size provided in terms of value or volume?
The market size is provided in terms of value, measured in N/A.
11. Are there any specific market keywords associated with the report?
Yes, the market keyword associated with the report is "Bluetooth Temperature Data Logger," which aids in identifying and referencing the specific market segment covered.
12. How do I determine which pricing option suits my needs best?
The pricing options vary based on user requirements and access needs. Individual users may opt for single-user licenses, while businesses requiring broader access may choose multi-user or enterprise licenses for cost-effective access to the report.
13. Are there any additional resources or data provided in the Bluetooth Temperature Data Logger report?
While the report offers comprehensive insights, it's advisable to review the specific contents or supplementary materials provided to ascertain if additional resources or data are available.
14. How can I stay updated on further developments or reports in the Bluetooth Temperature Data Logger?
To stay informed about further developments, trends, and reports in the Bluetooth Temperature Data Logger, consider subscribing to industry newsletters, following relevant companies and organizations, or regularly checking reputable industry news sources and publications.
Methodology
Step 1 - Identification of Relevant Samples Size from Population Database


Step 2 - Approaches for Defining Global Market Size (Value, Volume* & Price*)

Note*: In applicable scenarios
Step 3 - Data Sources
Primary Research
- Web Analytics
- Survey Reports
- Research Institute
- Latest Research Reports
- Opinion Leaders
Secondary Research
- Annual Reports
- White Paper
- Latest Press Release
- Industry Association
- Paid Database
- Investor Presentations

Step 4 - Data Triangulation
Involves using different sources of information in order to increase the validity of a study
These sources are likely to be stakeholders in a program - participants, other researchers, program staff, other community members, and so on.
Then we put all data in single framework & apply various statistical tools to find out the dynamic on the market.
During the analysis stage, feedback from the stakeholder groups would be compared to determine areas of agreement as well as areas of divergence