

Key Insights
The automotive SPAD lidar market is experiencing robust growth, driven by the increasing adoption of advanced driver-assistance systems (ADAS) and autonomous driving technologies. The market's expansion is fueled by the superior performance characteristics of SPAD lidar, including its high sensitivity, long range, and ability to operate effectively in various lighting conditions. This technology offers significant advantages over other lidar types, enabling more accurate object detection and classification, crucial for ensuring the safety and reliability of self-driving vehicles. The transition towards Level 3 and higher autonomy is a key catalyst for market growth, with manufacturers prioritizing SPAD lidar for its ability to meet the stringent performance requirements of these advanced systems. Solid-state SPAD lidar, in particular, is gaining traction due to its compact size, lower cost, and improved reliability compared to mechanical systems. The passenger car segment currently dominates the market, but commercial vehicle applications are showing significant growth potential, driven by the demand for enhanced safety features in trucking and fleet management. While the initial high cost of SPAD lidar is a restraint, ongoing technological advancements and economies of scale are predicted to drive down prices, making the technology more accessible to a wider range of vehicle manufacturers.
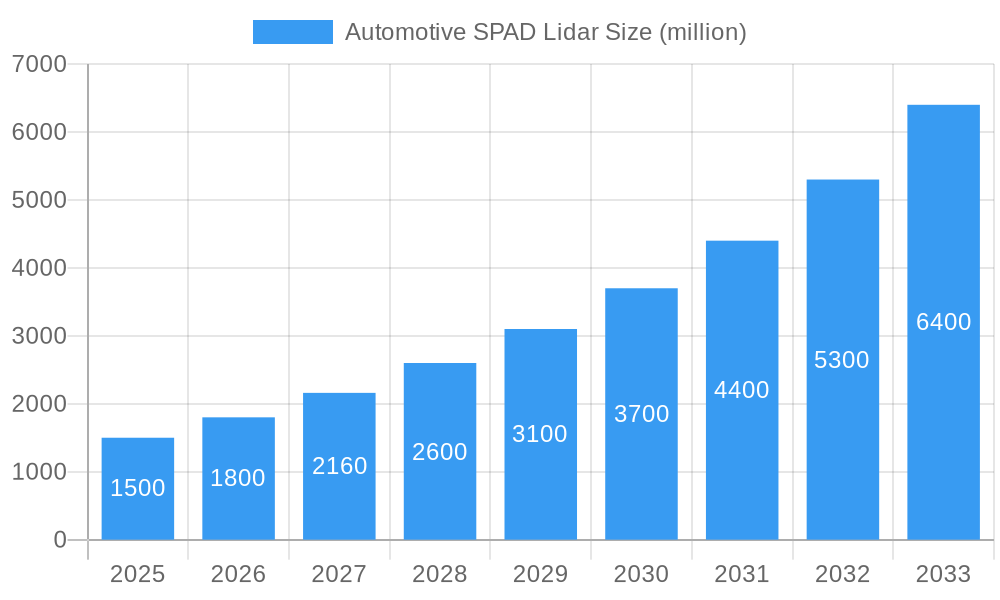
Automotive SPAD Lidar Market Size (In Billion)
The competitive landscape is dynamic, with established players like Ouster, Orbbec, and others alongside emerging companies constantly innovating. Geographic expansion is another significant trend, with North America and Europe currently leading the market due to advanced technological infrastructure and strong regulatory support for autonomous vehicle development. However, Asia-Pacific, particularly China and India, are rapidly emerging as major markets due to the increasing production of vehicles and governmental investments in infrastructure. The forecast period (2025-2033) promises substantial growth, driven by continued advancements in sensor technology, decreasing production costs, and the ongoing global push towards autonomous driving. The market's segmentation, encompassing both passenger and commercial vehicles and different lidar types, will continue to evolve, creating varied opportunities for market participants throughout this decade.
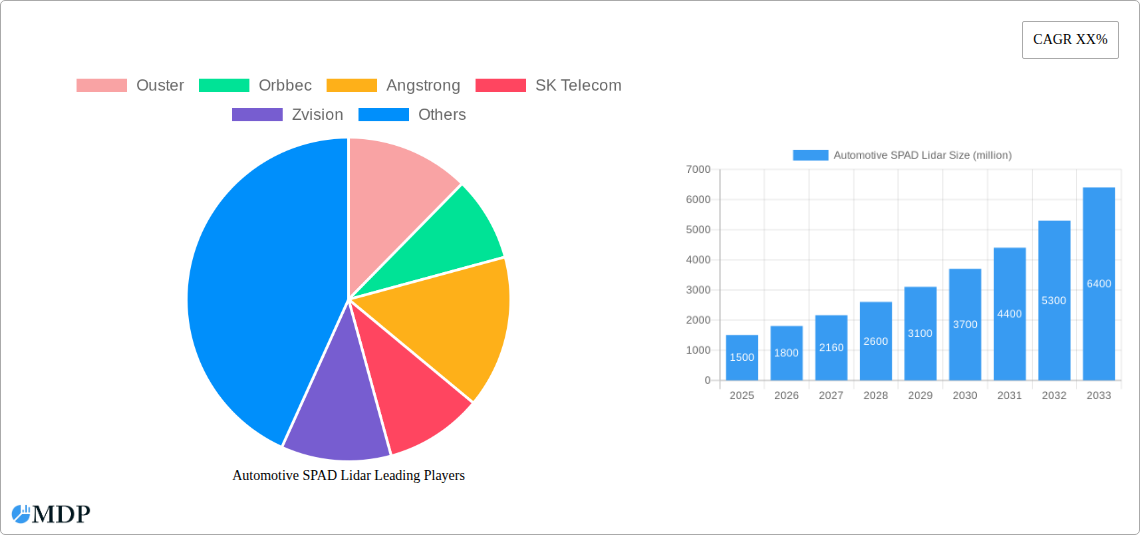
Automotive SPAD Lidar Company Market Share
Automotive SPAD Lidar Market Report: 2019-2033
This comprehensive report provides an in-depth analysis of the global Automotive SPAD Lidar market, offering invaluable insights for industry stakeholders, investors, and strategists. With a study period spanning 2019-2033, a base year of 2025, and a forecast period of 2025-2033, this report leverages extensive data analysis to project a market exceeding $XX billion by 2033. The report covers key market segments, including passenger cars and commercial vehicles, along with solid-state and mechanical SPAD lidar types. Leading companies like Ouster, Orbbec, Angstrom, SK Telecom, Zvision, Guowei TX, and Opsys are profiled, revealing their strategies and market positions within this rapidly evolving landscape.
Automotive SPAD Lidar Market Dynamics & Concentration
The Automotive SPAD Lidar market is experiencing dynamic growth fueled by the increasing demand for advanced driver-assistance systems (ADAS) and autonomous driving technologies. Market concentration is currently moderate, with a few key players holding significant shares, but the landscape is rapidly evolving due to continuous innovation and mergers & acquisitions (M&A). During the historical period (2019-2024), the market witnessed approximately xx M&A deals, primarily focused on technological integration and market expansion. The global market share in 2025 is estimated as follows: Ouster (xx%), Orbbec (xx%), Angstrom (xx%), SK Telecom (xx%), Zvision (xx%), Guowei TX (xx%), Opsys (xx%), and Others (xx%).
Innovation is a key driver, with advancements in SPAD technology leading to improved performance, reduced costs, and enhanced functionalities. Stringent regulatory frameworks governing vehicle safety and autonomous driving are also shaping market growth. Product substitutes, such as camera-based systems and radar, continue to compete, but SPAD Lidar's superior accuracy and long-range capabilities are driving its adoption. End-user trends, particularly the increasing preference for safer and more autonomous vehicles, further contribute to market expansion.
Automotive SPAD Lidar Industry Trends & Analysis
The Automotive SPAD Lidar market is characterized by a Compound Annual Growth Rate (CAGR) of xx% during the forecast period (2025-2033). This robust growth is driven by several factors. Technological advancements, particularly in miniaturization and cost reduction of SPAD sensors, are making lidar technology more accessible to a wider range of vehicle manufacturers. The increasing consumer preference for enhanced safety features and autonomous driving capabilities is a major market driver. The market penetration of SPAD lidar in passenger cars is expected to reach xx% by 2033, significantly higher than the xx% in 2025.
Intense competitive dynamics exist among established players and emerging startups. The entry of major technology companies into the market signifies its increasing strategic importance. Furthermore, significant investments in R&D are pushing the boundaries of SPAD Lidar technology, leading to improved range, resolution, and robustness. These factors combined with supportive government regulations and favorable economic conditions are creating a fertile ground for continued market expansion.
Leading Markets & Segments in Automotive SPAD Lidar
The Automotive SPAD Lidar market is witnessing significant regional variations in growth and adoption. While Asia Pacific is expected to be the dominant region by 2033, driven by high vehicle production rates and government support for autonomous vehicle initiatives in countries like China and Japan, North America is also a significant market with high demand from the passenger car segment.
Key Drivers for Asia Pacific Dominance:
- Strong government support for autonomous driving initiatives.
- High rate of vehicle production and sales.
- Growing investments in infrastructure supporting autonomous vehicles.
- Increased consumer adoption of ADAS-equipped vehicles.
Key Drivers for North America Dominance:
- High demand for luxury vehicles with advanced safety features.
- Strong presence of key automotive manufacturers.
- Growing investments in research and development of autonomous driving technologies.
The passenger car segment is expected to dominate the application segment due to increased demand for advanced safety and self-driving features. However, the commercial vehicle segment is also experiencing significant growth, driven by the demand for improved safety and efficiency in fleet management operations. The solid-state segment holds a larger market share than the mechanical segment owing to their advantages in cost, size, and reliability.
Automotive SPAD Lidar Product Developments
Recent product innovations focus on enhancing the performance and reducing the cost of SPAD Lidar sensors. The integration of advanced signal processing algorithms and improved manufacturing processes have led to higher accuracy, longer range, and better robustness in various environmental conditions. These advancements are enabling wider adoption of SPAD lidar across different vehicle segments, contributing to a better fit within the overall ADAS and autonomous driving ecosystem. Companies are also focused on developing smaller, more energy-efficient, and cost-effective SPAD lidar modules tailored for integration into various vehicle platforms.
Key Drivers of Automotive SPAD Lidar Growth
Several factors are driving the growth of the Automotive SPAD Lidar market. Firstly, the increasing demand for advanced driver-assistance systems (ADAS) and autonomous driving functionalities is a major catalyst. Secondly, technological advancements leading to improved performance, reduced costs, and increased reliability are expanding the market's reach. Finally, supportive government regulations promoting the adoption of autonomous vehicles are also fueling growth.
Challenges in the Automotive SPAD Lidar Market
Despite the considerable potential, the Automotive SPAD Lidar market faces some challenges. High manufacturing costs and limited production capacity hinder widespread adoption. Regulatory hurdles in various countries also pose significant challenges. Competition from alternative sensing technologies, like cameras and radar, presents a significant challenge. Furthermore, supply chain disruptions and the availability of raw materials influence cost and timely delivery of products, potentially impacting market growth.
Emerging Opportunities in Automotive SPAD Lidar
Long-term growth in the Automotive SPAD Lidar market is fueled by several emerging opportunities. Technological breakthroughs continue to drive down costs and improve performance, expanding market accessibility. Strategic partnerships between lidar manufacturers, automotive companies, and technology providers are unlocking synergies and innovation. Market expansion into new geographic regions, particularly in developing economies with rapidly growing automotive industries, presents significant potential for growth.
Leading Players in the Automotive SPAD Lidar Sector
- Ouster
- Orbbec
- Angstrom
- SK Telecom
- Zvision
- Guowei TX
- Opsys
Key Milestones in Automotive SPAD Lidar Industry
- 2020: Several major automotive manufacturers announced partnerships with SPAD lidar providers for autonomous vehicle development.
- 2021: Significant advancements in SPAD lidar technology led to improved performance and reduced costs.
- 2022: Several new SPAD lidar products were launched, catering to a wider range of applications.
- 2023: Increased investments in R&D accelerated innovation in the field.
- 2024: The introduction of robust, high-performance SPAD Lidar systems has driven further market growth.
Strategic Outlook for Automotive SPAD Lidar Market
The Automotive SPAD Lidar market is poised for significant expansion over the next decade. Continuous technological advancements, coupled with increased demand for ADAS and autonomous driving technologies, are major growth drivers. Strategic partnerships, focusing on technology integration and supply chain optimization, will further accelerate market expansion. The potential for market penetration in developing economies presents further opportunities for players in this dynamic sector. The market's future is bright, promising a significant increase in market size and widespread adoption across various automotive segments.
Automotive SPAD Lidar Segmentation
-
1. Application
- 1.1. Passenger Car
- 1.2. Commercial Car
-
2. Types
- 2.1. Solid State
- 2.2. Mechanical
Automotive SPAD Lidar Segmentation By Geography
-
1. North America
- 1.1. United States
- 1.2. Canada
- 1.3. Mexico
-
2. South America
- 2.1. Brazil
- 2.2. Argentina
- 2.3. Rest of South America
-
3. Europe
- 3.1. United Kingdom
- 3.2. Germany
- 3.3. France
- 3.4. Italy
- 3.5. Spain
- 3.6. Russia
- 3.7. Benelux
- 3.8. Nordics
- 3.9. Rest of Europe
-
4. Middle East & Africa
- 4.1. Turkey
- 4.2. Israel
- 4.3. GCC
- 4.4. North Africa
- 4.5. South Africa
- 4.6. Rest of Middle East & Africa
-
5. Asia Pacific
- 5.1. China
- 5.2. India
- 5.3. Japan
- 5.4. South Korea
- 5.5. ASEAN
- 5.6. Oceania
- 5.7. Rest of Asia Pacific

Automotive SPAD Lidar Regional Market Share
Geographic Coverage of Automotive SPAD Lidar
Automotive SPAD Lidar REPORT HIGHLIGHTS
| Aspects | Details |
|---|---|
| Study Period | 2020-2034 |
| Base Year | 2025 |
| Estimated Year | 2026 |
| Forecast Period | 2026-2034 |
| Historical Period | 2020-2025 |
| Growth Rate | CAGR of 34.2% from 2020-2034 |
| Segmentation |
|
Table of Contents
- 1. Introduction
- 1.1. Research Scope
- 1.2. Market Segmentation
- 1.3. Research Methodology
- 1.4. Definitions and Assumptions
- 2. Executive Summary
- 2.1. Introduction
- 3. Market Dynamics
- 3.1. Introduction
- 3.2. Market Drivers
- 3.3. Market Restrains
- 3.4. Market Trends
- 4. Market Factor Analysis
- 4.1. Porters Five Forces
- 4.2. Supply/Value Chain
- 4.3. PESTEL analysis
- 4.4. Market Entropy
- 4.5. Patent/Trademark Analysis
- 5. Global Automotive SPAD Lidar Analysis, Insights and Forecast, 2020-2032
- 5.1. Market Analysis, Insights and Forecast - by Application
- 5.1.1. Passenger Car
- 5.1.2. Commercial Car
- 5.2. Market Analysis, Insights and Forecast - by Types
- 5.2.1. Solid State
- 5.2.2. Mechanical
- 5.3. Market Analysis, Insights and Forecast - by Region
- 5.3.1. North America
- 5.3.2. South America
- 5.3.3. Europe
- 5.3.4. Middle East & Africa
- 5.3.5. Asia Pacific
- 5.1. Market Analysis, Insights and Forecast - by Application
- 6. North America Automotive SPAD Lidar Analysis, Insights and Forecast, 2020-2032
- 6.1. Market Analysis, Insights and Forecast - by Application
- 6.1.1. Passenger Car
- 6.1.2. Commercial Car
- 6.2. Market Analysis, Insights and Forecast - by Types
- 6.2.1. Solid State
- 6.2.2. Mechanical
- 6.1. Market Analysis, Insights and Forecast - by Application
- 7. South America Automotive SPAD Lidar Analysis, Insights and Forecast, 2020-2032
- 7.1. Market Analysis, Insights and Forecast - by Application
- 7.1.1. Passenger Car
- 7.1.2. Commercial Car
- 7.2. Market Analysis, Insights and Forecast - by Types
- 7.2.1. Solid State
- 7.2.2. Mechanical
- 7.1. Market Analysis, Insights and Forecast - by Application
- 8. Europe Automotive SPAD Lidar Analysis, Insights and Forecast, 2020-2032
- 8.1. Market Analysis, Insights and Forecast - by Application
- 8.1.1. Passenger Car
- 8.1.2. Commercial Car
- 8.2. Market Analysis, Insights and Forecast - by Types
- 8.2.1. Solid State
- 8.2.2. Mechanical
- 8.1. Market Analysis, Insights and Forecast - by Application
- 9. Middle East & Africa Automotive SPAD Lidar Analysis, Insights and Forecast, 2020-2032
- 9.1. Market Analysis, Insights and Forecast - by Application
- 9.1.1. Passenger Car
- 9.1.2. Commercial Car
- 9.2. Market Analysis, Insights and Forecast - by Types
- 9.2.1. Solid State
- 9.2.2. Mechanical
- 9.1. Market Analysis, Insights and Forecast - by Application
- 10. Asia Pacific Automotive SPAD Lidar Analysis, Insights and Forecast, 2020-2032
- 10.1. Market Analysis, Insights and Forecast - by Application
- 10.1.1. Passenger Car
- 10.1.2. Commercial Car
- 10.2. Market Analysis, Insights and Forecast - by Types
- 10.2.1. Solid State
- 10.2.2. Mechanical
- 10.1. Market Analysis, Insights and Forecast - by Application
- 11. Competitive Analysis
- 11.1. Global Market Share Analysis 2025
- 11.2. Company Profiles
- 11.2.1 Ouster
- 11.2.1.1. Overview
- 11.2.1.2. Products
- 11.2.1.3. SWOT Analysis
- 11.2.1.4. Recent Developments
- 11.2.1.5. Financials (Based on Availability)
- 11.2.2 Orbbec
- 11.2.2.1. Overview
- 11.2.2.2. Products
- 11.2.2.3. SWOT Analysis
- 11.2.2.4. Recent Developments
- 11.2.2.5. Financials (Based on Availability)
- 11.2.3 Angstrong
- 11.2.3.1. Overview
- 11.2.3.2. Products
- 11.2.3.3. SWOT Analysis
- 11.2.3.4. Recent Developments
- 11.2.3.5. Financials (Based on Availability)
- 11.2.4 SK Telecom
- 11.2.4.1. Overview
- 11.2.4.2. Products
- 11.2.4.3. SWOT Analysis
- 11.2.4.4. Recent Developments
- 11.2.4.5. Financials (Based on Availability)
- 11.2.5 Zvision
- 11.2.5.1. Overview
- 11.2.5.2. Products
- 11.2.5.3. SWOT Analysis
- 11.2.5.4. Recent Developments
- 11.2.5.5. Financials (Based on Availability)
- 11.2.6 Guowei TX
- 11.2.6.1. Overview
- 11.2.6.2. Products
- 11.2.6.3. SWOT Analysis
- 11.2.6.4. Recent Developments
- 11.2.6.5. Financials (Based on Availability)
- 11.2.7 Opsys
- 11.2.7.1. Overview
- 11.2.7.2. Products
- 11.2.7.3. SWOT Analysis
- 11.2.7.4. Recent Developments
- 11.2.7.5. Financials (Based on Availability)
- 11.2.1 Ouster
List of Figures
- Figure 1: Global Automotive SPAD Lidar Revenue Breakdown (undefined, %) by Region 2025 & 2033
- Figure 2: Global Automotive SPAD Lidar Volume Breakdown (K, %) by Region 2025 & 2033
- Figure 3: North America Automotive SPAD Lidar Revenue (undefined), by Application 2025 & 2033
- Figure 4: North America Automotive SPAD Lidar Volume (K), by Application 2025 & 2033
- Figure 5: North America Automotive SPAD Lidar Revenue Share (%), by Application 2025 & 2033
- Figure 6: North America Automotive SPAD Lidar Volume Share (%), by Application 2025 & 2033
- Figure 7: North America Automotive SPAD Lidar Revenue (undefined), by Types 2025 & 2033
- Figure 8: North America Automotive SPAD Lidar Volume (K), by Types 2025 & 2033
- Figure 9: North America Automotive SPAD Lidar Revenue Share (%), by Types 2025 & 2033
- Figure 10: North America Automotive SPAD Lidar Volume Share (%), by Types 2025 & 2033
- Figure 11: North America Automotive SPAD Lidar Revenue (undefined), by Country 2025 & 2033
- Figure 12: North America Automotive SPAD Lidar Volume (K), by Country 2025 & 2033
- Figure 13: North America Automotive SPAD Lidar Revenue Share (%), by Country 2025 & 2033
- Figure 14: North America Automotive SPAD Lidar Volume Share (%), by Country 2025 & 2033
- Figure 15: South America Automotive SPAD Lidar Revenue (undefined), by Application 2025 & 2033
- Figure 16: South America Automotive SPAD Lidar Volume (K), by Application 2025 & 2033
- Figure 17: South America Automotive SPAD Lidar Revenue Share (%), by Application 2025 & 2033
- Figure 18: South America Automotive SPAD Lidar Volume Share (%), by Application 2025 & 2033
- Figure 19: South America Automotive SPAD Lidar Revenue (undefined), by Types 2025 & 2033
- Figure 20: South America Automotive SPAD Lidar Volume (K), by Types 2025 & 2033
- Figure 21: South America Automotive SPAD Lidar Revenue Share (%), by Types 2025 & 2033
- Figure 22: South America Automotive SPAD Lidar Volume Share (%), by Types 2025 & 2033
- Figure 23: South America Automotive SPAD Lidar Revenue (undefined), by Country 2025 & 2033
- Figure 24: South America Automotive SPAD Lidar Volume (K), by Country 2025 & 2033
- Figure 25: South America Automotive SPAD Lidar Revenue Share (%), by Country 2025 & 2033
- Figure 26: South America Automotive SPAD Lidar Volume Share (%), by Country 2025 & 2033
- Figure 27: Europe Automotive SPAD Lidar Revenue (undefined), by Application 2025 & 2033
- Figure 28: Europe Automotive SPAD Lidar Volume (K), by Application 2025 & 2033
- Figure 29: Europe Automotive SPAD Lidar Revenue Share (%), by Application 2025 & 2033
- Figure 30: Europe Automotive SPAD Lidar Volume Share (%), by Application 2025 & 2033
- Figure 31: Europe Automotive SPAD Lidar Revenue (undefined), by Types 2025 & 2033
- Figure 32: Europe Automotive SPAD Lidar Volume (K), by Types 2025 & 2033
- Figure 33: Europe Automotive SPAD Lidar Revenue Share (%), by Types 2025 & 2033
- Figure 34: Europe Automotive SPAD Lidar Volume Share (%), by Types 2025 & 2033
- Figure 35: Europe Automotive SPAD Lidar Revenue (undefined), by Country 2025 & 2033
- Figure 36: Europe Automotive SPAD Lidar Volume (K), by Country 2025 & 2033
- Figure 37: Europe Automotive SPAD Lidar Revenue Share (%), by Country 2025 & 2033
- Figure 38: Europe Automotive SPAD Lidar Volume Share (%), by Country 2025 & 2033
- Figure 39: Middle East & Africa Automotive SPAD Lidar Revenue (undefined), by Application 2025 & 2033
- Figure 40: Middle East & Africa Automotive SPAD Lidar Volume (K), by Application 2025 & 2033
- Figure 41: Middle East & Africa Automotive SPAD Lidar Revenue Share (%), by Application 2025 & 2033
- Figure 42: Middle East & Africa Automotive SPAD Lidar Volume Share (%), by Application 2025 & 2033
- Figure 43: Middle East & Africa Automotive SPAD Lidar Revenue (undefined), by Types 2025 & 2033
- Figure 44: Middle East & Africa Automotive SPAD Lidar Volume (K), by Types 2025 & 2033
- Figure 45: Middle East & Africa Automotive SPAD Lidar Revenue Share (%), by Types 2025 & 2033
- Figure 46: Middle East & Africa Automotive SPAD Lidar Volume Share (%), by Types 2025 & 2033
- Figure 47: Middle East & Africa Automotive SPAD Lidar Revenue (undefined), by Country 2025 & 2033
- Figure 48: Middle East & Africa Automotive SPAD Lidar Volume (K), by Country 2025 & 2033
- Figure 49: Middle East & Africa Automotive SPAD Lidar Revenue Share (%), by Country 2025 & 2033
- Figure 50: Middle East & Africa Automotive SPAD Lidar Volume Share (%), by Country 2025 & 2033
- Figure 51: Asia Pacific Automotive SPAD Lidar Revenue (undefined), by Application 2025 & 2033
- Figure 52: Asia Pacific Automotive SPAD Lidar Volume (K), by Application 2025 & 2033
- Figure 53: Asia Pacific Automotive SPAD Lidar Revenue Share (%), by Application 2025 & 2033
- Figure 54: Asia Pacific Automotive SPAD Lidar Volume Share (%), by Application 2025 & 2033
- Figure 55: Asia Pacific Automotive SPAD Lidar Revenue (undefined), by Types 2025 & 2033
- Figure 56: Asia Pacific Automotive SPAD Lidar Volume (K), by Types 2025 & 2033
- Figure 57: Asia Pacific Automotive SPAD Lidar Revenue Share (%), by Types 2025 & 2033
- Figure 58: Asia Pacific Automotive SPAD Lidar Volume Share (%), by Types 2025 & 2033
- Figure 59: Asia Pacific Automotive SPAD Lidar Revenue (undefined), by Country 2025 & 2033
- Figure 60: Asia Pacific Automotive SPAD Lidar Volume (K), by Country 2025 & 2033
- Figure 61: Asia Pacific Automotive SPAD Lidar Revenue Share (%), by Country 2025 & 2033
- Figure 62: Asia Pacific Automotive SPAD Lidar Volume Share (%), by Country 2025 & 2033
List of Tables
- Table 1: Global Automotive SPAD Lidar Revenue undefined Forecast, by Application 2020 & 2033
- Table 2: Global Automotive SPAD Lidar Volume K Forecast, by Application 2020 & 2033
- Table 3: Global Automotive SPAD Lidar Revenue undefined Forecast, by Types 2020 & 2033
- Table 4: Global Automotive SPAD Lidar Volume K Forecast, by Types 2020 & 2033
- Table 5: Global Automotive SPAD Lidar Revenue undefined Forecast, by Region 2020 & 2033
- Table 6: Global Automotive SPAD Lidar Volume K Forecast, by Region 2020 & 2033
- Table 7: Global Automotive SPAD Lidar Revenue undefined Forecast, by Application 2020 & 2033
- Table 8: Global Automotive SPAD Lidar Volume K Forecast, by Application 2020 & 2033
- Table 9: Global Automotive SPAD Lidar Revenue undefined Forecast, by Types 2020 & 2033
- Table 10: Global Automotive SPAD Lidar Volume K Forecast, by Types 2020 & 2033
- Table 11: Global Automotive SPAD Lidar Revenue undefined Forecast, by Country 2020 & 2033
- Table 12: Global Automotive SPAD Lidar Volume K Forecast, by Country 2020 & 2033
- Table 13: United States Automotive SPAD Lidar Revenue (undefined) Forecast, by Application 2020 & 2033
- Table 14: United States Automotive SPAD Lidar Volume (K) Forecast, by Application 2020 & 2033
- Table 15: Canada Automotive SPAD Lidar Revenue (undefined) Forecast, by Application 2020 & 2033
- Table 16: Canada Automotive SPAD Lidar Volume (K) Forecast, by Application 2020 & 2033
- Table 17: Mexico Automotive SPAD Lidar Revenue (undefined) Forecast, by Application 2020 & 2033
- Table 18: Mexico Automotive SPAD Lidar Volume (K) Forecast, by Application 2020 & 2033
- Table 19: Global Automotive SPAD Lidar Revenue undefined Forecast, by Application 2020 & 2033
- Table 20: Global Automotive SPAD Lidar Volume K Forecast, by Application 2020 & 2033
- Table 21: Global Automotive SPAD Lidar Revenue undefined Forecast, by Types 2020 & 2033
- Table 22: Global Automotive SPAD Lidar Volume K Forecast, by Types 2020 & 2033
- Table 23: Global Automotive SPAD Lidar Revenue undefined Forecast, by Country 2020 & 2033
- Table 24: Global Automotive SPAD Lidar Volume K Forecast, by Country 2020 & 2033
- Table 25: Brazil Automotive SPAD Lidar Revenue (undefined) Forecast, by Application 2020 & 2033
- Table 26: Brazil Automotive SPAD Lidar Volume (K) Forecast, by Application 2020 & 2033
- Table 27: Argentina Automotive SPAD Lidar Revenue (undefined) Forecast, by Application 2020 & 2033
- Table 28: Argentina Automotive SPAD Lidar Volume (K) Forecast, by Application 2020 & 2033
- Table 29: Rest of South America Automotive SPAD Lidar Revenue (undefined) Forecast, by Application 2020 & 2033
- Table 30: Rest of South America Automotive SPAD Lidar Volume (K) Forecast, by Application 2020 & 2033
- Table 31: Global Automotive SPAD Lidar Revenue undefined Forecast, by Application 2020 & 2033
- Table 32: Global Automotive SPAD Lidar Volume K Forecast, by Application 2020 & 2033
- Table 33: Global Automotive SPAD Lidar Revenue undefined Forecast, by Types 2020 & 2033
- Table 34: Global Automotive SPAD Lidar Volume K Forecast, by Types 2020 & 2033
- Table 35: Global Automotive SPAD Lidar Revenue undefined Forecast, by Country 2020 & 2033
- Table 36: Global Automotive SPAD Lidar Volume K Forecast, by Country 2020 & 2033
- Table 37: United Kingdom Automotive SPAD Lidar Revenue (undefined) Forecast, by Application 2020 & 2033
- Table 38: United Kingdom Automotive SPAD Lidar Volume (K) Forecast, by Application 2020 & 2033
- Table 39: Germany Automotive SPAD Lidar Revenue (undefined) Forecast, by Application 2020 & 2033
- Table 40: Germany Automotive SPAD Lidar Volume (K) Forecast, by Application 2020 & 2033
- Table 41: France Automotive SPAD Lidar Revenue (undefined) Forecast, by Application 2020 & 2033
- Table 42: France Automotive SPAD Lidar Volume (K) Forecast, by Application 2020 & 2033
- Table 43: Italy Automotive SPAD Lidar Revenue (undefined) Forecast, by Application 2020 & 2033
- Table 44: Italy Automotive SPAD Lidar Volume (K) Forecast, by Application 2020 & 2033
- Table 45: Spain Automotive SPAD Lidar Revenue (undefined) Forecast, by Application 2020 & 2033
- Table 46: Spain Automotive SPAD Lidar Volume (K) Forecast, by Application 2020 & 2033
- Table 47: Russia Automotive SPAD Lidar Revenue (undefined) Forecast, by Application 2020 & 2033
- Table 48: Russia Automotive SPAD Lidar Volume (K) Forecast, by Application 2020 & 2033
- Table 49: Benelux Automotive SPAD Lidar Revenue (undefined) Forecast, by Application 2020 & 2033
- Table 50: Benelux Automotive SPAD Lidar Volume (K) Forecast, by Application 2020 & 2033
- Table 51: Nordics Automotive SPAD Lidar Revenue (undefined) Forecast, by Application 2020 & 2033
- Table 52: Nordics Automotive SPAD Lidar Volume (K) Forecast, by Application 2020 & 2033
- Table 53: Rest of Europe Automotive SPAD Lidar Revenue (undefined) Forecast, by Application 2020 & 2033
- Table 54: Rest of Europe Automotive SPAD Lidar Volume (K) Forecast, by Application 2020 & 2033
- Table 55: Global Automotive SPAD Lidar Revenue undefined Forecast, by Application 2020 & 2033
- Table 56: Global Automotive SPAD Lidar Volume K Forecast, by Application 2020 & 2033
- Table 57: Global Automotive SPAD Lidar Revenue undefined Forecast, by Types 2020 & 2033
- Table 58: Global Automotive SPAD Lidar Volume K Forecast, by Types 2020 & 2033
- Table 59: Global Automotive SPAD Lidar Revenue undefined Forecast, by Country 2020 & 2033
- Table 60: Global Automotive SPAD Lidar Volume K Forecast, by Country 2020 & 2033
- Table 61: Turkey Automotive SPAD Lidar Revenue (undefined) Forecast, by Application 2020 & 2033
- Table 62: Turkey Automotive SPAD Lidar Volume (K) Forecast, by Application 2020 & 2033
- Table 63: Israel Automotive SPAD Lidar Revenue (undefined) Forecast, by Application 2020 & 2033
- Table 64: Israel Automotive SPAD Lidar Volume (K) Forecast, by Application 2020 & 2033
- Table 65: GCC Automotive SPAD Lidar Revenue (undefined) Forecast, by Application 2020 & 2033
- Table 66: GCC Automotive SPAD Lidar Volume (K) Forecast, by Application 2020 & 2033
- Table 67: North Africa Automotive SPAD Lidar Revenue (undefined) Forecast, by Application 2020 & 2033
- Table 68: North Africa Automotive SPAD Lidar Volume (K) Forecast, by Application 2020 & 2033
- Table 69: South Africa Automotive SPAD Lidar Revenue (undefined) Forecast, by Application 2020 & 2033
- Table 70: South Africa Automotive SPAD Lidar Volume (K) Forecast, by Application 2020 & 2033
- Table 71: Rest of Middle East & Africa Automotive SPAD Lidar Revenue (undefined) Forecast, by Application 2020 & 2033
- Table 72: Rest of Middle East & Africa Automotive SPAD Lidar Volume (K) Forecast, by Application 2020 & 2033
- Table 73: Global Automotive SPAD Lidar Revenue undefined Forecast, by Application 2020 & 2033
- Table 74: Global Automotive SPAD Lidar Volume K Forecast, by Application 2020 & 2033
- Table 75: Global Automotive SPAD Lidar Revenue undefined Forecast, by Types 2020 & 2033
- Table 76: Global Automotive SPAD Lidar Volume K Forecast, by Types 2020 & 2033
- Table 77: Global Automotive SPAD Lidar Revenue undefined Forecast, by Country 2020 & 2033
- Table 78: Global Automotive SPAD Lidar Volume K Forecast, by Country 2020 & 2033
- Table 79: China Automotive SPAD Lidar Revenue (undefined) Forecast, by Application 2020 & 2033
- Table 80: China Automotive SPAD Lidar Volume (K) Forecast, by Application 2020 & 2033
- Table 81: India Automotive SPAD Lidar Revenue (undefined) Forecast, by Application 2020 & 2033
- Table 82: India Automotive SPAD Lidar Volume (K) Forecast, by Application 2020 & 2033
- Table 83: Japan Automotive SPAD Lidar Revenue (undefined) Forecast, by Application 2020 & 2033
- Table 84: Japan Automotive SPAD Lidar Volume (K) Forecast, by Application 2020 & 2033
- Table 85: South Korea Automotive SPAD Lidar Revenue (undefined) Forecast, by Application 2020 & 2033
- Table 86: South Korea Automotive SPAD Lidar Volume (K) Forecast, by Application 2020 & 2033
- Table 87: ASEAN Automotive SPAD Lidar Revenue (undefined) Forecast, by Application 2020 & 2033
- Table 88: ASEAN Automotive SPAD Lidar Volume (K) Forecast, by Application 2020 & 2033
- Table 89: Oceania Automotive SPAD Lidar Revenue (undefined) Forecast, by Application 2020 & 2033
- Table 90: Oceania Automotive SPAD Lidar Volume (K) Forecast, by Application 2020 & 2033
- Table 91: Rest of Asia Pacific Automotive SPAD Lidar Revenue (undefined) Forecast, by Application 2020 & 2033
- Table 92: Rest of Asia Pacific Automotive SPAD Lidar Volume (K) Forecast, by Application 2020 & 2033
Frequently Asked Questions
1. What is the projected Compound Annual Growth Rate (CAGR) of the Automotive SPAD Lidar?
The projected CAGR is approximately 34.2%.
2. Which companies are prominent players in the Automotive SPAD Lidar?
Key companies in the market include Ouster, Orbbec, Angstrong, SK Telecom, Zvision, Guowei TX, Opsys.
3. What are the main segments of the Automotive SPAD Lidar?
The market segments include Application, Types.
4. Can you provide details about the market size?
The market size is estimated to be USD XXX N/A as of 2022.
5. What are some drivers contributing to market growth?
N/A
6. What are the notable trends driving market growth?
N/A
7. Are there any restraints impacting market growth?
N/A
8. Can you provide examples of recent developments in the market?
N/A
9. What pricing options are available for accessing the report?
Pricing options include single-user, multi-user, and enterprise licenses priced at USD 3950.00, USD 5925.00, and USD 7900.00 respectively.
10. Is the market size provided in terms of value or volume?
The market size is provided in terms of value, measured in N/A and volume, measured in K.
11. Are there any specific market keywords associated with the report?
Yes, the market keyword associated with the report is "Automotive SPAD Lidar," which aids in identifying and referencing the specific market segment covered.
12. How do I determine which pricing option suits my needs best?
The pricing options vary based on user requirements and access needs. Individual users may opt for single-user licenses, while businesses requiring broader access may choose multi-user or enterprise licenses for cost-effective access to the report.
13. Are there any additional resources or data provided in the Automotive SPAD Lidar report?
While the report offers comprehensive insights, it's advisable to review the specific contents or supplementary materials provided to ascertain if additional resources or data are available.
14. How can I stay updated on further developments or reports in the Automotive SPAD Lidar?
To stay informed about further developments, trends, and reports in the Automotive SPAD Lidar, consider subscribing to industry newsletters, following relevant companies and organizations, or regularly checking reputable industry news sources and publications.
Methodology
Step 1 - Identification of Relevant Samples Size from Population Database


Step 2 - Approaches for Defining Global Market Size (Value, Volume* & Price*)

Note*: In applicable scenarios
Step 3 - Data Sources
Primary Research
- Web Analytics
- Survey Reports
- Research Institute
- Latest Research Reports
- Opinion Leaders
Secondary Research
- Annual Reports
- White Paper
- Latest Press Release
- Industry Association
- Paid Database
- Investor Presentations

Step 4 - Data Triangulation
Involves using different sources of information in order to increase the validity of a study
These sources are likely to be stakeholders in a program - participants, other researchers, program staff, other community members, and so on.
Then we put all data in single framework & apply various statistical tools to find out the dynamic on the market.
During the analysis stage, feedback from the stakeholder groups would be compared to determine areas of agreement as well as areas of divergence