

Key Insights
The global antihypertensive market is poised for significant expansion, projecting a market size of $25.88 billion in 2025, with a robust CAGR of 3.96%. This growth is primarily fueled by the escalating prevalence of hypertension worldwide, driven by an aging population, increasingly sedentary lifestyles, and the rising incidence of associated comorbidities such as obesity and diabetes. The expanding healthcare infrastructure, particularly in emerging economies, coupled with increased patient awareness and access to advanced diagnostic and treatment options, further bolsters market momentum. The pharmaceutical industry's continuous investment in research and development for novel and more effective antihypertensive therapies, including combination drugs and personalized medicine approaches, is also a key determinant in this upward trajectory. The market is witnessing a discernible shift towards patient-centric care, emphasizing adherence and long-term management, which is fostering innovation in drug delivery systems and digital health solutions that complement pharmaceutical treatments.
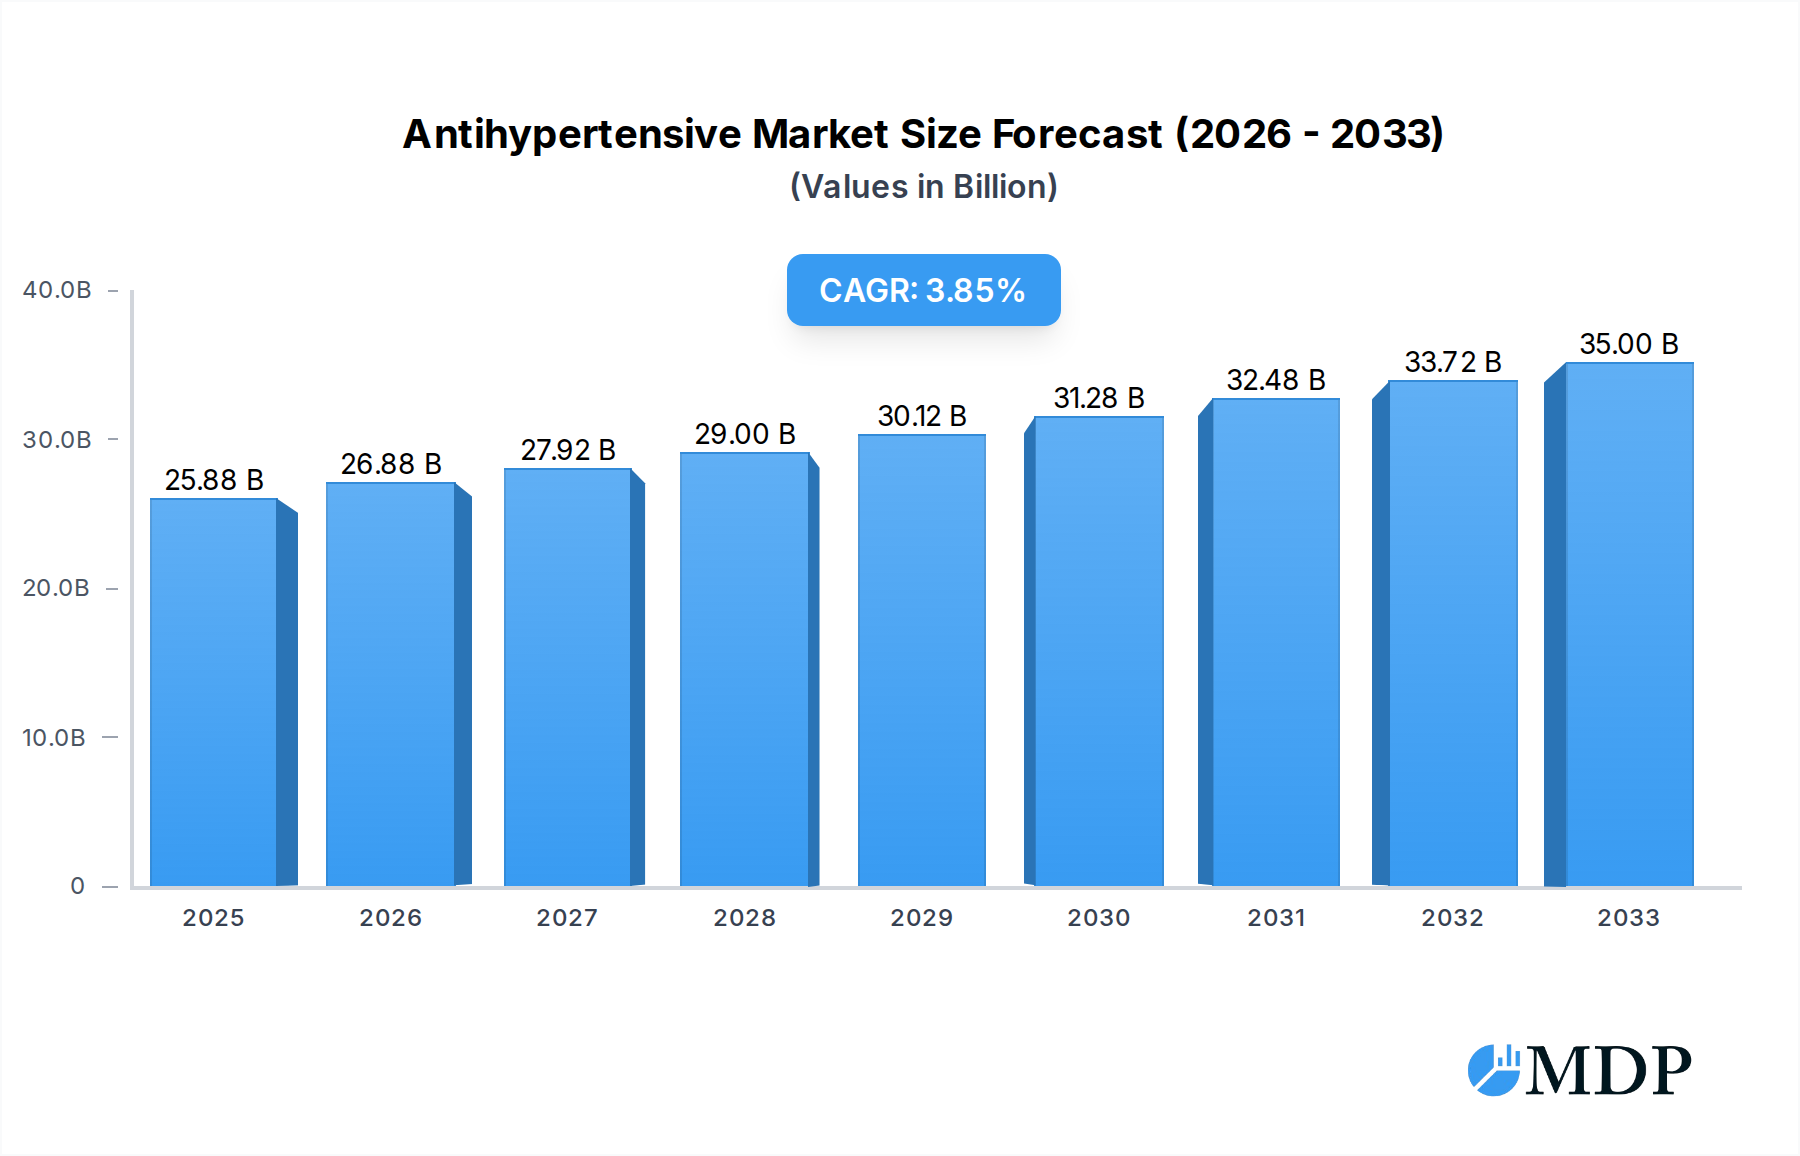
Antihypertensive Market Size (In Billion)
The market's expansion is supported by a diverse range of therapeutic classes, including Diuretics, ACE Inhibitors, ARBs, Calcium Channel Blockers, Beta Blockers, Alpha Blockers, Vasodilators, and Renin Inhibitors, catering to various patient needs and treatment protocols. Distribution channels are evolving, with a notable surge in online pharmacies complementing traditional hospital and retail pharmacy segments, driven by convenience and accessibility, especially in the wake of recent global health events. Geographically, North America and Europe represent mature markets with high adoption rates, while the Asia Pacific region is emerging as a critical growth engine, spurred by increasing healthcare expenditure and a large, underserved population. Despite the positive outlook, challenges such as stringent regulatory approvals, the development of drug resistance, and the high cost of novel therapies can temper growth. However, the overwhelming global burden of cardiovascular diseases, with hypertension as a primary risk factor, ensures sustained demand and continued innovation within the antihypertensive landscape.

Antihypertensive Company Market Share
This in-depth report offers a strategic overview of the global Antihypertensive market, providing critical insights for industry stakeholders from 2019 to 2033. Analyzing key segments, market dynamics, and competitive landscapes, this study is designed to equip pharmaceutical companies, healthcare providers, and investors with actionable intelligence to navigate the evolving marketplace. The report focuses on the significant growth and transformative potential within the hypertension treatment sector, with a projected market value estimated to reach billions.
Antihypertensive Market Dynamics & Concentration
The global antihypertensive market, valued in the billions, is characterized by a moderately concentrated landscape with a mix of established pharmaceutical giants and emerging players. Innovation remains a key driver, fueled by advancements in drug discovery and a growing understanding of cardiovascular disease pathophysiology. Regulatory frameworks, including stringent FDA and EMA approvals, significantly influence market entry and product development, with timelines often spanning several years and requiring substantial investment, estimated to be in the hundreds of billions for research and development. Product substitutes, while present in the form of lifestyle interventions and alternative therapies, are increasingly integrated with pharmacotherapy rather than replacing it entirely. End-user trends reveal a growing preference for combination therapies and patient-centric treatment approaches, driven by a desire for improved efficacy and reduced side effects. The market has witnessed significant Mergers & Acquisitions (M&A) activity, with strategic consolidations aiming to expand product portfolios, enhance R&D capabilities, and achieve economies of scale. Deal values are estimated to be in the billions, reflecting the strategic importance of this sector. Market share distribution is largely dominated by leading companies, with top players holding substantial portions of the multi-billion dollar market.
- Market Concentration: Moderately concentrated, with a few dominant global players and a growing number of specialized firms.
- Innovation Drivers: Novel drug targets, personalized medicine approaches, and advanced drug delivery systems.
- Regulatory Frameworks: Stringent approval processes by agencies like the FDA and EMA, impacting R&D timelines and costs.
- Product Substitutes: Lifestyle modifications (diet, exercise), alternative medicine, and evolving interventional cardiology procedures.
- End-User Trends: Demand for combination therapies, personalized treatment plans, and adherence-improving solutions.
- M&A Activities: Strategic acquisitions and partnerships to consolidate market share, gain access to new technologies, and broaden therapeutic offerings. Deal values are in the billions.
Antihypertensive Industry Trends & Analysis
The antihypertensive industry is on a trajectory of robust growth, driven by an escalating global prevalence of hypertension, a condition affecting billions worldwide. This chronic disease, often exacerbated by sedentary lifestyles, unhealthy diets, and an aging population, necessitates continuous and effective treatment solutions. The projected Compound Annual Growth Rate (CAGR) for the antihypertensive market is substantial, estimated to be in the xx% range, translating into billions in annual revenue growth. Technological disruptions are playing a pivotal role, with the advent of precision medicine and the exploration of novel therapeutic targets promising more personalized and effective treatment regimens. Advances in digital health, including remote patient monitoring devices and AI-driven diagnostic tools, are enhancing treatment adherence and allowing for proactive management of blood pressure, further contributing to market penetration. Consumer preferences are shifting towards therapies that offer improved quality of life, fewer side effects, and convenient administration. This is leading to increased demand for combination pills and long-acting formulations. The competitive dynamics are intensifying, with pharmaceutical giants investing heavily in research and development of next-generation antihypertensive drugs. The market penetration of generic alternatives also exerts pressure on pricing, fostering a competitive environment that benefits patients through accessibility. The estimated market value is expected to reach hundreds of billions by the end of the forecast period.
- Market Growth Drivers: Increasing prevalence of hypertension, aging global population, rise in associated cardiovascular diseases.
- Technological Disruptions: Precision medicine, AI in diagnostics, wearable monitoring devices, novel drug delivery systems.
- Consumer Preferences: Demand for combination therapies, reduced side effects, enhanced patient adherence, convenience.
- Competitive Dynamics: Intense R&D investment by major players, generic competition, strategic partnerships for drug development.
- Market Penetration: Growing awareness campaigns, improved healthcare infrastructure in developing regions, and expanded access to diagnostics.
Leading Markets & Segments in Antihypertensive
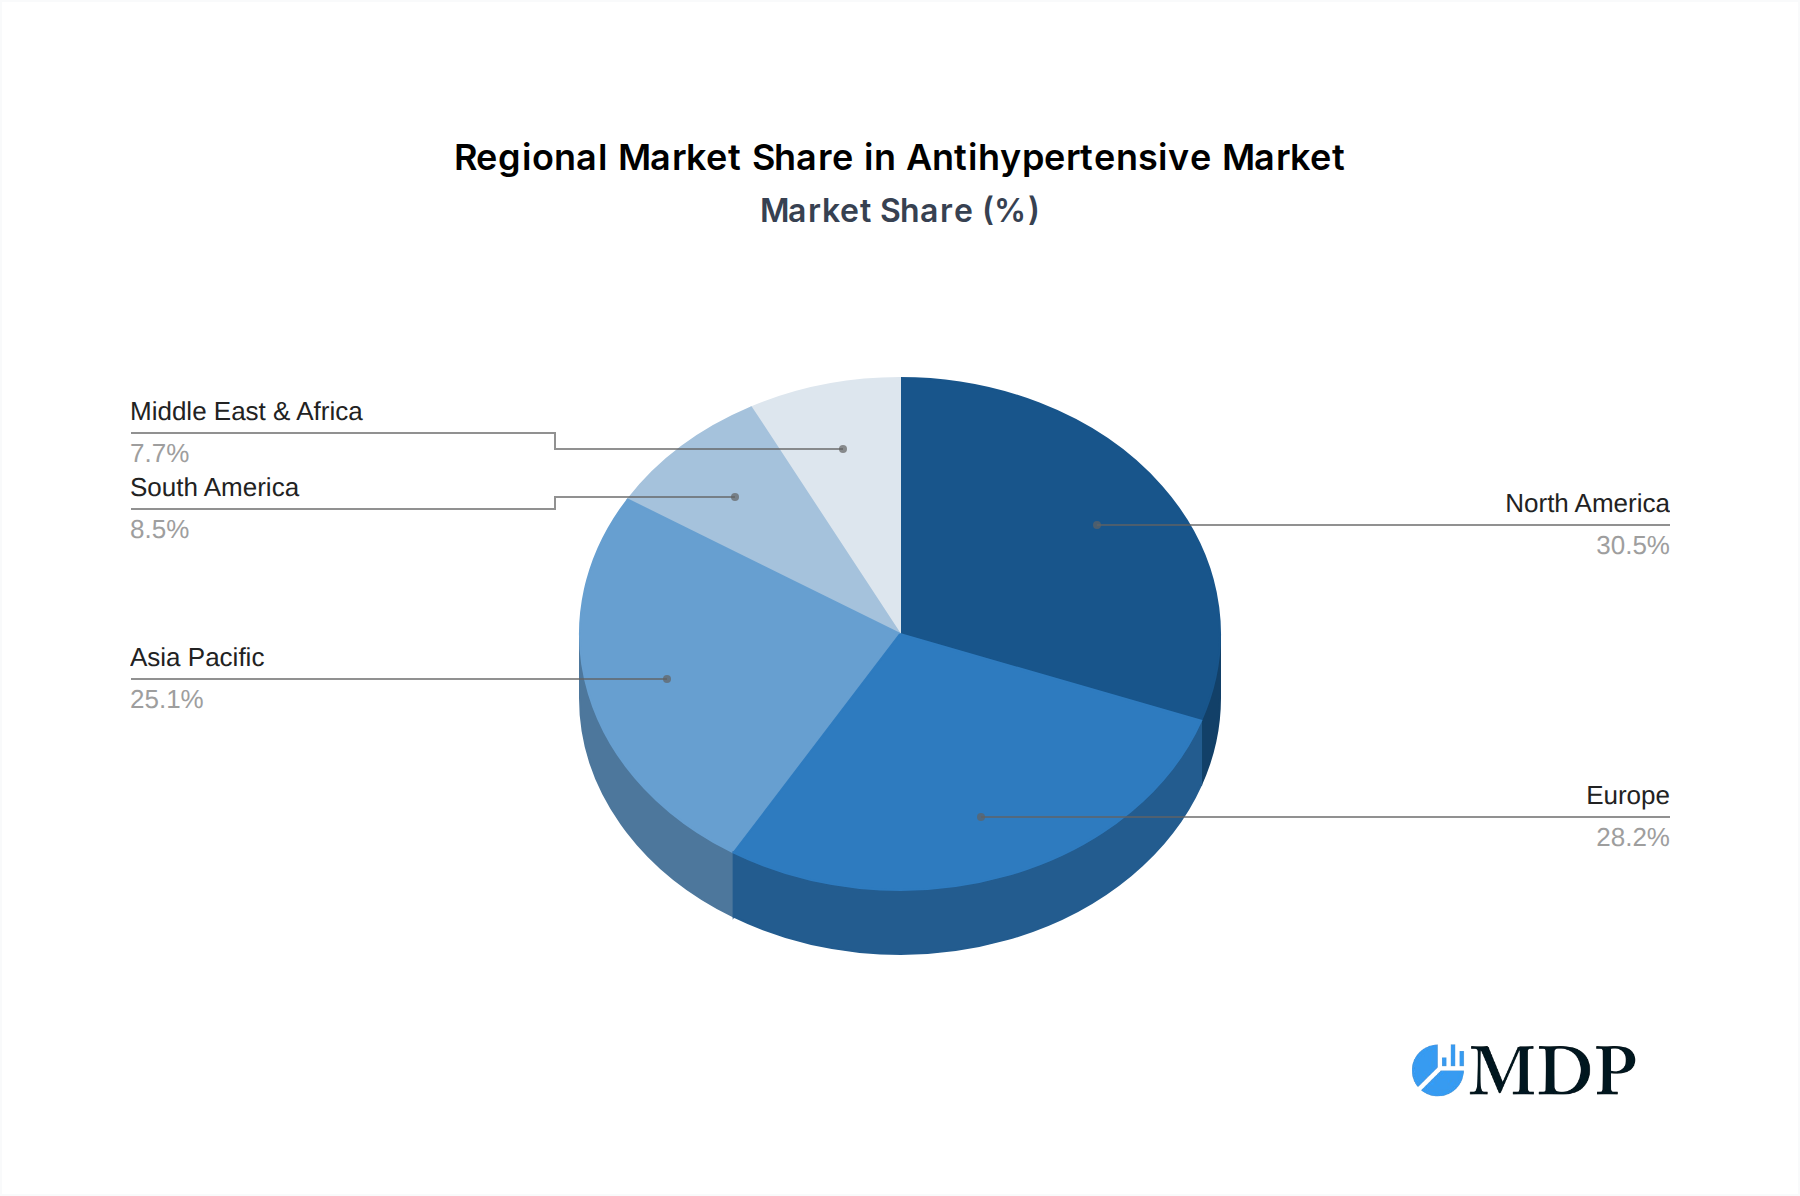
The global antihypertensive market exhibits significant regional and segment-specific dominance. North America and Europe currently lead in market share, driven by advanced healthcare infrastructure, high disease awareness, and strong purchasing power. However, the Asia Pacific region is emerging as a high-growth market due to the increasing prevalence of hypertension, a burgeoning middle class, and expanding healthcare access, with market growth estimated in the billions. Within the application segment, Hospital Pharmacy remains the dominant channel, accounting for a significant portion of market revenue, estimated in the billions. This is attributed to the critical nature of hypertension management in acute care settings and the availability of a wider range of intravenous and complex treatment options. Retail Pharmacy follows as a crucial segment, catering to the ongoing management of chronic hypertension, with sales figures also in the billions. The Online Pharmacy segment, though smaller, is experiencing rapid growth, driven by convenience and accessibility, with projected revenues in the hundreds of millions.
In terms of drug types, Angiotensin Receptor Blockers (ARBs) and Calcium Channel Blockers currently hold substantial market shares, estimated in the billions, due to their proven efficacy, safety profiles, and wide range of applications. Diuretics also represent a significant segment, often used as first-line therapy or in combination treatments, contributing billions to market revenue. Angiotensin Converting Enzyme (ACE) Inhibitors continue to be a cornerstone of hypertension management, with a consistent market presence. Beta Blockers remain vital, particularly for patients with comorbid cardiovascular conditions. While Alpha Blockers, Vasodilators, and Renin Inhibitors hold smaller but important market shares, their niche applications and ongoing research efforts contribute to the overall market value, with combined revenues in the hundreds of millions.
- Dominant Regions: North America and Europe lead; Asia Pacific shows rapid growth potential.
- Leading Application Segments:
- Hospital Pharmacy: Highest market share due to acute care and complex treatments.
- Retail Pharmacy: Significant for chronic condition management.
- Online Pharmacy: Rapidly growing due to convenience and accessibility.
- Leading Drug Types:
- Angiotensin Receptor Blockers (ARBs): Proven efficacy and favorable safety profiles.
- Calcium Channel Blockers: Versatile applications and well-established treatments.
- Diuretics: First-line therapy and combination treatment staple.
- Angiotensin Converting Enzyme (ACE) Inhibitors: Foundational treatment options.
- Beta Blockers: Essential for co-morbid cardiovascular conditions.
Antihypertensive Product Developments
Product developments in the antihypertensive sector are focused on enhancing efficacy, improving patient adherence, and reducing adverse effects. Innovations include novel drug formulations like extended-release tablets and combination pills, offering simplified dosing regimens and improved therapeutic outcomes. Research into new molecular targets and personalized medicine approaches aims to develop treatments tailored to individual patient genetics and disease profiles, potentially leading to significant competitive advantages. The integration of digital health technologies, such as smart inhalers and adherence monitoring apps, further enhances product value by empowering patients and healthcare providers with real-time data and insights, contributing to improved treatment success. The competitive landscape is being reshaped by these advancements, with companies vying to introduce first-in-class therapies and leverage technological integration to capture market share.
Key Drivers of Antihypertensive Growth
The antihypertensive market's growth is propelled by several interconnected factors. A primary driver is the persistently high and increasing global prevalence of hypertension, a chronic condition affecting billions and exacerbated by lifestyle changes and an aging demographic. This demographic shift creates a sustained demand for effective treatment solutions. Technological advancements, particularly in drug discovery and formulation, are leading to more effective and patient-friendly medications, stimulating market expansion. Regulatory bodies, while maintaining strict oversight, are also facilitating approvals for innovative treatments that address unmet medical needs. Furthermore, increased healthcare expenditure in emerging economies, coupled with growing public health awareness campaigns, is expanding access to diagnosis and treatment, thereby widening the market reach.
- Rising Global Hypertension Prevalence: Driven by lifestyle factors and an aging population.
- Technological Advancements: Innovations in drug discovery, formulation, and precision medicine.
- Favorable Regulatory Environment: Streamlined approvals for novel and effective therapies.
- Increased Healthcare Spending: Particularly in emerging markets, enhancing accessibility to treatments.
- Public Health Awareness: Campaigns promoting early detection and management of hypertension.
Challenges in the Antihypertensive Market
Despite its robust growth, the antihypertensive market faces several challenges. The stringent regulatory approval process for new drugs can be lengthy and expensive, posing a significant barrier to market entry for smaller companies, with R&D costs often in the billions. Intense competition from generic drug manufacturers drives down prices, impacting profit margins for branded medications. Supply chain complexities, particularly for specialty APIs and finished products, can lead to disruptions and affect product availability. Furthermore, patient adherence to long-term medication regimens remains a persistent challenge, requiring ongoing efforts in patient education and support.
- Stringent Regulatory Hurdles: Lengthy and costly approval processes.
- Intense Generic Competition: Price erosion and pressure on branded drug margins.
- Supply Chain Disruptions: Potential for API shortages and distribution issues.
- Patient Adherence Issues: Difficulty in maintaining long-term medication compliance.
Emerging Opportunities in Antihypertensive
Emerging opportunities in the antihypertensive market are centered on unmet medical needs and technological integration. The development of novel drug targets that address specific patient subgroups or resistant hypertension presents significant potential for innovation. Personalized medicine approaches, leveraging genetic profiling and advanced diagnostics, offer the chance to tailor treatments for maximum efficacy and minimal side effects, creating differentiated product offerings. Strategic partnerships between pharmaceutical companies and digital health providers are creating new avenues for patient monitoring and adherence solutions, enhancing the overall treatment experience. Furthermore, expanding access to hypertension management in underserved regions and the development of more affordable treatment options are key areas for future growth.
Leading Players in the Antihypertensive Sector
- Pfizer
- Norvatis
- Merck & Co.
- Sanofi
- AstraZeneca
- GSK
- Daiichi-Sankyo
- Boehringer-Ingelheim
- Bayer
- Johnson & Johnson
- Bristol-Myers Squibb
- Takeda
- Ranbaxy Laboratories
- Shihuida Pharm
- Second Pharmaceutical
- Lupin Limited.
- Yangtze River Pharmaceutical
- Hengrui Medicine
- Qilu Pharmaceutical
- HUALON
- Dawnrays
- HISUN Pharmaceutical
Key Milestones in Antihypertensive Industry
- 2019: Launch of novel fixed-dose combination therapies, improving patient adherence and simplifying treatment regimens.
- 2020: Significant increase in research funding for rennin-angiotensin system inhibitors and novel diuretic combinations.
- 2021: Introduction of AI-powered diagnostic tools for early hypertension detection, impacting diagnostic market.
- 2022: Major pharmaceutical company acquires a specialized biotech firm focusing on gene therapy for cardiovascular diseases, signaling a shift towards advanced treatments.
- 2023: Expansion of telemedicine platforms for remote blood pressure monitoring and patient consultations, driving online pharmacy growth.
- 2024: Several clinical trials show promising results for new drug candidates targeting resistant hypertension, with estimated market potential in the billions.
- 2025: Expected acceleration in the adoption of digital health solutions for chronic disease management, including hypertension.
- 2026: Projected market entry of several innovative therapies with distinct mechanisms of action, further diversifying treatment options.
- 2027-2033: Continued growth driven by an aging population, increasing awareness, and advancements in personalized medicine, with market expansion into emerging economies.
Strategic Outlook for Antihypertensive Market
The strategic outlook for the antihypertensive market is overwhelmingly positive, driven by an increasing global burden of cardiovascular diseases and continuous innovation. Growth accelerators include the continued rise in hypertension prevalence, advancements in precision medicine allowing for tailored therapies, and the expanding integration of digital health solutions to enhance patient engagement and adherence. Companies that focus on developing novel drug mechanisms, robust combination therapies, and patient-centric digital tools are best positioned to capture significant market share. Strategic acquisitions and partnerships will remain crucial for expanding portfolios and gaining access to cutting-edge technologies. Furthermore, tapping into the high-growth potential of emerging markets by offering accessible and effective treatments will be a key determinant of long-term success, ensuring sustained growth in the multi-billion dollar market.
Antihypertensive Segmentation
-
1. Application
- 1.1. Hospital Pharmacy
- 1.2. Retail Pharmacy
- 1.3. Online Pharmacy
- 1.4. Others
-
2. Types
- 2.1. Diuretics
- 2.2. Angiotensin Converting Enzyme (ACE) Inhibitors
- 2.3. Angiotensin Receptor Blockers (ARBs)
- 2.4. Calcium Channel Blockers
- 2.5. Beta Blockers
- 2.6. Alpha Blockers
- 2.7. Vasodilators & Renin Inhibitors
Antihypertensive Segmentation By Geography
-
1. North America
- 1.1. United States
- 1.2. Canada
- 1.3. Mexico
-
2. South America
- 2.1. Brazil
- 2.2. Argentina
- 2.3. Rest of South America
-
3. Europe
- 3.1. United Kingdom
- 3.2. Germany
- 3.3. France
- 3.4. Italy
- 3.5. Spain
- 3.6. Russia
- 3.7. Benelux
- 3.8. Nordics
- 3.9. Rest of Europe
-
4. Middle East & Africa
- 4.1. Turkey
- 4.2. Israel
- 4.3. GCC
- 4.4. North Africa
- 4.5. South Africa
- 4.6. Rest of Middle East & Africa
-
5. Asia Pacific
- 5.1. China
- 5.2. India
- 5.3. Japan
- 5.4. South Korea
- 5.5. ASEAN
- 5.6. Oceania
- 5.7. Rest of Asia Pacific
Antihypertensive Regional Market Share
Geographic Coverage of Antihypertensive
Antihypertensive REPORT HIGHLIGHTS
| Aspects | Details |
|---|---|
| Study Period | 2020-2034 |
| Base Year | 2025 |
| Estimated Year | 2026 |
| Forecast Period | 2026-2034 |
| Historical Period | 2020-2025 |
| Growth Rate | CAGR of 3.96% from 2020-2034 |
| Segmentation |
|
Table of Contents
- 1. Introduction
- 1.1. Research Scope
- 1.2. Market Segmentation
- 1.3. Research Methodology
- 1.4. Definitions and Assumptions
- 2. Executive Summary
- 2.1. Introduction
- 3. Market Dynamics
- 3.1. Introduction
- 3.2. Market Drivers
- 3.3. Market Restrains
- 3.4. Market Trends
- 4. Market Factor Analysis
- 4.1. Porters Five Forces
- 4.2. Supply/Value Chain
- 4.3. PESTEL analysis
- 4.4. Market Entropy
- 4.5. Patent/Trademark Analysis
- 5. Global Antihypertensive Analysis, Insights and Forecast, 2020-2032
- 5.1. Market Analysis, Insights and Forecast - by Application
- 5.1.1. Hospital Pharmacy
- 5.1.2. Retail Pharmacy
- 5.1.3. Online Pharmacy
- 5.1.4. Others
- 5.2. Market Analysis, Insights and Forecast - by Types
- 5.2.1. Diuretics
- 5.2.2. Angiotensin Converting Enzyme (ACE) Inhibitors
- 5.2.3. Angiotensin Receptor Blockers (ARBs)
- 5.2.4. Calcium Channel Blockers
- 5.2.5. Beta Blockers
- 5.2.6. Alpha Blockers
- 5.2.7. Vasodilators & Renin Inhibitors
- 5.3. Market Analysis, Insights and Forecast - by Region
- 5.3.1. North America
- 5.3.2. South America
- 5.3.3. Europe
- 5.3.4. Middle East & Africa
- 5.3.5. Asia Pacific
- 5.1. Market Analysis, Insights and Forecast - by Application
- 6. North America Antihypertensive Analysis, Insights and Forecast, 2020-2032
- 6.1. Market Analysis, Insights and Forecast - by Application
- 6.1.1. Hospital Pharmacy
- 6.1.2. Retail Pharmacy
- 6.1.3. Online Pharmacy
- 6.1.4. Others
- 6.2. Market Analysis, Insights and Forecast - by Types
- 6.2.1. Diuretics
- 6.2.2. Angiotensin Converting Enzyme (ACE) Inhibitors
- 6.2.3. Angiotensin Receptor Blockers (ARBs)
- 6.2.4. Calcium Channel Blockers
- 6.2.5. Beta Blockers
- 6.2.6. Alpha Blockers
- 6.2.7. Vasodilators & Renin Inhibitors
- 6.1. Market Analysis, Insights and Forecast - by Application
- 7. South America Antihypertensive Analysis, Insights and Forecast, 2020-2032
- 7.1. Market Analysis, Insights and Forecast - by Application
- 7.1.1. Hospital Pharmacy
- 7.1.2. Retail Pharmacy
- 7.1.3. Online Pharmacy
- 7.1.4. Others
- 7.2. Market Analysis, Insights and Forecast - by Types
- 7.2.1. Diuretics
- 7.2.2. Angiotensin Converting Enzyme (ACE) Inhibitors
- 7.2.3. Angiotensin Receptor Blockers (ARBs)
- 7.2.4. Calcium Channel Blockers
- 7.2.5. Beta Blockers
- 7.2.6. Alpha Blockers
- 7.2.7. Vasodilators & Renin Inhibitors
- 7.1. Market Analysis, Insights and Forecast - by Application
- 8. Europe Antihypertensive Analysis, Insights and Forecast, 2020-2032
- 8.1. Market Analysis, Insights and Forecast - by Application
- 8.1.1. Hospital Pharmacy
- 8.1.2. Retail Pharmacy
- 8.1.3. Online Pharmacy
- 8.1.4. Others
- 8.2. Market Analysis, Insights and Forecast - by Types
- 8.2.1. Diuretics
- 8.2.2. Angiotensin Converting Enzyme (ACE) Inhibitors
- 8.2.3. Angiotensin Receptor Blockers (ARBs)
- 8.2.4. Calcium Channel Blockers
- 8.2.5. Beta Blockers
- 8.2.6. Alpha Blockers
- 8.2.7. Vasodilators & Renin Inhibitors
- 8.1. Market Analysis, Insights and Forecast - by Application
- 9. Middle East & Africa Antihypertensive Analysis, Insights and Forecast, 2020-2032
- 9.1. Market Analysis, Insights and Forecast - by Application
- 9.1.1. Hospital Pharmacy
- 9.1.2. Retail Pharmacy
- 9.1.3. Online Pharmacy
- 9.1.4. Others
- 9.2. Market Analysis, Insights and Forecast - by Types
- 9.2.1. Diuretics
- 9.2.2. Angiotensin Converting Enzyme (ACE) Inhibitors
- 9.2.3. Angiotensin Receptor Blockers (ARBs)
- 9.2.4. Calcium Channel Blockers
- 9.2.5. Beta Blockers
- 9.2.6. Alpha Blockers
- 9.2.7. Vasodilators & Renin Inhibitors
- 9.1. Market Analysis, Insights and Forecast - by Application
- 10. Asia Pacific Antihypertensive Analysis, Insights and Forecast, 2020-2032
- 10.1. Market Analysis, Insights and Forecast - by Application
- 10.1.1. Hospital Pharmacy
- 10.1.2. Retail Pharmacy
- 10.1.3. Online Pharmacy
- 10.1.4. Others
- 10.2. Market Analysis, Insights and Forecast - by Types
- 10.2.1. Diuretics
- 10.2.2. Angiotensin Converting Enzyme (ACE) Inhibitors
- 10.2.3. Angiotensin Receptor Blockers (ARBs)
- 10.2.4. Calcium Channel Blockers
- 10.2.5. Beta Blockers
- 10.2.6. Alpha Blockers
- 10.2.7. Vasodilators & Renin Inhibitors
- 10.1. Market Analysis, Insights and Forecast - by Application
- 11. Competitive Analysis
- 11.1. Global Market Share Analysis 2025
- 11.2. Company Profiles
- 11.2.1 Pfizer
- 11.2.1.1. Overview
- 11.2.1.2. Products
- 11.2.1.3. SWOT Analysis
- 11.2.1.4. Recent Developments
- 11.2.1.5. Financials (Based on Availability)
- 11.2.2 Norvatis
- 11.2.2.1. Overview
- 11.2.2.2. Products
- 11.2.2.3. SWOT Analysis
- 11.2.2.4. Recent Developments
- 11.2.2.5. Financials (Based on Availability)
- 11.2.3 Merck & Co.
- 11.2.3.1. Overview
- 11.2.3.2. Products
- 11.2.3.3. SWOT Analysis
- 11.2.3.4. Recent Developments
- 11.2.3.5. Financials (Based on Availability)
- 11.2.4 Sanofi
- 11.2.4.1. Overview
- 11.2.4.2. Products
- 11.2.4.3. SWOT Analysis
- 11.2.4.4. Recent Developments
- 11.2.4.5. Financials (Based on Availability)
- 11.2.5 AstraZeneca
- 11.2.5.1. Overview
- 11.2.5.2. Products
- 11.2.5.3. SWOT Analysis
- 11.2.5.4. Recent Developments
- 11.2.5.5. Financials (Based on Availability)
- 11.2.6 GSK
- 11.2.6.1. Overview
- 11.2.6.2. Products
- 11.2.6.3. SWOT Analysis
- 11.2.6.4. Recent Developments
- 11.2.6.5. Financials (Based on Availability)
- 11.2.7 Daiichi-Sankyo
- 11.2.7.1. Overview
- 11.2.7.2. Products
- 11.2.7.3. SWOT Analysis
- 11.2.7.4. Recent Developments
- 11.2.7.5. Financials (Based on Availability)
- 11.2.8 Boehringer-Ingelheim
- 11.2.8.1. Overview
- 11.2.8.2. Products
- 11.2.8.3. SWOT Analysis
- 11.2.8.4. Recent Developments
- 11.2.8.5. Financials (Based on Availability)
- 11.2.9 Bayer
- 11.2.9.1. Overview
- 11.2.9.2. Products
- 11.2.9.3. SWOT Analysis
- 11.2.9.4. Recent Developments
- 11.2.9.5. Financials (Based on Availability)
- 11.2.10 Johnson & Johnson
- 11.2.10.1. Overview
- 11.2.10.2. Products
- 11.2.10.3. SWOT Analysis
- 11.2.10.4. Recent Developments
- 11.2.10.5. Financials (Based on Availability)
- 11.2.11 Bristol-Myers Squibb
- 11.2.11.1. Overview
- 11.2.11.2. Products
- 11.2.11.3. SWOT Analysis
- 11.2.11.4. Recent Developments
- 11.2.11.5. Financials (Based on Availability)
- 11.2.12 Tekeda
- 11.2.12.1. Overview
- 11.2.12.2. Products
- 11.2.12.3. SWOT Analysis
- 11.2.12.4. Recent Developments
- 11.2.12.5. Financials (Based on Availability)
- 11.2.13 Ranbaxy Laboratories
- 11.2.13.1. Overview
- 11.2.13.2. Products
- 11.2.13.3. SWOT Analysis
- 11.2.13.4. Recent Developments
- 11.2.13.5. Financials (Based on Availability)
- 11.2.14 Shihuida Pharm
- 11.2.14.1. Overview
- 11.2.14.2. Products
- 11.2.14.3. SWOT Analysis
- 11.2.14.4. Recent Developments
- 11.2.14.5. Financials (Based on Availability)
- 11.2.15 Second Pharmaceutical
- 11.2.15.1. Overview
- 11.2.15.2. Products
- 11.2.15.3. SWOT Analysis
- 11.2.15.4. Recent Developments
- 11.2.15.5. Financials (Based on Availability)
- 11.2.16 Lupin Limited.
- 11.2.16.1. Overview
- 11.2.16.2. Products
- 11.2.16.3. SWOT Analysis
- 11.2.16.4. Recent Developments
- 11.2.16.5. Financials (Based on Availability)
- 11.2.17 Yangtze River Pharmaceutical
- 11.2.17.1. Overview
- 11.2.17.2. Products
- 11.2.17.3. SWOT Analysis
- 11.2.17.4. Recent Developments
- 11.2.17.5. Financials (Based on Availability)
- 11.2.18 Hengrui Medicine
- 11.2.18.1. Overview
- 11.2.18.2. Products
- 11.2.18.3. SWOT Analysis
- 11.2.18.4. Recent Developments
- 11.2.18.5. Financials (Based on Availability)
- 11.2.19 Qilu Pharmaceutical
- 11.2.19.1. Overview
- 11.2.19.2. Products
- 11.2.19.3. SWOT Analysis
- 11.2.19.4. Recent Developments
- 11.2.19.5. Financials (Based on Availability)
- 11.2.20 HUALON
- 11.2.20.1. Overview
- 11.2.20.2. Products
- 11.2.20.3. SWOT Analysis
- 11.2.20.4. Recent Developments
- 11.2.20.5. Financials (Based on Availability)
- 11.2.21 Dawnrays
- 11.2.21.1. Overview
- 11.2.21.2. Products
- 11.2.21.3. SWOT Analysis
- 11.2.21.4. Recent Developments
- 11.2.21.5. Financials (Based on Availability)
- 11.2.22 HISUN Pharmceutical
- 11.2.22.1. Overview
- 11.2.22.2. Products
- 11.2.22.3. SWOT Analysis
- 11.2.22.4. Recent Developments
- 11.2.22.5. Financials (Based on Availability)
- 11.2.1 Pfizer
List of Figures
- Figure 1: Global Antihypertensive Revenue Breakdown (billion, %) by Region 2025 & 2033
- Figure 2: North America Antihypertensive Revenue (billion), by Application 2025 & 2033
- Figure 3: North America Antihypertensive Revenue Share (%), by Application 2025 & 2033
- Figure 4: North America Antihypertensive Revenue (billion), by Types 2025 & 2033
- Figure 5: North America Antihypertensive Revenue Share (%), by Types 2025 & 2033
- Figure 6: North America Antihypertensive Revenue (billion), by Country 2025 & 2033
- Figure 7: North America Antihypertensive Revenue Share (%), by Country 2025 & 2033
- Figure 8: South America Antihypertensive Revenue (billion), by Application 2025 & 2033
- Figure 9: South America Antihypertensive Revenue Share (%), by Application 2025 & 2033
- Figure 10: South America Antihypertensive Revenue (billion), by Types 2025 & 2033
- Figure 11: South America Antihypertensive Revenue Share (%), by Types 2025 & 2033
- Figure 12: South America Antihypertensive Revenue (billion), by Country 2025 & 2033
- Figure 13: South America Antihypertensive Revenue Share (%), by Country 2025 & 2033
- Figure 14: Europe Antihypertensive Revenue (billion), by Application 2025 & 2033
- Figure 15: Europe Antihypertensive Revenue Share (%), by Application 2025 & 2033
- Figure 16: Europe Antihypertensive Revenue (billion), by Types 2025 & 2033
- Figure 17: Europe Antihypertensive Revenue Share (%), by Types 2025 & 2033
- Figure 18: Europe Antihypertensive Revenue (billion), by Country 2025 & 2033
- Figure 19: Europe Antihypertensive Revenue Share (%), by Country 2025 & 2033
- Figure 20: Middle East & Africa Antihypertensive Revenue (billion), by Application 2025 & 2033
- Figure 21: Middle East & Africa Antihypertensive Revenue Share (%), by Application 2025 & 2033
- Figure 22: Middle East & Africa Antihypertensive Revenue (billion), by Types 2025 & 2033
- Figure 23: Middle East & Africa Antihypertensive Revenue Share (%), by Types 2025 & 2033
- Figure 24: Middle East & Africa Antihypertensive Revenue (billion), by Country 2025 & 2033
- Figure 25: Middle East & Africa Antihypertensive Revenue Share (%), by Country 2025 & 2033
- Figure 26: Asia Pacific Antihypertensive Revenue (billion), by Application 2025 & 2033
- Figure 27: Asia Pacific Antihypertensive Revenue Share (%), by Application 2025 & 2033
- Figure 28: Asia Pacific Antihypertensive Revenue (billion), by Types 2025 & 2033
- Figure 29: Asia Pacific Antihypertensive Revenue Share (%), by Types 2025 & 2033
- Figure 30: Asia Pacific Antihypertensive Revenue (billion), by Country 2025 & 2033
- Figure 31: Asia Pacific Antihypertensive Revenue Share (%), by Country 2025 & 2033
List of Tables
- Table 1: Global Antihypertensive Revenue billion Forecast, by Application 2020 & 2033
- Table 2: Global Antihypertensive Revenue billion Forecast, by Types 2020 & 2033
- Table 3: Global Antihypertensive Revenue billion Forecast, by Region 2020 & 2033
- Table 4: Global Antihypertensive Revenue billion Forecast, by Application 2020 & 2033
- Table 5: Global Antihypertensive Revenue billion Forecast, by Types 2020 & 2033
- Table 6: Global Antihypertensive Revenue billion Forecast, by Country 2020 & 2033
- Table 7: United States Antihypertensive Revenue (billion) Forecast, by Application 2020 & 2033
- Table 8: Canada Antihypertensive Revenue (billion) Forecast, by Application 2020 & 2033
- Table 9: Mexico Antihypertensive Revenue (billion) Forecast, by Application 2020 & 2033
- Table 10: Global Antihypertensive Revenue billion Forecast, by Application 2020 & 2033
- Table 11: Global Antihypertensive Revenue billion Forecast, by Types 2020 & 2033
- Table 12: Global Antihypertensive Revenue billion Forecast, by Country 2020 & 2033
- Table 13: Brazil Antihypertensive Revenue (billion) Forecast, by Application 2020 & 2033
- Table 14: Argentina Antihypertensive Revenue (billion) Forecast, by Application 2020 & 2033
- Table 15: Rest of South America Antihypertensive Revenue (billion) Forecast, by Application 2020 & 2033
- Table 16: Global Antihypertensive Revenue billion Forecast, by Application 2020 & 2033
- Table 17: Global Antihypertensive Revenue billion Forecast, by Types 2020 & 2033
- Table 18: Global Antihypertensive Revenue billion Forecast, by Country 2020 & 2033
- Table 19: United Kingdom Antihypertensive Revenue (billion) Forecast, by Application 2020 & 2033
- Table 20: Germany Antihypertensive Revenue (billion) Forecast, by Application 2020 & 2033
- Table 21: France Antihypertensive Revenue (billion) Forecast, by Application 2020 & 2033
- Table 22: Italy Antihypertensive Revenue (billion) Forecast, by Application 2020 & 2033
- Table 23: Spain Antihypertensive Revenue (billion) Forecast, by Application 2020 & 2033
- Table 24: Russia Antihypertensive Revenue (billion) Forecast, by Application 2020 & 2033
- Table 25: Benelux Antihypertensive Revenue (billion) Forecast, by Application 2020 & 2033
- Table 26: Nordics Antihypertensive Revenue (billion) Forecast, by Application 2020 & 2033
- Table 27: Rest of Europe Antihypertensive Revenue (billion) Forecast, by Application 2020 & 2033
- Table 28: Global Antihypertensive Revenue billion Forecast, by Application 2020 & 2033
- Table 29: Global Antihypertensive Revenue billion Forecast, by Types 2020 & 2033
- Table 30: Global Antihypertensive Revenue billion Forecast, by Country 2020 & 2033
- Table 31: Turkey Antihypertensive Revenue (billion) Forecast, by Application 2020 & 2033
- Table 32: Israel Antihypertensive Revenue (billion) Forecast, by Application 2020 & 2033
- Table 33: GCC Antihypertensive Revenue (billion) Forecast, by Application 2020 & 2033
- Table 34: North Africa Antihypertensive Revenue (billion) Forecast, by Application 2020 & 2033
- Table 35: South Africa Antihypertensive Revenue (billion) Forecast, by Application 2020 & 2033
- Table 36: Rest of Middle East & Africa Antihypertensive Revenue (billion) Forecast, by Application 2020 & 2033
- Table 37: Global Antihypertensive Revenue billion Forecast, by Application 2020 & 2033
- Table 38: Global Antihypertensive Revenue billion Forecast, by Types 2020 & 2033
- Table 39: Global Antihypertensive Revenue billion Forecast, by Country 2020 & 2033
- Table 40: China Antihypertensive Revenue (billion) Forecast, by Application 2020 & 2033
- Table 41: India Antihypertensive Revenue (billion) Forecast, by Application 2020 & 2033
- Table 42: Japan Antihypertensive Revenue (billion) Forecast, by Application 2020 & 2033
- Table 43: South Korea Antihypertensive Revenue (billion) Forecast, by Application 2020 & 2033
- Table 44: ASEAN Antihypertensive Revenue (billion) Forecast, by Application 2020 & 2033
- Table 45: Oceania Antihypertensive Revenue (billion) Forecast, by Application 2020 & 2033
- Table 46: Rest of Asia Pacific Antihypertensive Revenue (billion) Forecast, by Application 2020 & 2033
Frequently Asked Questions
1. What is the projected Compound Annual Growth Rate (CAGR) of the Antihypertensive?
The projected CAGR is approximately 3.96%.
2. Which companies are prominent players in the Antihypertensive?
Key companies in the market include Pfizer, Norvatis, Merck & Co., Sanofi, AstraZeneca, GSK, Daiichi-Sankyo, Boehringer-Ingelheim, Bayer, Johnson & Johnson, Bristol-Myers Squibb, Tekeda, Ranbaxy Laboratories, Shihuida Pharm, Second Pharmaceutical, Lupin Limited., Yangtze River Pharmaceutical, Hengrui Medicine, Qilu Pharmaceutical, HUALON, Dawnrays, HISUN Pharmceutical.
3. What are the main segments of the Antihypertensive?
The market segments include Application, Types.
4. Can you provide details about the market size?
The market size is estimated to be USD 25.88 billion as of 2022.
5. What are some drivers contributing to market growth?
N/A
6. What are the notable trends driving market growth?
N/A
7. Are there any restraints impacting market growth?
N/A
8. Can you provide examples of recent developments in the market?
N/A
9. What pricing options are available for accessing the report?
Pricing options include single-user, multi-user, and enterprise licenses priced at USD 5600.00, USD 8400.00, and USD 11200.00 respectively.
10. Is the market size provided in terms of value or volume?
The market size is provided in terms of value, measured in billion.
11. Are there any specific market keywords associated with the report?
Yes, the market keyword associated with the report is "Antihypertensive," which aids in identifying and referencing the specific market segment covered.
12. How do I determine which pricing option suits my needs best?
The pricing options vary based on user requirements and access needs. Individual users may opt for single-user licenses, while businesses requiring broader access may choose multi-user or enterprise licenses for cost-effective access to the report.
13. Are there any additional resources or data provided in the Antihypertensive report?
While the report offers comprehensive insights, it's advisable to review the specific contents or supplementary materials provided to ascertain if additional resources or data are available.
14. How can I stay updated on further developments or reports in the Antihypertensive?
To stay informed about further developments, trends, and reports in the Antihypertensive, consider subscribing to industry newsletters, following relevant companies and organizations, or regularly checking reputable industry news sources and publications.
Methodology
Step 1 - Identification of Relevant Samples Size from Population Database


Step 2 - Approaches for Defining Global Market Size (Value, Volume* & Price*)

Note*: In applicable scenarios
Step 3 - Data Sources
Primary Research
- Web Analytics
- Survey Reports
- Research Institute
- Latest Research Reports
- Opinion Leaders
Secondary Research
- Annual Reports
- White Paper
- Latest Press Release
- Industry Association
- Paid Database
- Investor Presentations

Step 4 - Data Triangulation
Involves using different sources of information in order to increase the validity of a study
These sources are likely to be stakeholders in a program - participants, other researchers, program staff, other community members, and so on.
Then we put all data in single framework & apply various statistical tools to find out the dynamic on the market.
During the analysis stage, feedback from the stakeholder groups would be compared to determine areas of agreement as well as areas of divergence