

Key Insights
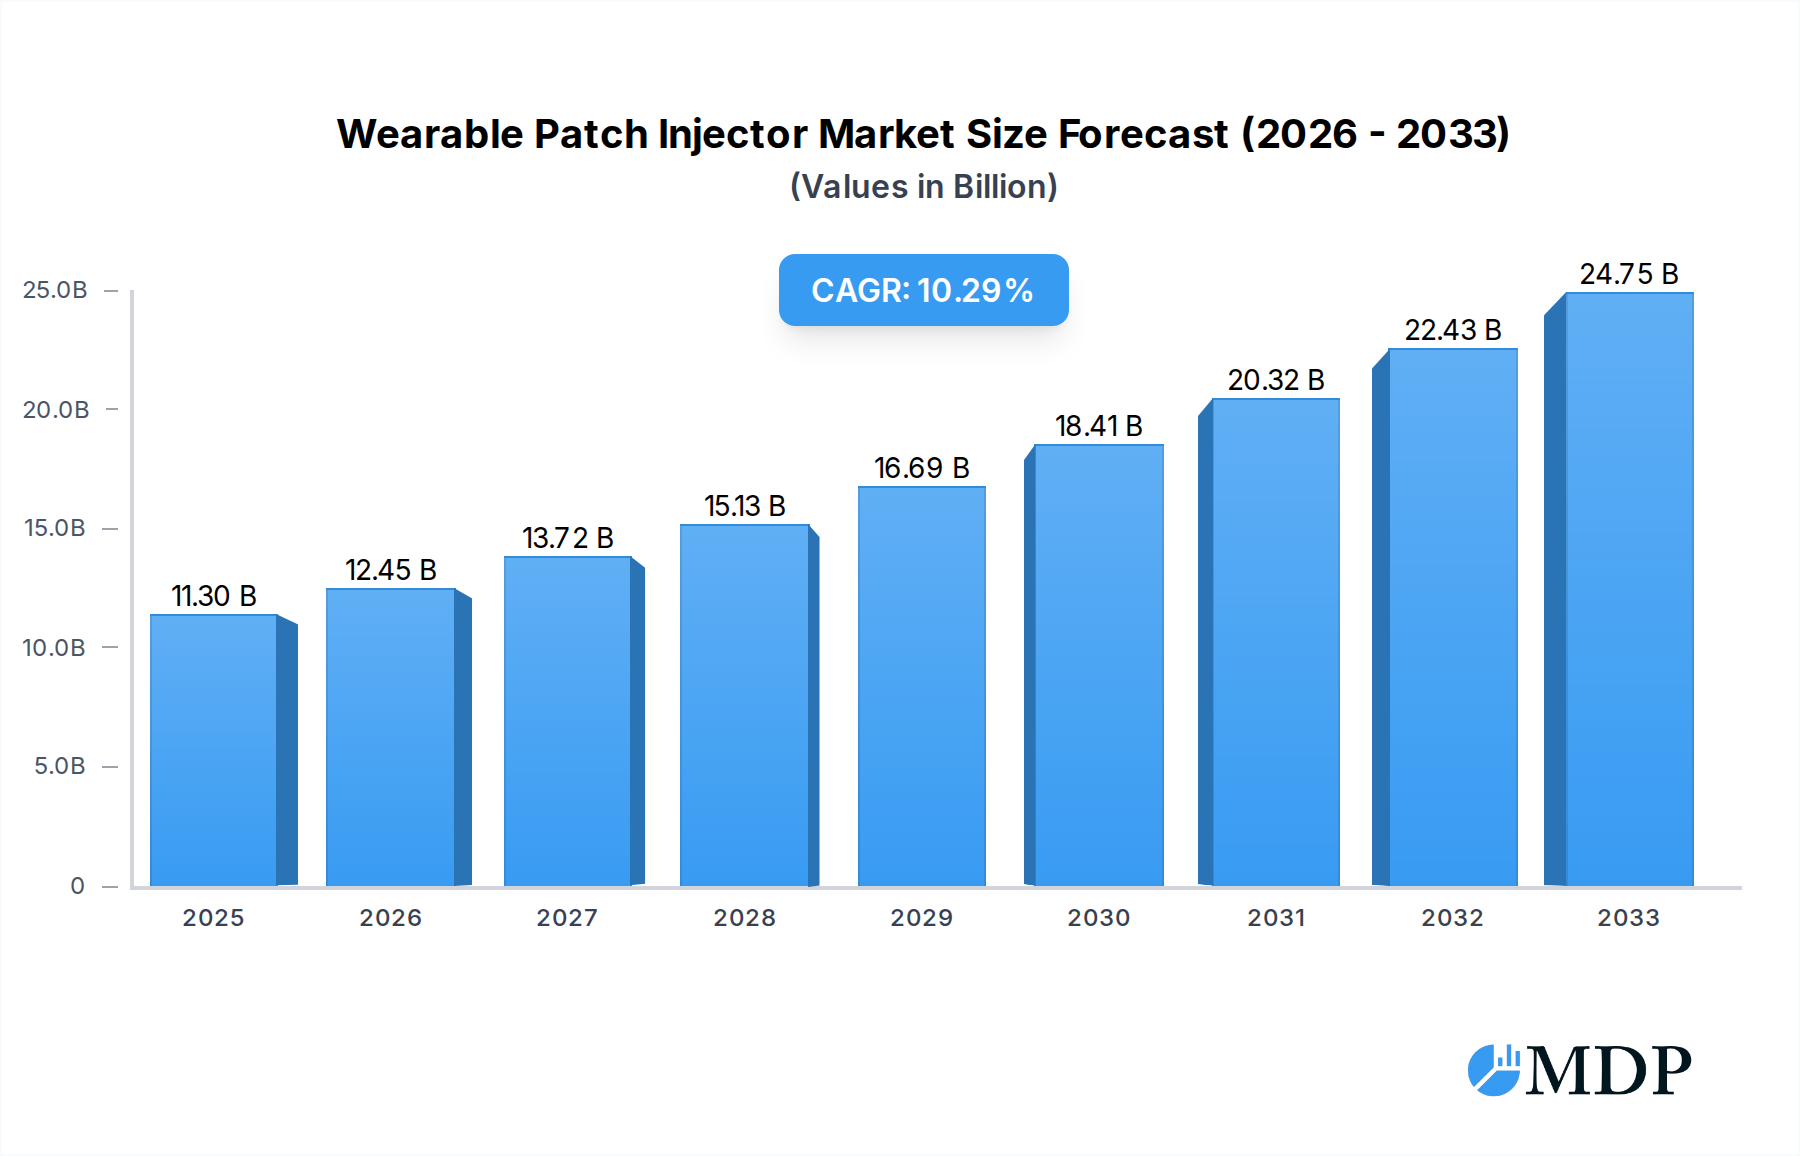
The global Wearable Patch Injector market is poised for significant expansion, projected to reach $11.3 billion in 2025. This robust growth is propelled by a compelling compound annual growth rate (CAGR) of 10.8%, indicating a sustained upward trajectory throughout the forecast period of 2025-2033. A primary driver of this market dynamism is the increasing prevalence of chronic diseases such as diabetes, rheumatoid arthritis, and cardiovascular conditions, which necessitate regular and convenient drug delivery. The inherent advantages of wearable patch injectors, including improved patient adherence, reduced pain, enhanced drug stability, and discreet administration, are increasingly recognized by both healthcare providers and patients. This translates into a growing preference for these advanced drug delivery systems over traditional injection methods, particularly for self-administration in home care settings. The expanding pipeline of biologics and complex molecules requiring specialized delivery mechanisms further fuels demand for these sophisticated devices.

Wearable Patch Injector Market Size (In Billion)
The market's segmentation reveals a diverse landscape, with applications spanning hospitals, clinics, and a rapidly growing home care sector. The convenience and autonomy offered by wearable patch injectors are making them a cornerstone of modern chronic disease management, allowing patients to maintain their quality of life while adhering to treatment regimens. From a technological standpoint, both high-dose and small-dose injectors are witnessing advancements, catering to a wide spectrum of therapeutic needs. Key industry players are actively engaged in research and development, focusing on miniaturization, enhanced functionality, and cost-effectiveness. Strategic collaborations and mergers are also shaping the competitive environment, as companies strive to secure a larger market share. While the market demonstrates strong growth potential, challenges such as high manufacturing costs and the need for robust regulatory approvals in certain regions will require strategic navigation by stakeholders. Nevertheless, the overall outlook for the Wearable Patch Injector market remains exceptionally positive, driven by patient-centric innovations and a growing global demand for effective and user-friendly drug delivery solutions.
Wearable Patch Injector Company Market Share
This in-depth report offers a definitive analysis of the global wearable patch injector market, projecting its trajectory from 2019 to 2033, with a base year of 2025. We delve into critical market dynamics, technological advancements, leading players, and emerging opportunities, providing actionable insights for stakeholders in the pharmaceutical, medical device, and healthcare industries. With a focus on high-traffic keywords such as "wearable drug delivery," "automated injectors," "subcutaneous injection devices," and "self-administration," this report is optimized for maximum search visibility and engagement.
Wearable Patch Injector Market Dynamics & Concentration
The wearable patch injector market exhibits a dynamic and moderately concentrated landscape, with innovation acting as a primary driver of growth. Key players are actively investing in R&D to enhance device functionality, patient comfort, and therapeutic efficacy, particularly for chronic disease management. Regulatory frameworks are evolving to facilitate the approval and adoption of novel drug delivery systems, with an increasing emphasis on patient-centric designs and interoperability. Product substitutes, such as traditional syringes and pre-filled pens, continue to pose a competitive challenge, but the convenience and improved adherence offered by wearable injectors are driving end-user preferences towards these advanced solutions. Merger and acquisition (M&A) activities are a significant factor in market consolidation and expansion, with numerous strategic deals observed to strengthen product portfolios and market reach. For instance, the market has witnessed approximately $3 billion in M&A deal values over the historical period, with an estimated 15 major acquisitions. Market share distribution shows a concentration among the top five companies, accounting for roughly 60% of the global market revenue.
Wearable Patch Injector Industry Trends & Analysis
The global wearable patch injector market is poised for substantial growth, driven by several interconnected trends and technological advancements. The increasing prevalence of chronic diseases worldwide, including diabetes, rheumatoid arthritis, and autoimmune disorders, is creating a perpetual demand for convenient and effective drug delivery methods. Wearable patch injectors offer a significant advantage in terms of patient compliance and quality of life, enabling self-administration of medications with minimal discomfort and training. Technological disruptions are at the forefront of this market evolution, with continuous innovation in areas such as miniaturization, smart connectivity, and advanced drug formulation. The development of sophisticated sensors and data logging capabilities allows for real-time monitoring of drug delivery and patient adherence, paving the way for personalized medicine approaches.
Consumer preferences are increasingly shifting towards home-based healthcare solutions, further bolstering the adoption of wearable injectors. Patients are seeking more autonomy in managing their health conditions, and these devices empower them to do so effectively outside of clinical settings. The competitive landscape is intensifying, with established medical device manufacturers and emerging biotech companies vying for market share. Strategic partnerships between pharmaceutical companies and device manufacturers are becoming more common, facilitating the co-development and commercialization of novel drug-device combinations. The market penetration of wearable patch injectors is projected to expand significantly, driven by these factors.
The Compound Annual Growth Rate (CAGR) for the wearable patch injector market is estimated to be robust, projected at approximately 18.5% during the forecast period (2025–2033). This growth is underpinned by a projected market size reaching over $25 billion by 2033, up from an estimated $7 billion in 2025. The increasing acceptance of these devices for both biologic and small molecule drugs, coupled with advancements in therapy areas such as oncology and immunology, will be key growth catalysts.
Leading Markets & Segments in Wearable Patch Injector
The Home Care segment is emerging as the dominant application within the wearable patch injector market, driven by the global shift towards decentralized healthcare and increased patient preference for self-administration. This dominance is further amplified by the growing burden of chronic diseases, which necessitate long-term and frequent medication regimens that are best managed in a home setting. The convenience, discretion, and improved quality of life offered by wearable patch injectors make them ideal for this environment.
- Key Drivers for Home Care Dominance:
- Rising Chronic Disease Prevalence: Conditions like diabetes, rheumatoid arthritis, and inflammatory bowel disease require consistent, long-term treatment, making home-based delivery systems highly desirable.
- Patient Empowerment and Convenience: Wearable injectors offer greater autonomy and freedom from frequent clinic visits, aligning with patient desires for self-management.
- Technological Advancements: Miniaturization, user-friendly interfaces, and smart features enhance the suitability of these devices for home use.
- Reimbursement Policies: Favorable reimbursement structures for home healthcare services and medical devices are encouraging adoption.
- Aging Population: A larger elderly demographic often prefers home-based care and may find wearable injectors easier to use than traditional methods.
In terms of device types, the High Dose Injector segment is experiencing significant growth, particularly for biologics and complex therapeutics that require larger volumes of medication. These injectors are crucial for treating conditions with high unmet needs where traditional delivery methods are insufficient or impractical.
- Key Drivers for High Dose Injector Dominance:
- Growth in Biologics: The pharmaceutical industry's increasing focus on developing and manufacturing biologic drugs necessitates the development of sophisticated delivery systems capable of handling higher volumes.
- Therapeutic Efficacy: For certain chronic and severe conditions, higher doses are often required for optimal therapeutic outcomes, making high-dose injectors indispensable.
- Reduced Injection Frequency: High-dose devices can reduce the frequency of injections, improving patient adherence and convenience for treatments requiring substantial medication.
- Advancements in Drug Formulation: Innovations in drug formulation are enabling higher concentrations, making high-dose wearable injectors a viable solution for a wider range of therapies.
The dominant geographical region for wearable patch injectors is expected to be North America, owing to its advanced healthcare infrastructure, high healthcare spending, strong regulatory support for medical innovations, and a substantial patient population with chronic diseases. The United States, in particular, leads in the adoption of novel medical technologies and boasts a robust pharmaceutical and biotechnology industry actively engaged in the development of wearable drug delivery systems.
Wearable Patch Injector Product Developments
Wearable patch injector technology is witnessing rapid innovation, focusing on enhanced patient experience, expanded therapeutic applications, and seamless integration with digital health platforms. Key developments include miniaturized, discreet designs that improve patient comfort and adherence, particularly for long-term treatment regimens. Smart features, such as integrated sensors for dose tracking and adherence monitoring, are becoming standard, offering valuable data for both patients and healthcare providers. Furthermore, advancements in drug formulation and delivery mechanisms are expanding the range of biologics and complex molecules that can be effectively administered via these devices. The competitive advantage lies in user-friendliness, reliability, and the ability to deliver precise, consistent doses for critical therapies.
Key Drivers of Wearable Patch Injector Growth
Several pivotal factors are propelling the wearable patch injector market forward. The increasing global burden of chronic diseases, such as diabetes and autoimmune disorders, necessitates more convenient and patient-friendly drug delivery solutions. Technological advancements in miniaturization, connected devices, and novel drug formulation are enabling the development of more effective and user-centric injectors. Favorable regulatory landscapes in key markets are streamlining the approval process for these innovative medical devices. Furthermore, a growing patient preference for self-administration and home-based care is a significant market accelerator, empowering individuals to manage their health with greater autonomy.
Challenges in the Wearable Patch Injector Market
Despite the promising growth, the wearable patch injector market faces several challenges. High development and manufacturing costs associated with advanced drug delivery systems can lead to premium pricing, potentially limiting accessibility for some patient populations and healthcare systems. Stringent regulatory approval processes, while ensuring safety and efficacy, can also lead to extended timelines for market entry. Furthermore, the need for robust clinical data to demonstrate superior efficacy and patient adherence compared to traditional methods presents an ongoing challenge. Ensuring the reliability and durability of these complex devices for long-term patient use, alongside managing supply chain complexities for specialized components, are also critical considerations.
Emerging Opportunities in Wearable Patch Injector
Emerging opportunities in the wearable patch injector market are largely driven by technological breakthroughs and strategic market expansion. The development of connected injectors capable of real-time data transmission for personalized medicine and remote patient monitoring opens vast potential. Innovations in drug delivery for previously untreatable or difficult-to-treat conditions, such as advanced oncology therapies and neurological disorders, present significant growth avenues. Strategic partnerships between pharmaceutical giants and specialized device manufacturers will continue to accelerate the co-development of novel drug-device combinations, unlocking new therapeutic frontiers. Furthermore, the expansion into emerging economies with growing healthcare infrastructure and an increasing focus on chronic disease management offers substantial untapped market potential.
Leading Players in the Wearable Patch Injector Sector
- Ypsomed
- BD
- Nemera
- Sonceboz
- CeQur Simplicity
- Enable Injections
- Gerresheimer
- Recipharm
- Springboard
- Amgen
- SteadyMed Therapeutics
- EOFlow
Key Milestones in Wearable Patch Injector Industry
- 2019: Launch of several next-generation wearable injectors with improved connectivity and comfort for chronic disease management.
- 2020: Increased investment in R&D for wearable patch injectors targeting autoimmune diseases and biopharmaceutical delivery.
- 2021: Major pharmaceutical companies form strategic partnerships with wearable device manufacturers to accelerate drug-device combination development.
- 2022: Regulatory bodies streamline approval pathways for innovative self-injection devices, fostering market growth.
- 2023: Introduction of smart wearable injectors with advanced features for adherence monitoring and data analytics.
- 2024: Significant advancements in high-dose patch injector technology for biologics and complex molecule delivery.
Strategic Outlook for Wearable Patch Injector Market
The strategic outlook for the wearable patch injector market is exceptionally positive, characterized by sustained innovation and expanding adoption. Key growth accelerators include the relentless pursuit of personalized medicine, which necessitates sophisticated drug delivery systems, and the increasing demand for home healthcare solutions driven by an aging global population and the rising prevalence of chronic conditions. Strategic collaborations between pharmaceutical and medical device companies will remain crucial for bringing novel drug-device combinations to market efficiently. Furthermore, continued investment in miniaturization, enhanced user interfaces, and digital connectivity will solidify the position of wearable patch injectors as a cornerstone of modern therapeutic delivery, promising significant market expansion and improved patient outcomes.
Wearable Patch Injector Segmentation
-
1. Application
- 1.1. Hospital
- 1.2. Clinic
- 1.3. Home Care
- 1.4. Others
-
2. Types
- 2.1. High Dose Injector
- 2.2. Small Dose Injector
Wearable Patch Injector Segmentation By Geography
-
1. North America
- 1.1. United States
- 1.2. Canada
- 1.3. Mexico
-
2. South America
- 2.1. Brazil
- 2.2. Argentina
- 2.3. Rest of South America
-
3. Europe
- 3.1. United Kingdom
- 3.2. Germany
- 3.3. France
- 3.4. Italy
- 3.5. Spain
- 3.6. Russia
- 3.7. Benelux
- 3.8. Nordics
- 3.9. Rest of Europe
-
4. Middle East & Africa
- 4.1. Turkey
- 4.2. Israel
- 4.3. GCC
- 4.4. North Africa
- 4.5. South Africa
- 4.6. Rest of Middle East & Africa
-
5. Asia Pacific
- 5.1. China
- 5.2. India
- 5.3. Japan
- 5.4. South Korea
- 5.5. ASEAN
- 5.6. Oceania
- 5.7. Rest of Asia Pacific
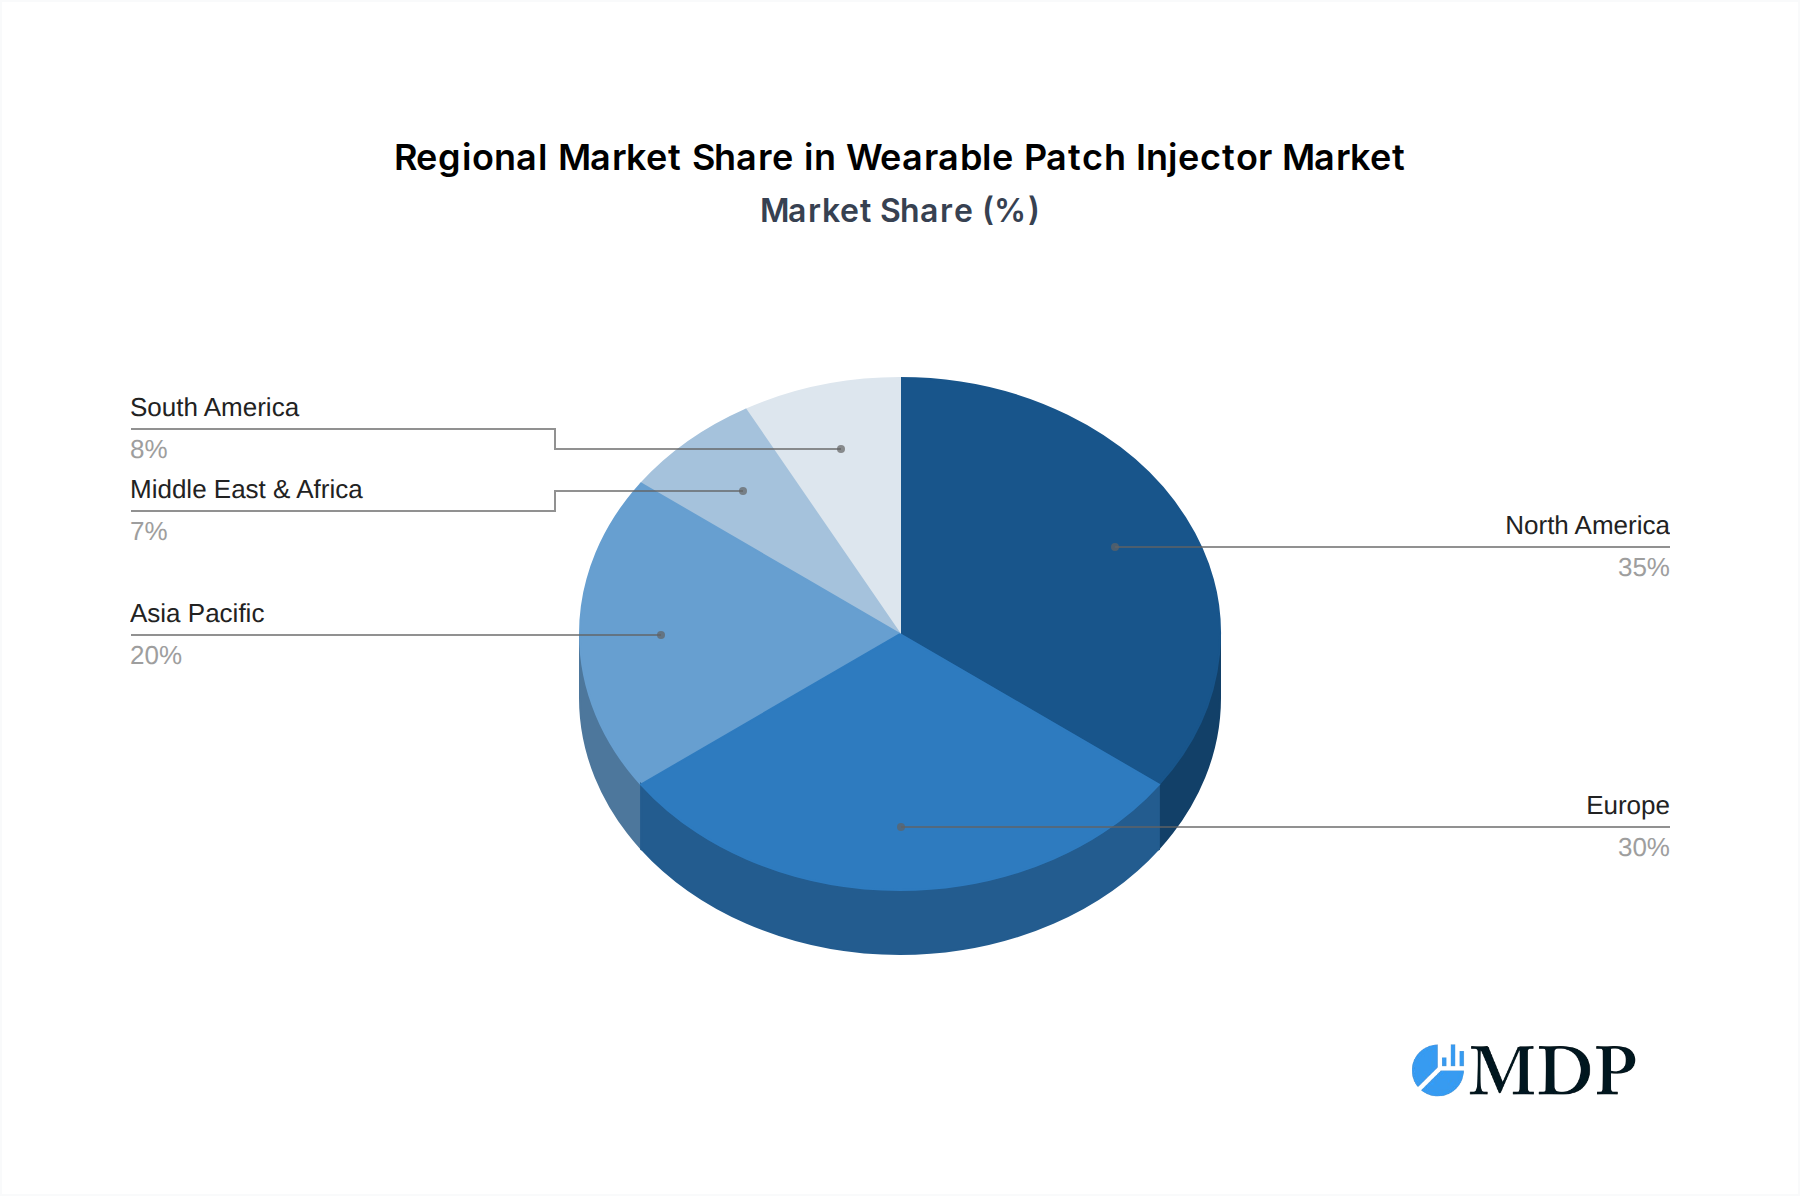
Wearable Patch Injector Regional Market Share
Geographic Coverage of Wearable Patch Injector
Wearable Patch Injector REPORT HIGHLIGHTS
| Aspects | Details |
|---|---|
| Study Period | 2020-2034 |
| Base Year | 2025 |
| Estimated Year | 2026 |
| Forecast Period | 2026-2034 |
| Historical Period | 2020-2025 |
| Growth Rate | CAGR of 10.8% from 2020-2034 |
| Segmentation |
|
Table of Contents
- 1. Introduction
- 1.1. Research Scope
- 1.2. Market Segmentation
- 1.3. Research Methodology
- 1.4. Definitions and Assumptions
- 2. Executive Summary
- 2.1. Introduction
- 3. Market Dynamics
- 3.1. Introduction
- 3.2. Market Drivers
- 3.3. Market Restrains
- 3.4. Market Trends
- 4. Market Factor Analysis
- 4.1. Porters Five Forces
- 4.2. Supply/Value Chain
- 4.3. PESTEL analysis
- 4.4. Market Entropy
- 4.5. Patent/Trademark Analysis
- 5. Global Wearable Patch Injector Analysis, Insights and Forecast, 2020-2032
- 5.1. Market Analysis, Insights and Forecast - by Application
- 5.1.1. Hospital
- 5.1.2. Clinic
- 5.1.3. Home Care
- 5.1.4. Others
- 5.2. Market Analysis, Insights and Forecast - by Types
- 5.2.1. High Dose Injector
- 5.2.2. Small Dose Injector
- 5.3. Market Analysis, Insights and Forecast - by Region
- 5.3.1. North America
- 5.3.2. South America
- 5.3.3. Europe
- 5.3.4. Middle East & Africa
- 5.3.5. Asia Pacific
- 5.1. Market Analysis, Insights and Forecast - by Application
- 6. North America Wearable Patch Injector Analysis, Insights and Forecast, 2020-2032
- 6.1. Market Analysis, Insights and Forecast - by Application
- 6.1.1. Hospital
- 6.1.2. Clinic
- 6.1.3. Home Care
- 6.1.4. Others
- 6.2. Market Analysis, Insights and Forecast - by Types
- 6.2.1. High Dose Injector
- 6.2.2. Small Dose Injector
- 6.1. Market Analysis, Insights and Forecast - by Application
- 7. South America Wearable Patch Injector Analysis, Insights and Forecast, 2020-2032
- 7.1. Market Analysis, Insights and Forecast - by Application
- 7.1.1. Hospital
- 7.1.2. Clinic
- 7.1.3. Home Care
- 7.1.4. Others
- 7.2. Market Analysis, Insights and Forecast - by Types
- 7.2.1. High Dose Injector
- 7.2.2. Small Dose Injector
- 7.1. Market Analysis, Insights and Forecast - by Application
- 8. Europe Wearable Patch Injector Analysis, Insights and Forecast, 2020-2032
- 8.1. Market Analysis, Insights and Forecast - by Application
- 8.1.1. Hospital
- 8.1.2. Clinic
- 8.1.3. Home Care
- 8.1.4. Others
- 8.2. Market Analysis, Insights and Forecast - by Types
- 8.2.1. High Dose Injector
- 8.2.2. Small Dose Injector
- 8.1. Market Analysis, Insights and Forecast - by Application
- 9. Middle East & Africa Wearable Patch Injector Analysis, Insights and Forecast, 2020-2032
- 9.1. Market Analysis, Insights and Forecast - by Application
- 9.1.1. Hospital
- 9.1.2. Clinic
- 9.1.3. Home Care
- 9.1.4. Others
- 9.2. Market Analysis, Insights and Forecast - by Types
- 9.2.1. High Dose Injector
- 9.2.2. Small Dose Injector
- 9.1. Market Analysis, Insights and Forecast - by Application
- 10. Asia Pacific Wearable Patch Injector Analysis, Insights and Forecast, 2020-2032
- 10.1. Market Analysis, Insights and Forecast - by Application
- 10.1.1. Hospital
- 10.1.2. Clinic
- 10.1.3. Home Care
- 10.1.4. Others
- 10.2. Market Analysis, Insights and Forecast - by Types
- 10.2.1. High Dose Injector
- 10.2.2. Small Dose Injector
- 10.1. Market Analysis, Insights and Forecast - by Application
- 11. Competitive Analysis
- 11.1. Global Market Share Analysis 2025
- 11.2. Company Profiles
- 11.2.1 Ypsomed
- 11.2.1.1. Overview
- 11.2.1.2. Products
- 11.2.1.3. SWOT Analysis
- 11.2.1.4. Recent Developments
- 11.2.1.5. Financials (Based on Availability)
- 11.2.2 BD
- 11.2.2.1. Overview
- 11.2.2.2. Products
- 11.2.2.3. SWOT Analysis
- 11.2.2.4. Recent Developments
- 11.2.2.5. Financials (Based on Availability)
- 11.2.3 Nemera
- 11.2.3.1. Overview
- 11.2.3.2. Products
- 11.2.3.3. SWOT Analysis
- 11.2.3.4. Recent Developments
- 11.2.3.5. Financials (Based on Availability)
- 11.2.4 Sonceboz
- 11.2.4.1. Overview
- 11.2.4.2. Products
- 11.2.4.3. SWOT Analysis
- 11.2.4.4. Recent Developments
- 11.2.4.5. Financials (Based on Availability)
- 11.2.5 CeQur Simplicity
- 11.2.5.1. Overview
- 11.2.5.2. Products
- 11.2.5.3. SWOT Analysis
- 11.2.5.4. Recent Developments
- 11.2.5.5. Financials (Based on Availability)
- 11.2.6 Enable Injections
- 11.2.6.1. Overview
- 11.2.6.2. Products
- 11.2.6.3. SWOT Analysis
- 11.2.6.4. Recent Developments
- 11.2.6.5. Financials (Based on Availability)
- 11.2.7 Gerresheimer
- 11.2.7.1. Overview
- 11.2.7.2. Products
- 11.2.7.3. SWOT Analysis
- 11.2.7.4. Recent Developments
- 11.2.7.5. Financials (Based on Availability)
- 11.2.8 Recipharm
- 11.2.8.1. Overview
- 11.2.8.2. Products
- 11.2.8.3. SWOT Analysis
- 11.2.8.4. Recent Developments
- 11.2.8.5. Financials (Based on Availability)
- 11.2.9 Springboard
- 11.2.9.1. Overview
- 11.2.9.2. Products
- 11.2.9.3. SWOT Analysis
- 11.2.9.4. Recent Developments
- 11.2.9.5. Financials (Based on Availability)
- 11.2.10 Amgen
- 11.2.10.1. Overview
- 11.2.10.2. Products
- 11.2.10.3. SWOT Analysis
- 11.2.10.4. Recent Developments
- 11.2.10.5. Financials (Based on Availability)
- 11.2.11 SteadyMed Therapeutics
- 11.2.11.1. Overview
- 11.2.11.2. Products
- 11.2.11.3. SWOT Analysis
- 11.2.11.4. Recent Developments
- 11.2.11.5. Financials (Based on Availability)
- 11.2.12 EOFlow
- 11.2.12.1. Overview
- 11.2.12.2. Products
- 11.2.12.3. SWOT Analysis
- 11.2.12.4. Recent Developments
- 11.2.12.5. Financials (Based on Availability)
- 11.2.1 Ypsomed
List of Figures
- Figure 1: Global Wearable Patch Injector Revenue Breakdown (undefined, %) by Region 2025 & 2033
- Figure 2: Global Wearable Patch Injector Volume Breakdown (K, %) by Region 2025 & 2033
- Figure 3: North America Wearable Patch Injector Revenue (undefined), by Application 2025 & 2033
- Figure 4: North America Wearable Patch Injector Volume (K), by Application 2025 & 2033
- Figure 5: North America Wearable Patch Injector Revenue Share (%), by Application 2025 & 2033
- Figure 6: North America Wearable Patch Injector Volume Share (%), by Application 2025 & 2033
- Figure 7: North America Wearable Patch Injector Revenue (undefined), by Types 2025 & 2033
- Figure 8: North America Wearable Patch Injector Volume (K), by Types 2025 & 2033
- Figure 9: North America Wearable Patch Injector Revenue Share (%), by Types 2025 & 2033
- Figure 10: North America Wearable Patch Injector Volume Share (%), by Types 2025 & 2033
- Figure 11: North America Wearable Patch Injector Revenue (undefined), by Country 2025 & 2033
- Figure 12: North America Wearable Patch Injector Volume (K), by Country 2025 & 2033
- Figure 13: North America Wearable Patch Injector Revenue Share (%), by Country 2025 & 2033
- Figure 14: North America Wearable Patch Injector Volume Share (%), by Country 2025 & 2033
- Figure 15: South America Wearable Patch Injector Revenue (undefined), by Application 2025 & 2033
- Figure 16: South America Wearable Patch Injector Volume (K), by Application 2025 & 2033
- Figure 17: South America Wearable Patch Injector Revenue Share (%), by Application 2025 & 2033
- Figure 18: South America Wearable Patch Injector Volume Share (%), by Application 2025 & 2033
- Figure 19: South America Wearable Patch Injector Revenue (undefined), by Types 2025 & 2033
- Figure 20: South America Wearable Patch Injector Volume (K), by Types 2025 & 2033
- Figure 21: South America Wearable Patch Injector Revenue Share (%), by Types 2025 & 2033
- Figure 22: South America Wearable Patch Injector Volume Share (%), by Types 2025 & 2033
- Figure 23: South America Wearable Patch Injector Revenue (undefined), by Country 2025 & 2033
- Figure 24: South America Wearable Patch Injector Volume (K), by Country 2025 & 2033
- Figure 25: South America Wearable Patch Injector Revenue Share (%), by Country 2025 & 2033
- Figure 26: South America Wearable Patch Injector Volume Share (%), by Country 2025 & 2033
- Figure 27: Europe Wearable Patch Injector Revenue (undefined), by Application 2025 & 2033
- Figure 28: Europe Wearable Patch Injector Volume (K), by Application 2025 & 2033
- Figure 29: Europe Wearable Patch Injector Revenue Share (%), by Application 2025 & 2033
- Figure 30: Europe Wearable Patch Injector Volume Share (%), by Application 2025 & 2033
- Figure 31: Europe Wearable Patch Injector Revenue (undefined), by Types 2025 & 2033
- Figure 32: Europe Wearable Patch Injector Volume (K), by Types 2025 & 2033
- Figure 33: Europe Wearable Patch Injector Revenue Share (%), by Types 2025 & 2033
- Figure 34: Europe Wearable Patch Injector Volume Share (%), by Types 2025 & 2033
- Figure 35: Europe Wearable Patch Injector Revenue (undefined), by Country 2025 & 2033
- Figure 36: Europe Wearable Patch Injector Volume (K), by Country 2025 & 2033
- Figure 37: Europe Wearable Patch Injector Revenue Share (%), by Country 2025 & 2033
- Figure 38: Europe Wearable Patch Injector Volume Share (%), by Country 2025 & 2033
- Figure 39: Middle East & Africa Wearable Patch Injector Revenue (undefined), by Application 2025 & 2033
- Figure 40: Middle East & Africa Wearable Patch Injector Volume (K), by Application 2025 & 2033
- Figure 41: Middle East & Africa Wearable Patch Injector Revenue Share (%), by Application 2025 & 2033
- Figure 42: Middle East & Africa Wearable Patch Injector Volume Share (%), by Application 2025 & 2033
- Figure 43: Middle East & Africa Wearable Patch Injector Revenue (undefined), by Types 2025 & 2033
- Figure 44: Middle East & Africa Wearable Patch Injector Volume (K), by Types 2025 & 2033
- Figure 45: Middle East & Africa Wearable Patch Injector Revenue Share (%), by Types 2025 & 2033
- Figure 46: Middle East & Africa Wearable Patch Injector Volume Share (%), by Types 2025 & 2033
- Figure 47: Middle East & Africa Wearable Patch Injector Revenue (undefined), by Country 2025 & 2033
- Figure 48: Middle East & Africa Wearable Patch Injector Volume (K), by Country 2025 & 2033
- Figure 49: Middle East & Africa Wearable Patch Injector Revenue Share (%), by Country 2025 & 2033
- Figure 50: Middle East & Africa Wearable Patch Injector Volume Share (%), by Country 2025 & 2033
- Figure 51: Asia Pacific Wearable Patch Injector Revenue (undefined), by Application 2025 & 2033
- Figure 52: Asia Pacific Wearable Patch Injector Volume (K), by Application 2025 & 2033
- Figure 53: Asia Pacific Wearable Patch Injector Revenue Share (%), by Application 2025 & 2033
- Figure 54: Asia Pacific Wearable Patch Injector Volume Share (%), by Application 2025 & 2033
- Figure 55: Asia Pacific Wearable Patch Injector Revenue (undefined), by Types 2025 & 2033
- Figure 56: Asia Pacific Wearable Patch Injector Volume (K), by Types 2025 & 2033
- Figure 57: Asia Pacific Wearable Patch Injector Revenue Share (%), by Types 2025 & 2033
- Figure 58: Asia Pacific Wearable Patch Injector Volume Share (%), by Types 2025 & 2033
- Figure 59: Asia Pacific Wearable Patch Injector Revenue (undefined), by Country 2025 & 2033
- Figure 60: Asia Pacific Wearable Patch Injector Volume (K), by Country 2025 & 2033
- Figure 61: Asia Pacific Wearable Patch Injector Revenue Share (%), by Country 2025 & 2033
- Figure 62: Asia Pacific Wearable Patch Injector Volume Share (%), by Country 2025 & 2033
List of Tables
- Table 1: Global Wearable Patch Injector Revenue undefined Forecast, by Application 2020 & 2033
- Table 2: Global Wearable Patch Injector Volume K Forecast, by Application 2020 & 2033
- Table 3: Global Wearable Patch Injector Revenue undefined Forecast, by Types 2020 & 2033
- Table 4: Global Wearable Patch Injector Volume K Forecast, by Types 2020 & 2033
- Table 5: Global Wearable Patch Injector Revenue undefined Forecast, by Region 2020 & 2033
- Table 6: Global Wearable Patch Injector Volume K Forecast, by Region 2020 & 2033
- Table 7: Global Wearable Patch Injector Revenue undefined Forecast, by Application 2020 & 2033
- Table 8: Global Wearable Patch Injector Volume K Forecast, by Application 2020 & 2033
- Table 9: Global Wearable Patch Injector Revenue undefined Forecast, by Types 2020 & 2033
- Table 10: Global Wearable Patch Injector Volume K Forecast, by Types 2020 & 2033
- Table 11: Global Wearable Patch Injector Revenue undefined Forecast, by Country 2020 & 2033
- Table 12: Global Wearable Patch Injector Volume K Forecast, by Country 2020 & 2033
- Table 13: United States Wearable Patch Injector Revenue (undefined) Forecast, by Application 2020 & 2033
- Table 14: United States Wearable Patch Injector Volume (K) Forecast, by Application 2020 & 2033
- Table 15: Canada Wearable Patch Injector Revenue (undefined) Forecast, by Application 2020 & 2033
- Table 16: Canada Wearable Patch Injector Volume (K) Forecast, by Application 2020 & 2033
- Table 17: Mexico Wearable Patch Injector Revenue (undefined) Forecast, by Application 2020 & 2033
- Table 18: Mexico Wearable Patch Injector Volume (K) Forecast, by Application 2020 & 2033
- Table 19: Global Wearable Patch Injector Revenue undefined Forecast, by Application 2020 & 2033
- Table 20: Global Wearable Patch Injector Volume K Forecast, by Application 2020 & 2033
- Table 21: Global Wearable Patch Injector Revenue undefined Forecast, by Types 2020 & 2033
- Table 22: Global Wearable Patch Injector Volume K Forecast, by Types 2020 & 2033
- Table 23: Global Wearable Patch Injector Revenue undefined Forecast, by Country 2020 & 2033
- Table 24: Global Wearable Patch Injector Volume K Forecast, by Country 2020 & 2033
- Table 25: Brazil Wearable Patch Injector Revenue (undefined) Forecast, by Application 2020 & 2033
- Table 26: Brazil Wearable Patch Injector Volume (K) Forecast, by Application 2020 & 2033
- Table 27: Argentina Wearable Patch Injector Revenue (undefined) Forecast, by Application 2020 & 2033
- Table 28: Argentina Wearable Patch Injector Volume (K) Forecast, by Application 2020 & 2033
- Table 29: Rest of South America Wearable Patch Injector Revenue (undefined) Forecast, by Application 2020 & 2033
- Table 30: Rest of South America Wearable Patch Injector Volume (K) Forecast, by Application 2020 & 2033
- Table 31: Global Wearable Patch Injector Revenue undefined Forecast, by Application 2020 & 2033
- Table 32: Global Wearable Patch Injector Volume K Forecast, by Application 2020 & 2033
- Table 33: Global Wearable Patch Injector Revenue undefined Forecast, by Types 2020 & 2033
- Table 34: Global Wearable Patch Injector Volume K Forecast, by Types 2020 & 2033
- Table 35: Global Wearable Patch Injector Revenue undefined Forecast, by Country 2020 & 2033
- Table 36: Global Wearable Patch Injector Volume K Forecast, by Country 2020 & 2033
- Table 37: United Kingdom Wearable Patch Injector Revenue (undefined) Forecast, by Application 2020 & 2033
- Table 38: United Kingdom Wearable Patch Injector Volume (K) Forecast, by Application 2020 & 2033
- Table 39: Germany Wearable Patch Injector Revenue (undefined) Forecast, by Application 2020 & 2033
- Table 40: Germany Wearable Patch Injector Volume (K) Forecast, by Application 2020 & 2033
- Table 41: France Wearable Patch Injector Revenue (undefined) Forecast, by Application 2020 & 2033
- Table 42: France Wearable Patch Injector Volume (K) Forecast, by Application 2020 & 2033
- Table 43: Italy Wearable Patch Injector Revenue (undefined) Forecast, by Application 2020 & 2033
- Table 44: Italy Wearable Patch Injector Volume (K) Forecast, by Application 2020 & 2033
- Table 45: Spain Wearable Patch Injector Revenue (undefined) Forecast, by Application 2020 & 2033
- Table 46: Spain Wearable Patch Injector Volume (K) Forecast, by Application 2020 & 2033
- Table 47: Russia Wearable Patch Injector Revenue (undefined) Forecast, by Application 2020 & 2033
- Table 48: Russia Wearable Patch Injector Volume (K) Forecast, by Application 2020 & 2033
- Table 49: Benelux Wearable Patch Injector Revenue (undefined) Forecast, by Application 2020 & 2033
- Table 50: Benelux Wearable Patch Injector Volume (K) Forecast, by Application 2020 & 2033
- Table 51: Nordics Wearable Patch Injector Revenue (undefined) Forecast, by Application 2020 & 2033
- Table 52: Nordics Wearable Patch Injector Volume (K) Forecast, by Application 2020 & 2033
- Table 53: Rest of Europe Wearable Patch Injector Revenue (undefined) Forecast, by Application 2020 & 2033
- Table 54: Rest of Europe Wearable Patch Injector Volume (K) Forecast, by Application 2020 & 2033
- Table 55: Global Wearable Patch Injector Revenue undefined Forecast, by Application 2020 & 2033
- Table 56: Global Wearable Patch Injector Volume K Forecast, by Application 2020 & 2033
- Table 57: Global Wearable Patch Injector Revenue undefined Forecast, by Types 2020 & 2033
- Table 58: Global Wearable Patch Injector Volume K Forecast, by Types 2020 & 2033
- Table 59: Global Wearable Patch Injector Revenue undefined Forecast, by Country 2020 & 2033
- Table 60: Global Wearable Patch Injector Volume K Forecast, by Country 2020 & 2033
- Table 61: Turkey Wearable Patch Injector Revenue (undefined) Forecast, by Application 2020 & 2033
- Table 62: Turkey Wearable Patch Injector Volume (K) Forecast, by Application 2020 & 2033
- Table 63: Israel Wearable Patch Injector Revenue (undefined) Forecast, by Application 2020 & 2033
- Table 64: Israel Wearable Patch Injector Volume (K) Forecast, by Application 2020 & 2033
- Table 65: GCC Wearable Patch Injector Revenue (undefined) Forecast, by Application 2020 & 2033
- Table 66: GCC Wearable Patch Injector Volume (K) Forecast, by Application 2020 & 2033
- Table 67: North Africa Wearable Patch Injector Revenue (undefined) Forecast, by Application 2020 & 2033
- Table 68: North Africa Wearable Patch Injector Volume (K) Forecast, by Application 2020 & 2033
- Table 69: South Africa Wearable Patch Injector Revenue (undefined) Forecast, by Application 2020 & 2033
- Table 70: South Africa Wearable Patch Injector Volume (K) Forecast, by Application 2020 & 2033
- Table 71: Rest of Middle East & Africa Wearable Patch Injector Revenue (undefined) Forecast, by Application 2020 & 2033
- Table 72: Rest of Middle East & Africa Wearable Patch Injector Volume (K) Forecast, by Application 2020 & 2033
- Table 73: Global Wearable Patch Injector Revenue undefined Forecast, by Application 2020 & 2033
- Table 74: Global Wearable Patch Injector Volume K Forecast, by Application 2020 & 2033
- Table 75: Global Wearable Patch Injector Revenue undefined Forecast, by Types 2020 & 2033
- Table 76: Global Wearable Patch Injector Volume K Forecast, by Types 2020 & 2033
- Table 77: Global Wearable Patch Injector Revenue undefined Forecast, by Country 2020 & 2033
- Table 78: Global Wearable Patch Injector Volume K Forecast, by Country 2020 & 2033
- Table 79: China Wearable Patch Injector Revenue (undefined) Forecast, by Application 2020 & 2033
- Table 80: China Wearable Patch Injector Volume (K) Forecast, by Application 2020 & 2033
- Table 81: India Wearable Patch Injector Revenue (undefined) Forecast, by Application 2020 & 2033
- Table 82: India Wearable Patch Injector Volume (K) Forecast, by Application 2020 & 2033
- Table 83: Japan Wearable Patch Injector Revenue (undefined) Forecast, by Application 2020 & 2033
- Table 84: Japan Wearable Patch Injector Volume (K) Forecast, by Application 2020 & 2033
- Table 85: South Korea Wearable Patch Injector Revenue (undefined) Forecast, by Application 2020 & 2033
- Table 86: South Korea Wearable Patch Injector Volume (K) Forecast, by Application 2020 & 2033
- Table 87: ASEAN Wearable Patch Injector Revenue (undefined) Forecast, by Application 2020 & 2033
- Table 88: ASEAN Wearable Patch Injector Volume (K) Forecast, by Application 2020 & 2033
- Table 89: Oceania Wearable Patch Injector Revenue (undefined) Forecast, by Application 2020 & 2033
- Table 90: Oceania Wearable Patch Injector Volume (K) Forecast, by Application 2020 & 2033
- Table 91: Rest of Asia Pacific Wearable Patch Injector Revenue (undefined) Forecast, by Application 2020 & 2033
- Table 92: Rest of Asia Pacific Wearable Patch Injector Volume (K) Forecast, by Application 2020 & 2033
Frequently Asked Questions
1. What is the projected Compound Annual Growth Rate (CAGR) of the Wearable Patch Injector?
The projected CAGR is approximately 10.8%.
2. Which companies are prominent players in the Wearable Patch Injector?
Key companies in the market include Ypsomed, BD, Nemera, Sonceboz, CeQur Simplicity, Enable Injections, Gerresheimer, Recipharm, Springboard, Amgen, SteadyMed Therapeutics, EOFlow.
3. What are the main segments of the Wearable Patch Injector?
The market segments include Application, Types.
4. Can you provide details about the market size?
The market size is estimated to be USD XXX N/A as of 2022.
5. What are some drivers contributing to market growth?
N/A
6. What are the notable trends driving market growth?
N/A
7. Are there any restraints impacting market growth?
N/A
8. Can you provide examples of recent developments in the market?
N/A
9. What pricing options are available for accessing the report?
Pricing options include single-user, multi-user, and enterprise licenses priced at USD 4350.00, USD 6525.00, and USD 8700.00 respectively.
10. Is the market size provided in terms of value or volume?
The market size is provided in terms of value, measured in N/A and volume, measured in K.
11. Are there any specific market keywords associated with the report?
Yes, the market keyword associated with the report is "Wearable Patch Injector," which aids in identifying and referencing the specific market segment covered.
12. How do I determine which pricing option suits my needs best?
The pricing options vary based on user requirements and access needs. Individual users may opt for single-user licenses, while businesses requiring broader access may choose multi-user or enterprise licenses for cost-effective access to the report.
13. Are there any additional resources or data provided in the Wearable Patch Injector report?
While the report offers comprehensive insights, it's advisable to review the specific contents or supplementary materials provided to ascertain if additional resources or data are available.
14. How can I stay updated on further developments or reports in the Wearable Patch Injector?
To stay informed about further developments, trends, and reports in the Wearable Patch Injector, consider subscribing to industry newsletters, following relevant companies and organizations, or regularly checking reputable industry news sources and publications.
Methodology
Step 1 - Identification of Relevant Samples Size from Population Database


Step 2 - Approaches for Defining Global Market Size (Value, Volume* & Price*)

Note*: In applicable scenarios
Step 3 - Data Sources
Primary Research
- Web Analytics
- Survey Reports
- Research Institute
- Latest Research Reports
- Opinion Leaders
Secondary Research
- Annual Reports
- White Paper
- Latest Press Release
- Industry Association
- Paid Database
- Investor Presentations

Step 4 - Data Triangulation
Involves using different sources of information in order to increase the validity of a study
These sources are likely to be stakeholders in a program - participants, other researchers, program staff, other community members, and so on.
Then we put all data in single framework & apply various statistical tools to find out the dynamic on the market.
During the analysis stage, feedback from the stakeholder groups would be compared to determine areas of agreement as well as areas of divergence