

Key Insights
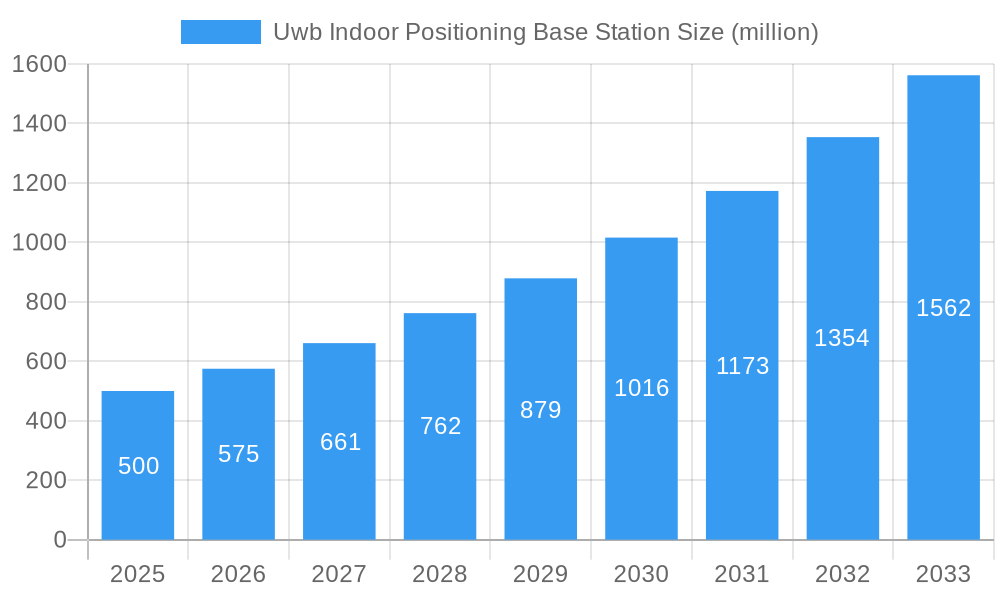
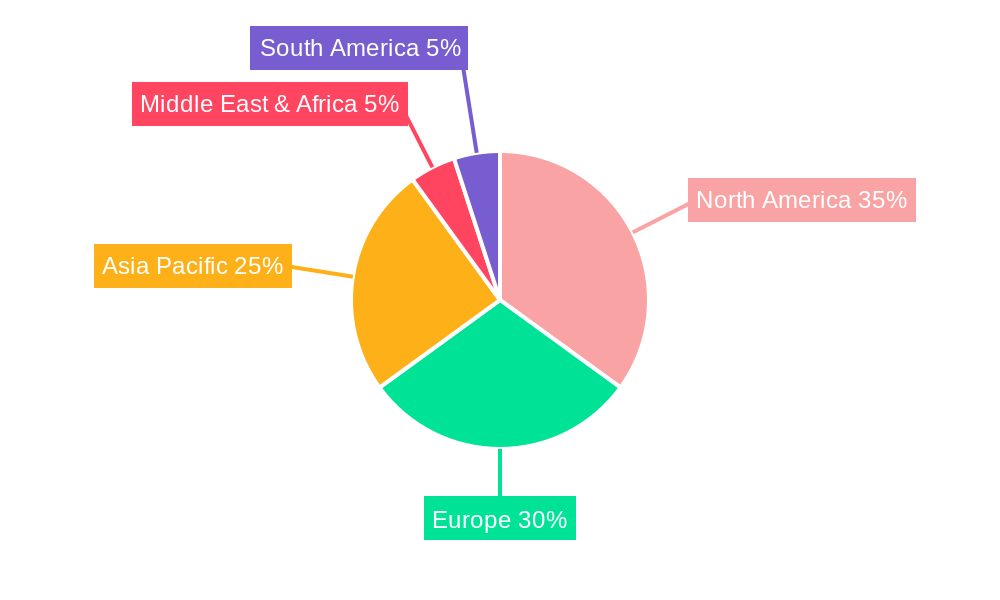
The UWB Indoor Positioning Base Station market is experiencing robust growth, driven by increasing demand for precise indoor location tracking across diverse sectors. The market, estimated at $500 million in 2025, is projected to witness a Compound Annual Growth Rate (CAGR) of 15% from 2025 to 2033, reaching approximately $1.8 billion by 2033. Key drivers include the rising adoption of Real-Time Location Systems (RTLS) in warehouse and logistics management for optimized inventory control and enhanced operational efficiency, smart factory applications demanding precise asset tracking and worker safety monitoring, and the expansion of smart building technologies integrating location-based services. Furthermore, the construction industry's growing use of UWB for worker safety and project management is contributing to market expansion. The ceiling-mounted base station segment currently holds the largest market share due to its ease of installation and broad applicability, but pillar-mounted and other innovative base station types are gaining traction, driven by specific application needs. North America and Europe currently represent significant market shares, reflecting high adoption rates in advanced economies, however, the Asia-Pacific region is poised for substantial growth fueled by rapid industrialization and technological advancements in countries like China and India. Market restraints include the relatively higher initial investment costs compared to other positioning technologies and the need for robust infrastructure deployment.
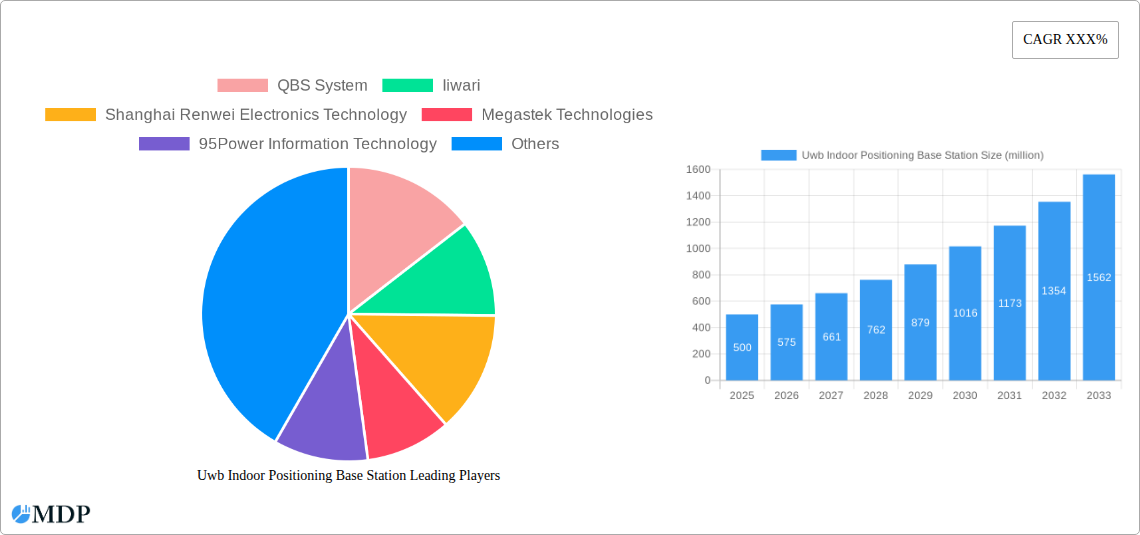
Uwb Indoor Positioning Base Station Market Size (In Million)
Despite these challenges, the market's long-term prospects remain positive. Continuous technological advancements leading to improved accuracy, reduced power consumption, and cost-effectiveness of UWB technology will further stimulate market expansion. The emergence of innovative applications in healthcare, retail, and security further broadens the market's potential. Competition among key players like QBS System, Iiwari, and others is fostering innovation and driving down costs, making UWB indoor positioning solutions more accessible to a wider range of users. The market's segmentation by application (electricity, industrial manufacturing, etc.) and type of base station reflects the diverse needs and deployment scenarios across different industries and environments. This specialized approach enables tailored solutions that meet specific requirements, maximizing the effectiveness of UWB technology in diverse settings.
Uwb Indoor Positioning Base Station Company Market Share
UWB Indoor Positioning Base Station Market Report: 2019-2033
This comprehensive report provides an in-depth analysis of the UWB Indoor Positioning Base Station market, projecting a market value exceeding $XX million by 2033. This detailed study covers market dynamics, industry trends, leading players, and future opportunities, offering actionable insights for stakeholders across the value chain. The report covers the period 2019-2033, with a focus on the estimated year 2025 and a forecast period of 2025-2033.
Uwb Indoor Positioning Base Station Market Dynamics & Concentration
The UWB Indoor Positioning Base Station market, valued at $XX million in 2025, exhibits a moderately concentrated landscape. Key players such as QBS System, Iiwari, Shanghai Renwei Electronics Technology, Megastek Technologies, 95Power Information Technology, Zhengzhou Locaris, Shenzhen Ruizhong, and Wellnode compete intensely, driving innovation and shaping market dynamics. Market share is currently dominated by a few key players, with QBS System holding an estimated XX% market share in 2025, followed by Iiwari at XX%. The market is characterized by continuous innovation, driven by the need for enhanced accuracy and range in indoor positioning applications. Regulatory frameworks, particularly concerning data privacy and security, are increasingly influential. Product substitutes, such as Bluetooth-based systems, pose a competitive challenge, although UWB's superior accuracy often provides a decisive advantage. End-user trends favor increased adoption across various sectors, fueled by the growing demand for real-time location tracking and asset management. M&A activity remains moderate, with approximately XX deals recorded during the historical period (2019-2024), primarily focused on expanding market reach and technological capabilities.
Uwb Indoor Positioning Base Station Industry Trends & Analysis
The UWB Indoor Positioning Base Station market is experiencing robust growth, with a projected CAGR of XX% during the forecast period (2025-2033). This growth is fueled by several key factors: increasing demand for precise indoor positioning in diverse applications, technological advancements leading to improved accuracy and lower costs, and expanding adoption across various industries. Market penetration is steadily increasing, particularly in sectors such as warehousing and logistics, where real-time asset tracking and inventory management are crucial. Technological disruptions, such as the development of more energy-efficient and cost-effective UWB chips, are further driving market expansion. Consumer preferences are shifting towards systems offering seamless integration, easy installation, and robust performance. Competitive dynamics are shaped by ongoing innovation, strategic partnerships, and the continuous efforts of established players to maintain their market share. The growing adoption of IoT (Internet of Things) technologies is also creating significant opportunities for UWB indoor positioning solutions.
Leading Markets & Segments in Uwb Indoor Positioning Base Station
The warehousing and logistics segment dominates the UWB Indoor Positioning Base Station market, accounting for approximately XX% of the total market value in 2025. This dominance is driven by the increasing need for efficient inventory management, real-time asset tracking, and improved operational efficiency. The electricity sector is also a significant segment, utilizing UWB technology for worker safety and precise equipment location.
Key Drivers:
- Warehousing & Logistics: Demand for enhanced efficiency and accuracy in inventory management and supply chain optimization.
- Electricity: Safety concerns related to personnel tracking and equipment location within potentially hazardous environments.
- Industrial Manufacturing: Process optimization, automation, and real-time asset monitoring.
Dominance Analysis:
The leading region for UWB Indoor Positioning Base Station deployment is currently North America, followed by Europe and Asia-Pacific. This is primarily attributed to high levels of technological adoption, strong industrial infrastructure, and government support for smart city initiatives. Ceiling-mounted base stations constitute the largest segment by type, offering ease of installation and broad coverage. However, the market for pillar-mounted base stations is also experiencing significant growth, particularly in applications requiring targeted coverage and enhanced flexibility.
Uwb Indoor Positioning Base Station Product Developments
Recent product developments focus on enhancing accuracy, reducing power consumption, and improving ease of integration. Manufacturers are incorporating advanced algorithms and signal processing techniques to improve the precision of location data. The development of smaller, more energy-efficient UWB chips has made these systems more cost-effective and suitable for deployment in a wider range of applications. New products are also emphasizing seamless integration with existing enterprise resource planning (ERP) systems and other business management software, enhancing usability and data accessibility.
Key Drivers of Uwb Indoor Positioning Base Station Growth
Several factors are driving the growth of the UWB Indoor Positioning Base Station market. Technological advancements leading to improved accuracy and lower costs are a key driver. Increasing demand for real-time location tracking across various industries, such as warehousing and logistics, manufacturing, and healthcare, are also significant contributors. Government initiatives promoting the adoption of smart technologies and supportive regulatory frameworks further fuel market expansion.
Challenges in the Uwb Indoor Positioning Base Station Market
Challenges include the high initial investment costs associated with deploying UWB systems, potential interference from other radio frequency signals, and concerns around data privacy and security. Supply chain disruptions can also impact the availability and pricing of components. Competition from alternative technologies, such as Bluetooth and Wi-Fi, also presents a challenge. The cost of skilled labor for installation and maintenance can also impact market adoption in certain regions.
Emerging Opportunities in Uwb Indoor Positioning Base Station
The integration of UWB technology with other technologies, such as AI and machine learning, presents significant growth opportunities. Strategic partnerships between technology providers and system integrators will also accelerate market adoption. Expansion into new vertical markets, such as healthcare and retail, will broaden the market's reach. Developments in battery technology leading to more energy efficient solutions, and further miniaturization of the hardware will significantly boost demand.
Leading Players in the Uwb Indoor Positioning Base Station Sector
- QBS System
- Iiwari
- Shanghai Renwei Electronics Technology
- Megastek Technologies
- 95Power Information Technology
- Zhengzhou Locaris
- Shenzhen Ruizhong
- Wellnode
Key Milestones in Uwb Indoor Positioning Base Station Industry
- 2020: Introduction of the first low-power, high-accuracy UWB chipsets.
- 2022: Several major partnerships formed between UWB technology providers and system integrators.
- 2023: Significant adoption of UWB technology in large-scale warehousing facilities.
- 2024: Launch of several new UWB indoor positioning solutions optimized for specific industry applications.
Strategic Outlook for Uwb Indoor Positioning Base Station Market
The UWB Indoor Positioning Base Station market is poised for significant growth, driven by technological advancements, increasing industry adoption, and supportive regulatory frameworks. Strategic opportunities lie in developing innovative solutions tailored to specific industry needs, fostering strategic partnerships, and expanding into new geographic markets. Companies focused on innovation, strategic alliances, and efficient supply chain management are well-positioned for success in this dynamic market.
Uwb Indoor Positioning Base Station Segmentation
-
1. Application
- 1.1. Electricity
- 1.2. Industrial Manufacturing
- 1.3. Warehousing and Logistics
- 1.4. Construction Industry
- 1.5. Other
-
2. Type
- 2.1. Ceiling-Mounted Base Station
- 2.2. Pillar-Mounted Base Station
- 2.3. Other Base Stations
Uwb Indoor Positioning Base Station Segmentation By Geography
-
1. North America
- 1.1. United States
- 1.2. Canada
- 1.3. Mexico
-
2. South America
- 2.1. Brazil
- 2.2. Argentina
- 2.3. Rest of South America
-
3. Europe
- 3.1. United Kingdom
- 3.2. Germany
- 3.3. France
- 3.4. Italy
- 3.5. Spain
- 3.6. Russia
- 3.7. Benelux
- 3.8. Nordics
- 3.9. Rest of Europe
-
4. Middle East & Africa
- 4.1. Turkey
- 4.2. Israel
- 4.3. GCC
- 4.4. North Africa
- 4.5. South Africa
- 4.6. Rest of Middle East & Africa
-
5. Asia Pacific
- 5.1. China
- 5.2. India
- 5.3. Japan
- 5.4. South Korea
- 5.5. ASEAN
- 5.6. Oceania
- 5.7. Rest of Asia Pacific
Uwb Indoor Positioning Base Station Regional Market Share
Geographic Coverage of Uwb Indoor Positioning Base Station
Uwb Indoor Positioning Base Station REPORT HIGHLIGHTS
| Aspects | Details |
|---|---|
| Study Period | 2020-2034 |
| Base Year | 2025 |
| Estimated Year | 2026 |
| Forecast Period | 2026-2034 |
| Historical Period | 2020-2025 |
| Growth Rate | CAGR of XXX% from 2020-2034 |
| Segmentation |
|
Table of Contents
- 1. Introduction
- 1.1. Research Scope
- 1.2. Market Segmentation
- 1.3. Research Methodology
- 1.4. Definitions and Assumptions
- 2. Executive Summary
- 2.1. Introduction
- 3. Market Dynamics
- 3.1. Introduction
- 3.2. Market Drivers
- 3.3. Market Restrains
- 3.4. Market Trends
- 4. Market Factor Analysis
- 4.1. Porters Five Forces
- 4.2. Supply/Value Chain
- 4.3. PESTEL analysis
- 4.4. Market Entropy
- 4.5. Patent/Trademark Analysis
- 5. Global Uwb Indoor Positioning Base Station Analysis, Insights and Forecast, 2020-2032
- 5.1. Market Analysis, Insights and Forecast - by Application
- 5.1.1. Electricity
- 5.1.2. Industrial Manufacturing
- 5.1.3. Warehousing and Logistics
- 5.1.4. Construction Industry
- 5.1.5. Other
- 5.2. Market Analysis, Insights and Forecast - by Type
- 5.2.1. Ceiling-Mounted Base Station
- 5.2.2. Pillar-Mounted Base Station
- 5.2.3. Other Base Stations
- 5.3. Market Analysis, Insights and Forecast - by Region
- 5.3.1. North America
- 5.3.2. South America
- 5.3.3. Europe
- 5.3.4. Middle East & Africa
- 5.3.5. Asia Pacific
- 5.1. Market Analysis, Insights and Forecast - by Application
- 6. North America Uwb Indoor Positioning Base Station Analysis, Insights and Forecast, 2020-2032
- 6.1. Market Analysis, Insights and Forecast - by Application
- 6.1.1. Electricity
- 6.1.2. Industrial Manufacturing
- 6.1.3. Warehousing and Logistics
- 6.1.4. Construction Industry
- 6.1.5. Other
- 6.2. Market Analysis, Insights and Forecast - by Type
- 6.2.1. Ceiling-Mounted Base Station
- 6.2.2. Pillar-Mounted Base Station
- 6.2.3. Other Base Stations
- 6.1. Market Analysis, Insights and Forecast - by Application
- 7. South America Uwb Indoor Positioning Base Station Analysis, Insights and Forecast, 2020-2032
- 7.1. Market Analysis, Insights and Forecast - by Application
- 7.1.1. Electricity
- 7.1.2. Industrial Manufacturing
- 7.1.3. Warehousing and Logistics
- 7.1.4. Construction Industry
- 7.1.5. Other
- 7.2. Market Analysis, Insights and Forecast - by Type
- 7.2.1. Ceiling-Mounted Base Station
- 7.2.2. Pillar-Mounted Base Station
- 7.2.3. Other Base Stations
- 7.1. Market Analysis, Insights and Forecast - by Application
- 8. Europe Uwb Indoor Positioning Base Station Analysis, Insights and Forecast, 2020-2032
- 8.1. Market Analysis, Insights and Forecast - by Application
- 8.1.1. Electricity
- 8.1.2. Industrial Manufacturing
- 8.1.3. Warehousing and Logistics
- 8.1.4. Construction Industry
- 8.1.5. Other
- 8.2. Market Analysis, Insights and Forecast - by Type
- 8.2.1. Ceiling-Mounted Base Station
- 8.2.2. Pillar-Mounted Base Station
- 8.2.3. Other Base Stations
- 8.1. Market Analysis, Insights and Forecast - by Application
- 9. Middle East & Africa Uwb Indoor Positioning Base Station Analysis, Insights and Forecast, 2020-2032
- 9.1. Market Analysis, Insights and Forecast - by Application
- 9.1.1. Electricity
- 9.1.2. Industrial Manufacturing
- 9.1.3. Warehousing and Logistics
- 9.1.4. Construction Industry
- 9.1.5. Other
- 9.2. Market Analysis, Insights and Forecast - by Type
- 9.2.1. Ceiling-Mounted Base Station
- 9.2.2. Pillar-Mounted Base Station
- 9.2.3. Other Base Stations
- 9.1. Market Analysis, Insights and Forecast - by Application
- 10. Asia Pacific Uwb Indoor Positioning Base Station Analysis, Insights and Forecast, 2020-2032
- 10.1. Market Analysis, Insights and Forecast - by Application
- 10.1.1. Electricity
- 10.1.2. Industrial Manufacturing
- 10.1.3. Warehousing and Logistics
- 10.1.4. Construction Industry
- 10.1.5. Other
- 10.2. Market Analysis, Insights and Forecast - by Type
- 10.2.1. Ceiling-Mounted Base Station
- 10.2.2. Pillar-Mounted Base Station
- 10.2.3. Other Base Stations
- 10.1. Market Analysis, Insights and Forecast - by Application
- 11. Competitive Analysis
- 11.1. Global Market Share Analysis 2025
- 11.2. Company Profiles
- 11.2.1 QBS System
- 11.2.1.1. Overview
- 11.2.1.2. Products
- 11.2.1.3. SWOT Analysis
- 11.2.1.4. Recent Developments
- 11.2.1.5. Financials (Based on Availability)
- 11.2.2 Iiwari
- 11.2.2.1. Overview
- 11.2.2.2. Products
- 11.2.2.3. SWOT Analysis
- 11.2.2.4. Recent Developments
- 11.2.2.5. Financials (Based on Availability)
- 11.2.3 Shanghai Renwei Electronics Technology
- 11.2.3.1. Overview
- 11.2.3.2. Products
- 11.2.3.3. SWOT Analysis
- 11.2.3.4. Recent Developments
- 11.2.3.5. Financials (Based on Availability)
- 11.2.4 Megastek Technologies
- 11.2.4.1. Overview
- 11.2.4.2. Products
- 11.2.4.3. SWOT Analysis
- 11.2.4.4. Recent Developments
- 11.2.4.5. Financials (Based on Availability)
- 11.2.5 95Power Information Technology
- 11.2.5.1. Overview
- 11.2.5.2. Products
- 11.2.5.3. SWOT Analysis
- 11.2.5.4. Recent Developments
- 11.2.5.5. Financials (Based on Availability)
- 11.2.6 Zhengzhou Locaris
- 11.2.6.1. Overview
- 11.2.6.2. Products
- 11.2.6.3. SWOT Analysis
- 11.2.6.4. Recent Developments
- 11.2.6.5. Financials (Based on Availability)
- 11.2.7 Shenzhen Ruizhong
- 11.2.7.1. Overview
- 11.2.7.2. Products
- 11.2.7.3. SWOT Analysis
- 11.2.7.4. Recent Developments
- 11.2.7.5. Financials (Based on Availability)
- 11.2.8 Wellnode
- 11.2.8.1. Overview
- 11.2.8.2. Products
- 11.2.8.3. SWOT Analysis
- 11.2.8.4. Recent Developments
- 11.2.8.5. Financials (Based on Availability)
- 11.2.1 QBS System
List of Figures
- Figure 1: Global Uwb Indoor Positioning Base Station Revenue Breakdown (million, %) by Region 2025 & 2033
- Figure 2: Global Uwb Indoor Positioning Base Station Volume Breakdown (K, %) by Region 2025 & 2033
- Figure 3: North America Uwb Indoor Positioning Base Station Revenue (million), by Application 2025 & 2033
- Figure 4: North America Uwb Indoor Positioning Base Station Volume (K), by Application 2025 & 2033
- Figure 5: North America Uwb Indoor Positioning Base Station Revenue Share (%), by Application 2025 & 2033
- Figure 6: North America Uwb Indoor Positioning Base Station Volume Share (%), by Application 2025 & 2033
- Figure 7: North America Uwb Indoor Positioning Base Station Revenue (million), by Type 2025 & 2033
- Figure 8: North America Uwb Indoor Positioning Base Station Volume (K), by Type 2025 & 2033
- Figure 9: North America Uwb Indoor Positioning Base Station Revenue Share (%), by Type 2025 & 2033
- Figure 10: North America Uwb Indoor Positioning Base Station Volume Share (%), by Type 2025 & 2033
- Figure 11: North America Uwb Indoor Positioning Base Station Revenue (million), by Country 2025 & 2033
- Figure 12: North America Uwb Indoor Positioning Base Station Volume (K), by Country 2025 & 2033
- Figure 13: North America Uwb Indoor Positioning Base Station Revenue Share (%), by Country 2025 & 2033
- Figure 14: North America Uwb Indoor Positioning Base Station Volume Share (%), by Country 2025 & 2033
- Figure 15: South America Uwb Indoor Positioning Base Station Revenue (million), by Application 2025 & 2033
- Figure 16: South America Uwb Indoor Positioning Base Station Volume (K), by Application 2025 & 2033
- Figure 17: South America Uwb Indoor Positioning Base Station Revenue Share (%), by Application 2025 & 2033
- Figure 18: South America Uwb Indoor Positioning Base Station Volume Share (%), by Application 2025 & 2033
- Figure 19: South America Uwb Indoor Positioning Base Station Revenue (million), by Type 2025 & 2033
- Figure 20: South America Uwb Indoor Positioning Base Station Volume (K), by Type 2025 & 2033
- Figure 21: South America Uwb Indoor Positioning Base Station Revenue Share (%), by Type 2025 & 2033
- Figure 22: South America Uwb Indoor Positioning Base Station Volume Share (%), by Type 2025 & 2033
- Figure 23: South America Uwb Indoor Positioning Base Station Revenue (million), by Country 2025 & 2033
- Figure 24: South America Uwb Indoor Positioning Base Station Volume (K), by Country 2025 & 2033
- Figure 25: South America Uwb Indoor Positioning Base Station Revenue Share (%), by Country 2025 & 2033
- Figure 26: South America Uwb Indoor Positioning Base Station Volume Share (%), by Country 2025 & 2033
- Figure 27: Europe Uwb Indoor Positioning Base Station Revenue (million), by Application 2025 & 2033
- Figure 28: Europe Uwb Indoor Positioning Base Station Volume (K), by Application 2025 & 2033
- Figure 29: Europe Uwb Indoor Positioning Base Station Revenue Share (%), by Application 2025 & 2033
- Figure 30: Europe Uwb Indoor Positioning Base Station Volume Share (%), by Application 2025 & 2033
- Figure 31: Europe Uwb Indoor Positioning Base Station Revenue (million), by Type 2025 & 2033
- Figure 32: Europe Uwb Indoor Positioning Base Station Volume (K), by Type 2025 & 2033
- Figure 33: Europe Uwb Indoor Positioning Base Station Revenue Share (%), by Type 2025 & 2033
- Figure 34: Europe Uwb Indoor Positioning Base Station Volume Share (%), by Type 2025 & 2033
- Figure 35: Europe Uwb Indoor Positioning Base Station Revenue (million), by Country 2025 & 2033
- Figure 36: Europe Uwb Indoor Positioning Base Station Volume (K), by Country 2025 & 2033
- Figure 37: Europe Uwb Indoor Positioning Base Station Revenue Share (%), by Country 2025 & 2033
- Figure 38: Europe Uwb Indoor Positioning Base Station Volume Share (%), by Country 2025 & 2033
- Figure 39: Middle East & Africa Uwb Indoor Positioning Base Station Revenue (million), by Application 2025 & 2033
- Figure 40: Middle East & Africa Uwb Indoor Positioning Base Station Volume (K), by Application 2025 & 2033
- Figure 41: Middle East & Africa Uwb Indoor Positioning Base Station Revenue Share (%), by Application 2025 & 2033
- Figure 42: Middle East & Africa Uwb Indoor Positioning Base Station Volume Share (%), by Application 2025 & 2033
- Figure 43: Middle East & Africa Uwb Indoor Positioning Base Station Revenue (million), by Type 2025 & 2033
- Figure 44: Middle East & Africa Uwb Indoor Positioning Base Station Volume (K), by Type 2025 & 2033
- Figure 45: Middle East & Africa Uwb Indoor Positioning Base Station Revenue Share (%), by Type 2025 & 2033
- Figure 46: Middle East & Africa Uwb Indoor Positioning Base Station Volume Share (%), by Type 2025 & 2033
- Figure 47: Middle East & Africa Uwb Indoor Positioning Base Station Revenue (million), by Country 2025 & 2033
- Figure 48: Middle East & Africa Uwb Indoor Positioning Base Station Volume (K), by Country 2025 & 2033
- Figure 49: Middle East & Africa Uwb Indoor Positioning Base Station Revenue Share (%), by Country 2025 & 2033
- Figure 50: Middle East & Africa Uwb Indoor Positioning Base Station Volume Share (%), by Country 2025 & 2033
- Figure 51: Asia Pacific Uwb Indoor Positioning Base Station Revenue (million), by Application 2025 & 2033
- Figure 52: Asia Pacific Uwb Indoor Positioning Base Station Volume (K), by Application 2025 & 2033
- Figure 53: Asia Pacific Uwb Indoor Positioning Base Station Revenue Share (%), by Application 2025 & 2033
- Figure 54: Asia Pacific Uwb Indoor Positioning Base Station Volume Share (%), by Application 2025 & 2033
- Figure 55: Asia Pacific Uwb Indoor Positioning Base Station Revenue (million), by Type 2025 & 2033
- Figure 56: Asia Pacific Uwb Indoor Positioning Base Station Volume (K), by Type 2025 & 2033
- Figure 57: Asia Pacific Uwb Indoor Positioning Base Station Revenue Share (%), by Type 2025 & 2033
- Figure 58: Asia Pacific Uwb Indoor Positioning Base Station Volume Share (%), by Type 2025 & 2033
- Figure 59: Asia Pacific Uwb Indoor Positioning Base Station Revenue (million), by Country 2025 & 2033
- Figure 60: Asia Pacific Uwb Indoor Positioning Base Station Volume (K), by Country 2025 & 2033
- Figure 61: Asia Pacific Uwb Indoor Positioning Base Station Revenue Share (%), by Country 2025 & 2033
- Figure 62: Asia Pacific Uwb Indoor Positioning Base Station Volume Share (%), by Country 2025 & 2033
List of Tables
- Table 1: Global Uwb Indoor Positioning Base Station Revenue million Forecast, by Application 2020 & 2033
- Table 2: Global Uwb Indoor Positioning Base Station Volume K Forecast, by Application 2020 & 2033
- Table 3: Global Uwb Indoor Positioning Base Station Revenue million Forecast, by Type 2020 & 2033
- Table 4: Global Uwb Indoor Positioning Base Station Volume K Forecast, by Type 2020 & 2033
- Table 5: Global Uwb Indoor Positioning Base Station Revenue million Forecast, by Region 2020 & 2033
- Table 6: Global Uwb Indoor Positioning Base Station Volume K Forecast, by Region 2020 & 2033
- Table 7: Global Uwb Indoor Positioning Base Station Revenue million Forecast, by Application 2020 & 2033
- Table 8: Global Uwb Indoor Positioning Base Station Volume K Forecast, by Application 2020 & 2033
- Table 9: Global Uwb Indoor Positioning Base Station Revenue million Forecast, by Type 2020 & 2033
- Table 10: Global Uwb Indoor Positioning Base Station Volume K Forecast, by Type 2020 & 2033
- Table 11: Global Uwb Indoor Positioning Base Station Revenue million Forecast, by Country 2020 & 2033
- Table 12: Global Uwb Indoor Positioning Base Station Volume K Forecast, by Country 2020 & 2033
- Table 13: United States Uwb Indoor Positioning Base Station Revenue (million) Forecast, by Application 2020 & 2033
- Table 14: United States Uwb Indoor Positioning Base Station Volume (K) Forecast, by Application 2020 & 2033
- Table 15: Canada Uwb Indoor Positioning Base Station Revenue (million) Forecast, by Application 2020 & 2033
- Table 16: Canada Uwb Indoor Positioning Base Station Volume (K) Forecast, by Application 2020 & 2033
- Table 17: Mexico Uwb Indoor Positioning Base Station Revenue (million) Forecast, by Application 2020 & 2033
- Table 18: Mexico Uwb Indoor Positioning Base Station Volume (K) Forecast, by Application 2020 & 2033
- Table 19: Global Uwb Indoor Positioning Base Station Revenue million Forecast, by Application 2020 & 2033
- Table 20: Global Uwb Indoor Positioning Base Station Volume K Forecast, by Application 2020 & 2033
- Table 21: Global Uwb Indoor Positioning Base Station Revenue million Forecast, by Type 2020 & 2033
- Table 22: Global Uwb Indoor Positioning Base Station Volume K Forecast, by Type 2020 & 2033
- Table 23: Global Uwb Indoor Positioning Base Station Revenue million Forecast, by Country 2020 & 2033
- Table 24: Global Uwb Indoor Positioning Base Station Volume K Forecast, by Country 2020 & 2033
- Table 25: Brazil Uwb Indoor Positioning Base Station Revenue (million) Forecast, by Application 2020 & 2033
- Table 26: Brazil Uwb Indoor Positioning Base Station Volume (K) Forecast, by Application 2020 & 2033
- Table 27: Argentina Uwb Indoor Positioning Base Station Revenue (million) Forecast, by Application 2020 & 2033
- Table 28: Argentina Uwb Indoor Positioning Base Station Volume (K) Forecast, by Application 2020 & 2033
- Table 29: Rest of South America Uwb Indoor Positioning Base Station Revenue (million) Forecast, by Application 2020 & 2033
- Table 30: Rest of South America Uwb Indoor Positioning Base Station Volume (K) Forecast, by Application 2020 & 2033
- Table 31: Global Uwb Indoor Positioning Base Station Revenue million Forecast, by Application 2020 & 2033
- Table 32: Global Uwb Indoor Positioning Base Station Volume K Forecast, by Application 2020 & 2033
- Table 33: Global Uwb Indoor Positioning Base Station Revenue million Forecast, by Type 2020 & 2033
- Table 34: Global Uwb Indoor Positioning Base Station Volume K Forecast, by Type 2020 & 2033
- Table 35: Global Uwb Indoor Positioning Base Station Revenue million Forecast, by Country 2020 & 2033
- Table 36: Global Uwb Indoor Positioning Base Station Volume K Forecast, by Country 2020 & 2033
- Table 37: United Kingdom Uwb Indoor Positioning Base Station Revenue (million) Forecast, by Application 2020 & 2033
- Table 38: United Kingdom Uwb Indoor Positioning Base Station Volume (K) Forecast, by Application 2020 & 2033
- Table 39: Germany Uwb Indoor Positioning Base Station Revenue (million) Forecast, by Application 2020 & 2033
- Table 40: Germany Uwb Indoor Positioning Base Station Volume (K) Forecast, by Application 2020 & 2033
- Table 41: France Uwb Indoor Positioning Base Station Revenue (million) Forecast, by Application 2020 & 2033
- Table 42: France Uwb Indoor Positioning Base Station Volume (K) Forecast, by Application 2020 & 2033
- Table 43: Italy Uwb Indoor Positioning Base Station Revenue (million) Forecast, by Application 2020 & 2033
- Table 44: Italy Uwb Indoor Positioning Base Station Volume (K) Forecast, by Application 2020 & 2033
- Table 45: Spain Uwb Indoor Positioning Base Station Revenue (million) Forecast, by Application 2020 & 2033
- Table 46: Spain Uwb Indoor Positioning Base Station Volume (K) Forecast, by Application 2020 & 2033
- Table 47: Russia Uwb Indoor Positioning Base Station Revenue (million) Forecast, by Application 2020 & 2033
- Table 48: Russia Uwb Indoor Positioning Base Station Volume (K) Forecast, by Application 2020 & 2033
- Table 49: Benelux Uwb Indoor Positioning Base Station Revenue (million) Forecast, by Application 2020 & 2033
- Table 50: Benelux Uwb Indoor Positioning Base Station Volume (K) Forecast, by Application 2020 & 2033
- Table 51: Nordics Uwb Indoor Positioning Base Station Revenue (million) Forecast, by Application 2020 & 2033
- Table 52: Nordics Uwb Indoor Positioning Base Station Volume (K) Forecast, by Application 2020 & 2033
- Table 53: Rest of Europe Uwb Indoor Positioning Base Station Revenue (million) Forecast, by Application 2020 & 2033
- Table 54: Rest of Europe Uwb Indoor Positioning Base Station Volume (K) Forecast, by Application 2020 & 2033
- Table 55: Global Uwb Indoor Positioning Base Station Revenue million Forecast, by Application 2020 & 2033
- Table 56: Global Uwb Indoor Positioning Base Station Volume K Forecast, by Application 2020 & 2033
- Table 57: Global Uwb Indoor Positioning Base Station Revenue million Forecast, by Type 2020 & 2033
- Table 58: Global Uwb Indoor Positioning Base Station Volume K Forecast, by Type 2020 & 2033
- Table 59: Global Uwb Indoor Positioning Base Station Revenue million Forecast, by Country 2020 & 2033
- Table 60: Global Uwb Indoor Positioning Base Station Volume K Forecast, by Country 2020 & 2033
- Table 61: Turkey Uwb Indoor Positioning Base Station Revenue (million) Forecast, by Application 2020 & 2033
- Table 62: Turkey Uwb Indoor Positioning Base Station Volume (K) Forecast, by Application 2020 & 2033
- Table 63: Israel Uwb Indoor Positioning Base Station Revenue (million) Forecast, by Application 2020 & 2033
- Table 64: Israel Uwb Indoor Positioning Base Station Volume (K) Forecast, by Application 2020 & 2033
- Table 65: GCC Uwb Indoor Positioning Base Station Revenue (million) Forecast, by Application 2020 & 2033
- Table 66: GCC Uwb Indoor Positioning Base Station Volume (K) Forecast, by Application 2020 & 2033
- Table 67: North Africa Uwb Indoor Positioning Base Station Revenue (million) Forecast, by Application 2020 & 2033
- Table 68: North Africa Uwb Indoor Positioning Base Station Volume (K) Forecast, by Application 2020 & 2033
- Table 69: South Africa Uwb Indoor Positioning Base Station Revenue (million) Forecast, by Application 2020 & 2033
- Table 70: South Africa Uwb Indoor Positioning Base Station Volume (K) Forecast, by Application 2020 & 2033
- Table 71: Rest of Middle East & Africa Uwb Indoor Positioning Base Station Revenue (million) Forecast, by Application 2020 & 2033
- Table 72: Rest of Middle East & Africa Uwb Indoor Positioning Base Station Volume (K) Forecast, by Application 2020 & 2033
- Table 73: Global Uwb Indoor Positioning Base Station Revenue million Forecast, by Application 2020 & 2033
- Table 74: Global Uwb Indoor Positioning Base Station Volume K Forecast, by Application 2020 & 2033
- Table 75: Global Uwb Indoor Positioning Base Station Revenue million Forecast, by Type 2020 & 2033
- Table 76: Global Uwb Indoor Positioning Base Station Volume K Forecast, by Type 2020 & 2033
- Table 77: Global Uwb Indoor Positioning Base Station Revenue million Forecast, by Country 2020 & 2033
- Table 78: Global Uwb Indoor Positioning Base Station Volume K Forecast, by Country 2020 & 2033
- Table 79: China Uwb Indoor Positioning Base Station Revenue (million) Forecast, by Application 2020 & 2033
- Table 80: China Uwb Indoor Positioning Base Station Volume (K) Forecast, by Application 2020 & 2033
- Table 81: India Uwb Indoor Positioning Base Station Revenue (million) Forecast, by Application 2020 & 2033
- Table 82: India Uwb Indoor Positioning Base Station Volume (K) Forecast, by Application 2020 & 2033
- Table 83: Japan Uwb Indoor Positioning Base Station Revenue (million) Forecast, by Application 2020 & 2033
- Table 84: Japan Uwb Indoor Positioning Base Station Volume (K) Forecast, by Application 2020 & 2033
- Table 85: South Korea Uwb Indoor Positioning Base Station Revenue (million) Forecast, by Application 2020 & 2033
- Table 86: South Korea Uwb Indoor Positioning Base Station Volume (K) Forecast, by Application 2020 & 2033
- Table 87: ASEAN Uwb Indoor Positioning Base Station Revenue (million) Forecast, by Application 2020 & 2033
- Table 88: ASEAN Uwb Indoor Positioning Base Station Volume (K) Forecast, by Application 2020 & 2033
- Table 89: Oceania Uwb Indoor Positioning Base Station Revenue (million) Forecast, by Application 2020 & 2033
- Table 90: Oceania Uwb Indoor Positioning Base Station Volume (K) Forecast, by Application 2020 & 2033
- Table 91: Rest of Asia Pacific Uwb Indoor Positioning Base Station Revenue (million) Forecast, by Application 2020 & 2033
- Table 92: Rest of Asia Pacific Uwb Indoor Positioning Base Station Volume (K) Forecast, by Application 2020 & 2033
Frequently Asked Questions
1. What is the projected Compound Annual Growth Rate (CAGR) of the Uwb Indoor Positioning Base Station?
The projected CAGR is approximately XXX%.
2. Which companies are prominent players in the Uwb Indoor Positioning Base Station?
Key companies in the market include QBS System, Iiwari, Shanghai Renwei Electronics Technology, Megastek Technologies, 95Power Information Technology, Zhengzhou Locaris, Shenzhen Ruizhong, Wellnode.
3. What are the main segments of the Uwb Indoor Positioning Base Station?
The market segments include Application, Type.
4. Can you provide details about the market size?
The market size is estimated to be USD XXX million as of 2022.
5. What are some drivers contributing to market growth?
N/A
6. What are the notable trends driving market growth?
N/A
7. Are there any restraints impacting market growth?
N/A
8. Can you provide examples of recent developments in the market?
N/A
9. What pricing options are available for accessing the report?
Pricing options include single-user, multi-user, and enterprise licenses priced at USD 3950.00, USD 5925.00, and USD 7900.00 respectively.
10. Is the market size provided in terms of value or volume?
The market size is provided in terms of value, measured in million and volume, measured in K.
11. Are there any specific market keywords associated with the report?
Yes, the market keyword associated with the report is "Uwb Indoor Positioning Base Station," which aids in identifying and referencing the specific market segment covered.
12. How do I determine which pricing option suits my needs best?
The pricing options vary based on user requirements and access needs. Individual users may opt for single-user licenses, while businesses requiring broader access may choose multi-user or enterprise licenses for cost-effective access to the report.
13. Are there any additional resources or data provided in the Uwb Indoor Positioning Base Station report?
While the report offers comprehensive insights, it's advisable to review the specific contents or supplementary materials provided to ascertain if additional resources or data are available.
14. How can I stay updated on further developments or reports in the Uwb Indoor Positioning Base Station?
To stay informed about further developments, trends, and reports in the Uwb Indoor Positioning Base Station, consider subscribing to industry newsletters, following relevant companies and organizations, or regularly checking reputable industry news sources and publications.
Methodology
Step 1 - Identification of Relevant Samples Size from Population Database


Step 2 - Approaches for Defining Global Market Size (Value, Volume* & Price*)

Note*: In applicable scenarios
Step 3 - Data Sources
Primary Research
- Web Analytics
- Survey Reports
- Research Institute
- Latest Research Reports
- Opinion Leaders
Secondary Research
- Annual Reports
- White Paper
- Latest Press Release
- Industry Association
- Paid Database
- Investor Presentations

Step 4 - Data Triangulation
Involves using different sources of information in order to increase the validity of a study
These sources are likely to be stakeholders in a program - participants, other researchers, program staff, other community members, and so on.
Then we put all data in single framework & apply various statistical tools to find out the dynamic on the market.
During the analysis stage, feedback from the stakeholder groups would be compared to determine areas of agreement as well as areas of divergence