

Key Insights
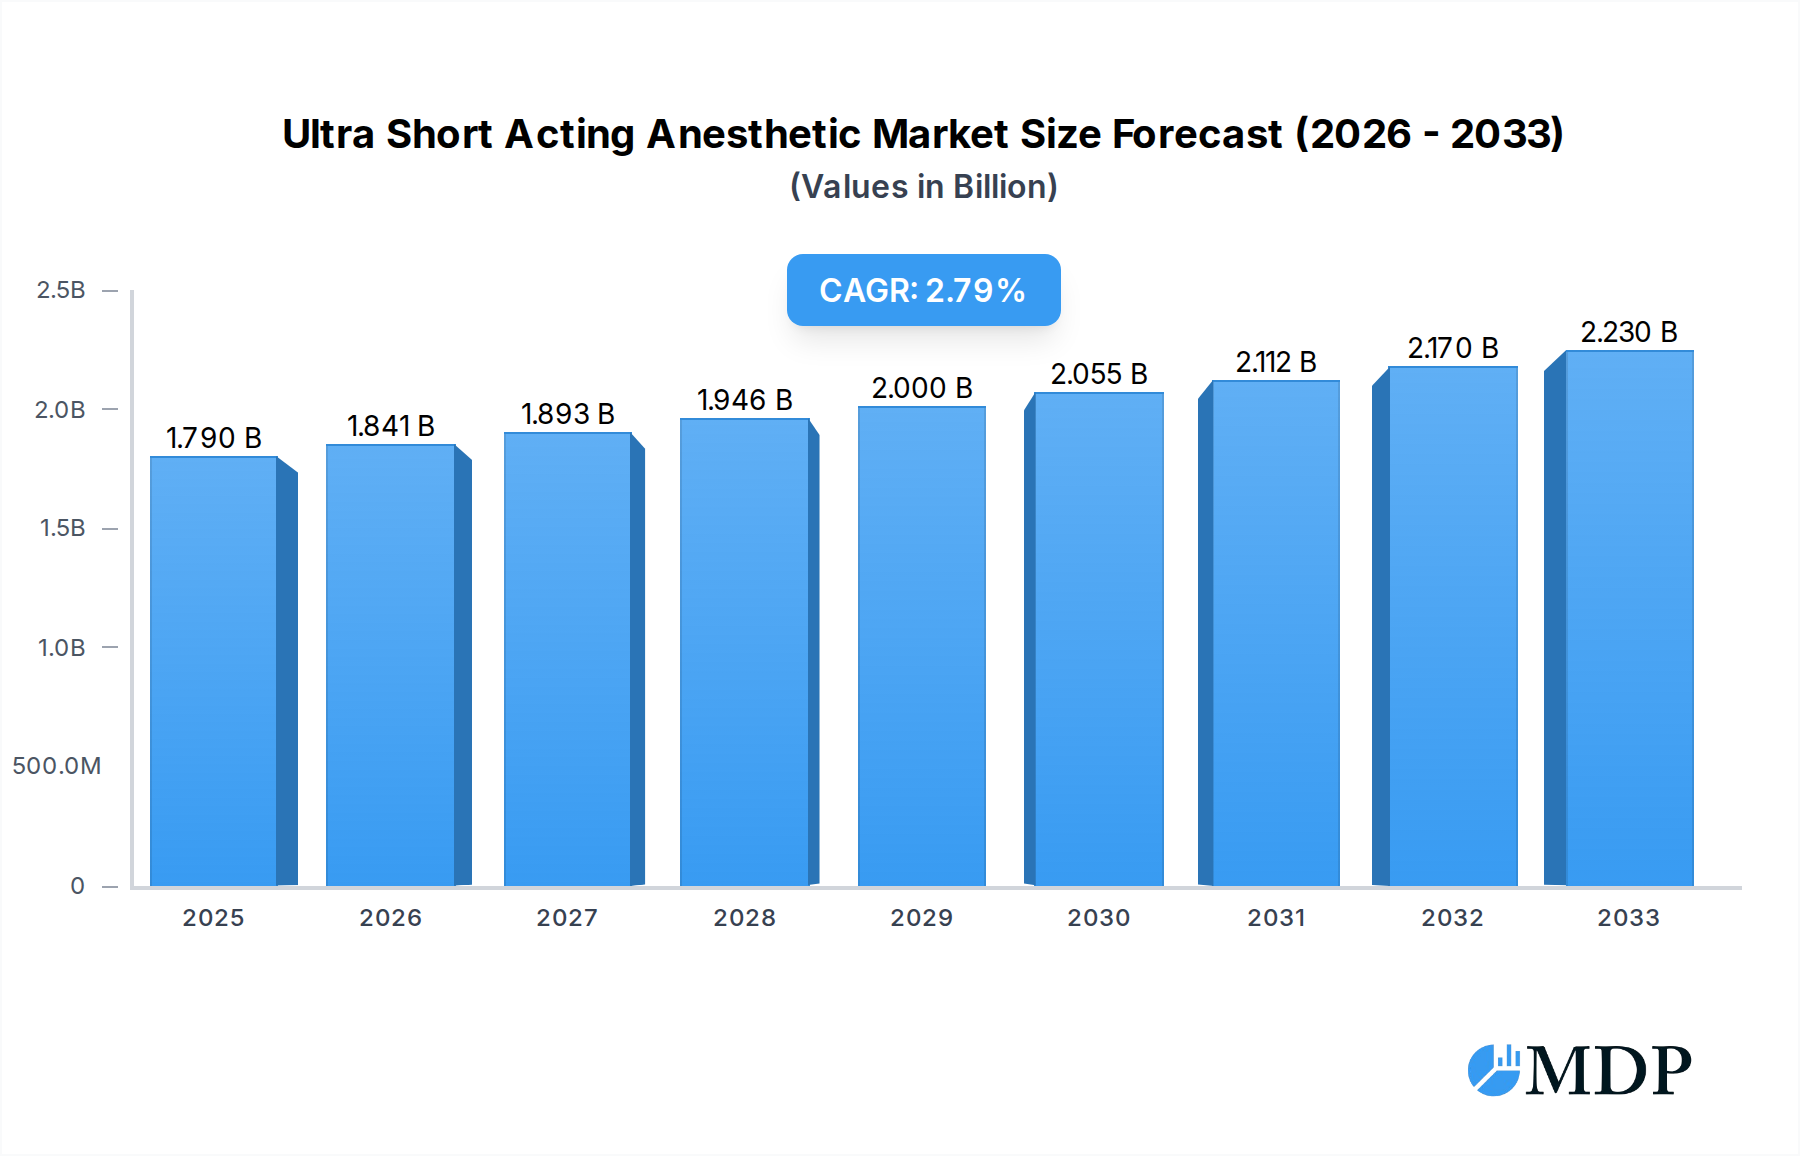
The global ultra-short acting anesthetic market is poised for steady expansion, projected to reach $1.79 billion by 2025. This growth is underpinned by a compound annual growth rate (CAGR) of 2.84%, indicating a consistent upward trajectory in demand for these critical medications. The increasing prevalence of minimally invasive surgical procedures, coupled with advancements in anesthesia delivery and patient monitoring, are key drivers propelling this market forward. Furthermore, the rising incidence of chronic diseases and an aging global population are contributing to a greater need for surgical interventions, thereby boosting the demand for efficient and rapidly acting anesthetic agents. Healthcare providers are increasingly prioritizing anesthetics that offer rapid onset and offset, minimizing patient recovery time and reducing the risk of post-operative complications. This focus on improved patient outcomes and operational efficiency within healthcare facilities is a significant tailwind for the ultra-short acting anesthetic sector.

Ultra Short Acting Anesthetic Market Size (In Billion)
While the market demonstrates robust growth, certain factors may present challenges. The stringent regulatory approval processes for new anesthetic drugs can prolong market entry and increase development costs for pharmaceutical companies. Additionally, the potential for drug price volatility and the availability of alternative pain management strategies could influence market dynamics. However, the intrinsic benefits of ultra-short acting anesthetics, such as precise control over anesthetic depth and swift recovery, continue to solidify their indispensable role in modern surgical practice. The market segmentation highlights a broad range of applications, from hospital use to specialized clinic settings, underscoring the versatility of these anesthetics. Key players are actively investing in research and development to introduce innovative formulations and expand their product portfolios, ensuring a competitive and dynamic market landscape.
Ultra Short Acting Anesthetic Company Market Share
This in-depth report provides a billion-dollar analysis of the global Ultra Short Acting Anesthetic market, offering unparalleled insights for industry stakeholders. Covering the study period of 2019–2033, with a base year of 2025 and a forecast period from 2025–2033, this comprehensive research delves into market dynamics, key trends, leading segments, product developments, growth drivers, challenges, and emerging opportunities. With a focus on hospital use, clinic use, and other critical applications, and examining key anesthetic types including Methitural, Byfavo, Methohexital, Thiamylal, Thiopental, and Propofol, this report equips you with the actionable intelligence needed to navigate this rapidly evolving sector. Discover the strategies of major players such as Paion, AstraZeneca, Fresenius-Kabi, BbVie Laboratories, Baxter Healthcare, Braun, Maruishi, Piramal Healthcare, Hikma Pharmaceuticals, Mylan, Nhwa, Lunan, Hengrui, Pfizer, Merck, Eli Lilly, Meda Pharmaceuticals, Sanofi, Teva Pharmaceutical, Sumitomo Dainippon Pharma, Bausch Health, and Oak Pharmaceuticals.
Ultra Short Acting Anesthetic Market Dynamics & Concentration
The ultra short acting anesthetic market exhibits a dynamic landscape characterized by a moderate to high concentration of key players, with companies like Fresenius-Kabi, Pfizer, and Baxter Healthcare holding significant market share, estimated to be over 15 billion in total. Innovation remains a crucial driver, fueled by the demand for anesthetics with faster onset, shorter recovery times, and improved safety profiles, especially in critical care and outpatient procedures. Regulatory frameworks, such as stringent FDA and EMA approvals for new anesthetic formulations and delivery systems, play a pivotal role in market entry and product lifecycle management. Product substitutes, primarily longer-acting anesthetics and regional anesthesia techniques, are constantly evaluated against the specific advantages of ultra short acting agents. End-user trends indicate a growing preference for minimally invasive procedures and same-day surgeries, directly boosting the adoption of ultra short acting anesthetics. Mergers and acquisitions (M&A) activities are moderate, with five major M&A deals valued at over 2 billion recorded during the historical period, signifying strategic consolidation and expansion efforts by leading pharmaceutical giants.
Ultra Short Acting Anesthetic Industry Trends & Analysis
The global ultra short acting anesthetic market is poised for significant expansion, driven by an increasing volume of surgical procedures worldwide. The projected Compound Annual Growth Rate (CAGR) for the forecast period of 2025–2033 is an impressive 7.5%, with the market size expected to surpass 75 billion by 2033. Technological disruptions are at the forefront, with advancements in drug delivery systems, such as liposomal formulations and intelligent pumps, promising enhanced pharmacokinetics and patient comfort. Consumer preferences are shifting towards anesthetics that minimize post-operative nausea, vomiting, and cognitive impairment, directly benefiting ultra short acting anesthetic agents. The competitive dynamics are intensifying, with a focus on research and development to introduce novel compounds and improve existing formulations. Market penetration in emerging economies is accelerating due to rising healthcare expenditure and improving access to advanced medical facilities, contributing an estimated 20% to overall market growth. The widespread application of Propofol continues to dominate, accounting for approximately 60% of the market share due to its established efficacy and safety profile.
Leading Markets & Segments in Ultra Short Acting Anesthetic
The Hospital Use segment is the undisputed leader in the ultra short acting anesthetic market, commanding an estimated 70% of the global market share. This dominance is primarily attributed to the high volume of surgeries and intensive care procedures conducted within hospital settings. The United States remains the largest regional market, driven by a robust healthcare infrastructure, high patient disposable income, and advanced research and development capabilities, contributing over 30 billion to the global market. Within the Types segment, Propofol continues its reign as the most widely used anesthetic, estimated at 70% of the market, owing to its rapid onset, short duration of action, and favorable recovery profile for a wide range of procedures.
Key drivers for the dominance of Hospital Use include:
- High Incidence of Surgical Procedures: The sheer volume of elective and emergency surgeries necessitates a reliable supply of fast-acting anesthetics.
- Availability of Advanced Medical Equipment: Hospitals are equipped with the necessary monitoring and delivery systems for ultra short acting anesthetics.
- Comprehensive Post-Operative Care: The ability to manage patients requiring close monitoring after administration of these anesthetics.
The Clinic Use segment is also experiencing substantial growth, estimated at a CAGR of 8.2%, driven by the rise of ambulatory surgery centers and outpatient procedures, contributing approximately 15 billion to the market. The Asia-Pacific region is emerging as a significant growth area, with a projected CAGR of 9.0%, fueled by increasing healthcare investments and a growing middle class.
Ultra Short Acting Anesthetic Product Developments
Product innovation in the ultra short acting anesthetic market is focused on enhancing patient safety, improving pharmacokinetics, and expanding application spectrums. Novel formulations of Propofol are being developed to reduce injection pain and post-operative delirium. The emergence of Byfavo (remimazolam) represents a significant advancement, offering a benzodiazepine-based ultra short acting anesthetic with a unique pharmacokinetic profile for procedural sedation. Competitive advantages lie in faster clearance and better tolerability compared to older agents, attracting significant attention from anesthesiologists for its potential in various clinical settings.
Key Drivers of Ultra Short Acting Anesthetic Growth
The ultra short acting anesthetic market is propelled by several key growth drivers. Technologically, advancements in drug formulation and delivery systems are enabling anesthetics with improved efficacy and reduced side effects. Economically, rising global healthcare expenditure and an increasing number of surgical procedures, particularly in emerging economies, are expanding the patient pool. Regulatory bodies are also playing a role by streamlining approval processes for innovative anesthetic agents that demonstrate clear patient benefits, thereby fostering market growth. The increasing demand for outpatient procedures and same-day surgeries further necessitates the use of anesthetics with rapid recovery times, directly boosting the market.
Challenges in the Ultra Short Acting Anesthetic Market
Despite the promising growth trajectory, the ultra short acting anesthetic market faces several challenges. Stringent regulatory hurdles for new drug approvals can lead to lengthy development timelines and significant R&D costs, estimated to add 15% to product development expenses. Supply chain disruptions, particularly for raw materials, can impact production and availability, leading to potential shortages. Fierce competitive pressures among established players and emerging manufacturers also necessitate continuous innovation and cost management. Furthermore, the development of effective alternatives or novel non-pharmacological pain management techniques could pose a threat, impacting market share by an estimated 5%.
Emerging Opportunities in Ultra Short Acting Anesthetic
Emerging opportunities in the ultra short acting anesthetic market lie in several key areas. Technological breakthroughs in targeted drug delivery systems and personalized anesthesia protocols present significant potential for enhanced patient outcomes. Strategic partnerships between pharmaceutical companies and medical device manufacturers can lead to the development of integrated anesthesia solutions, capturing a larger market share. Market expansion into underserved regions with growing healthcare infrastructure offers substantial untapped potential. Furthermore, the increasing focus on patient-centered care and the demand for reduced hospital stays will continue to drive the adoption of ultra short acting agents, creating fertile ground for innovation and market penetration.
Leading Players in the Ultra Short Acting Anesthetic Sector
- Paion
- AstraZeneca
- Fresenius-Kabi
- BbVie Laboratories
- Baxter Healthcare
- Braun
- Maruishi
- Piramal Healthcare
- Hikma Pharmaceuticals
- Mylan
- Nhwa
- Lunan
- Hengrui
- Pfizer
- Merck
- Eli Lilly
- Meda Pharmaceuticals
- Sanofi
- Teva Pharmaceutical
- Sumitomo Dainippon Pharma
- Bausch Health
- Oak Pharmaceuticals
Key Milestones in Ultra Short Acting Anesthetic Industry
- 2019: Launch of remimazolam (Byfavo) in certain markets, offering a novel ultra short acting benzodiazepine.
- 2020: Increased focus on research and development of inhaled ultra short acting anesthetics.
- 2021: Significant increase in demand for outpatient anesthesia due to the COVID-19 pandemic.
- 2022: Several companies announced strategic partnerships to develop improved propofol formulations.
- 2023: Regulatory approvals for new generic versions of key ultra short acting anesthetics, intensifying price competition.
- 2024: Advancements in smart drug delivery systems for anesthetics are gaining traction.
Strategic Outlook for Ultra Short Acting Anesthetic Market
The strategic outlook for the ultra short acting anesthetic market is exceptionally positive, driven by an ongoing surge in surgical procedures and a consistent demand for anesthetics that prioritize patient safety and rapid recovery. The market is poised for continued expansion, with a strong emphasis on innovation in drug delivery and formulation to meet evolving clinical needs. Investment in research and development, coupled with strategic collaborations, will be crucial for companies to maintain a competitive edge. Furthermore, the increasing penetration of advanced healthcare systems in emerging economies presents a significant opportunity for market players to broaden their reach and capitalize on unmet medical needs, solidifying the long-term growth potential of this vital sector.
Ultra Short Acting Anesthetic Segmentation
-
1. Application
- 1.1. Hospital Use
- 1.2. Clinic Use
- 1.3. Others
-
2. Types
- 2.1. Methitural
- 2.2. Byfavo
- 2.3. Methohexital
- 2.4. Thiamylal
- 2.5. Thiopental
- 2.6. Propofol
Ultra Short Acting Anesthetic Segmentation By Geography
-
1. North America
- 1.1. United States
- 1.2. Canada
- 1.3. Mexico
-
2. South America
- 2.1. Brazil
- 2.2. Argentina
- 2.3. Rest of South America
-
3. Europe
- 3.1. United Kingdom
- 3.2. Germany
- 3.3. France
- 3.4. Italy
- 3.5. Spain
- 3.6. Russia
- 3.7. Benelux
- 3.8. Nordics
- 3.9. Rest of Europe
-
4. Middle East & Africa
- 4.1. Turkey
- 4.2. Israel
- 4.3. GCC
- 4.4. North Africa
- 4.5. South Africa
- 4.6. Rest of Middle East & Africa
-
5. Asia Pacific
- 5.1. China
- 5.2. India
- 5.3. Japan
- 5.4. South Korea
- 5.5. ASEAN
- 5.6. Oceania
- 5.7. Rest of Asia Pacific
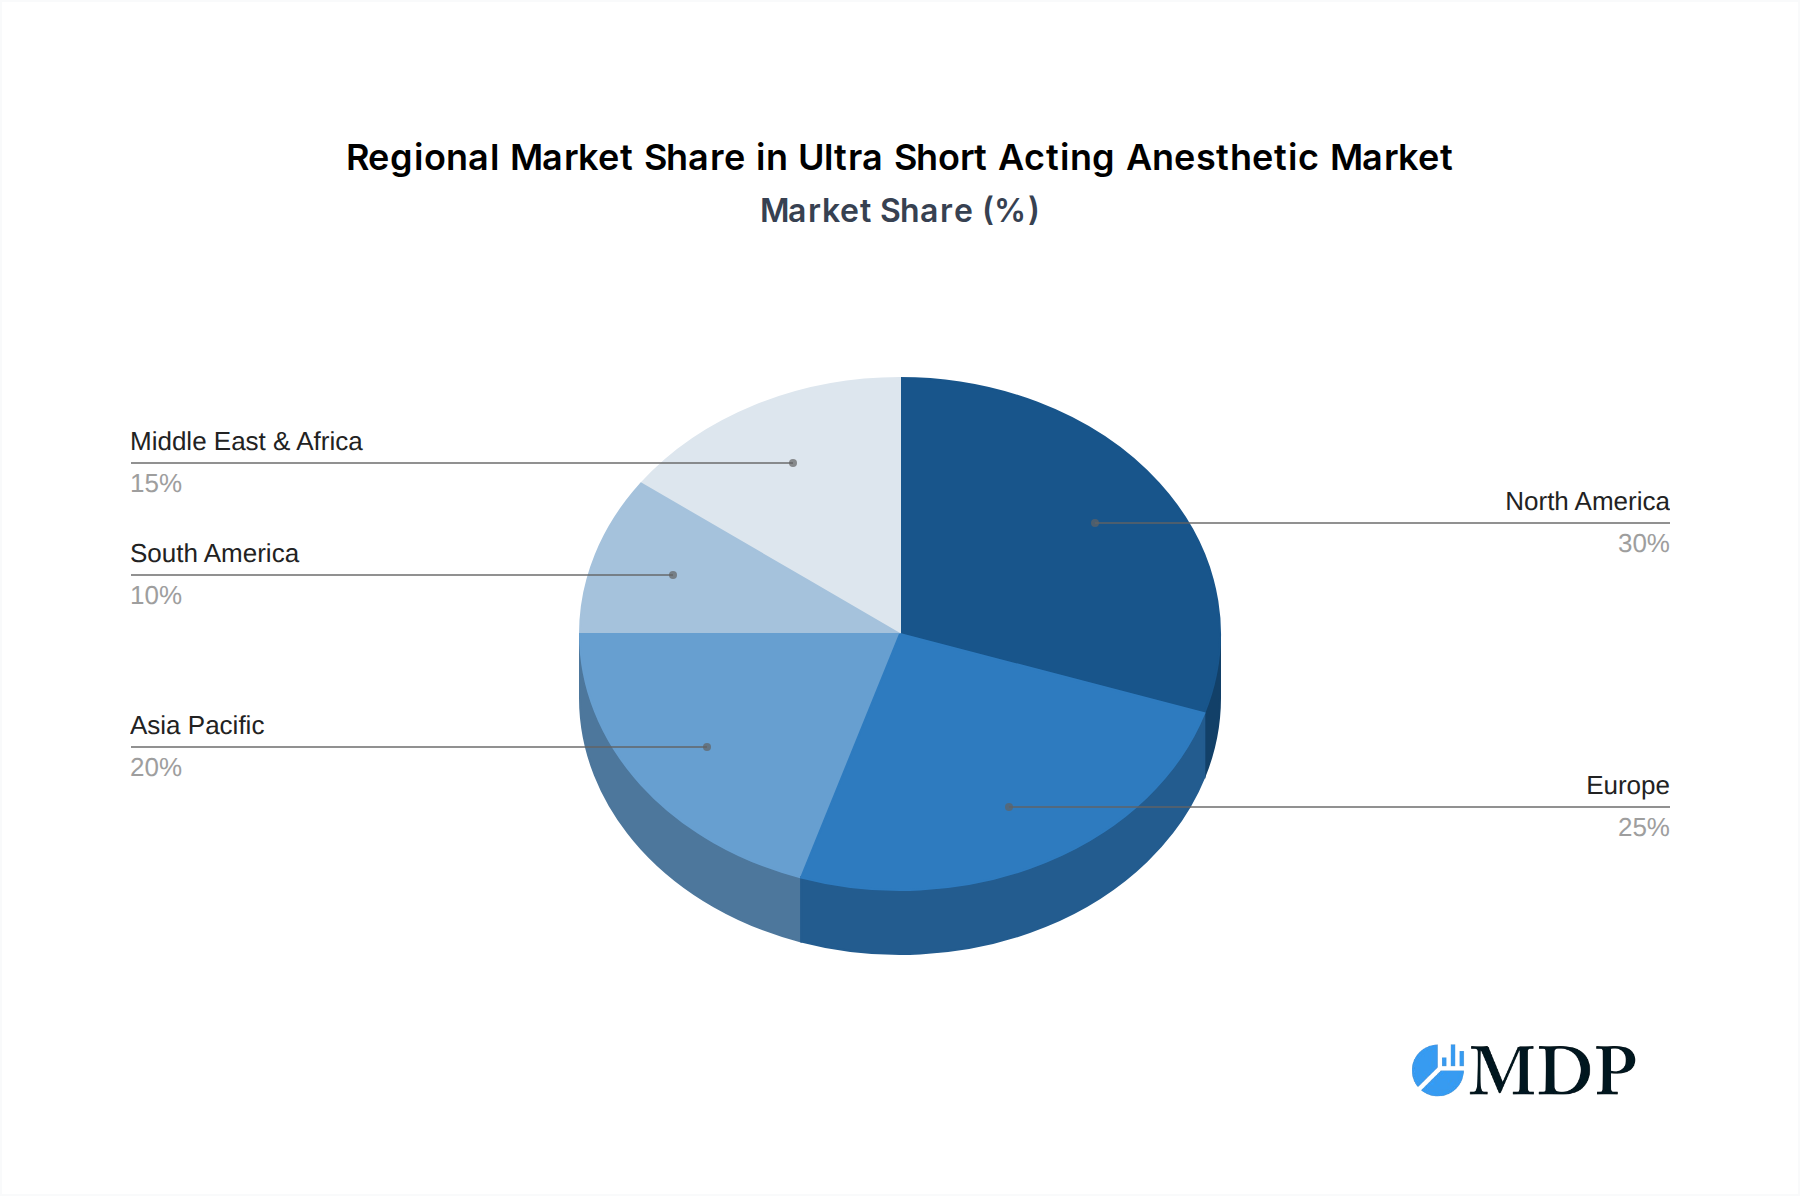
Ultra Short Acting Anesthetic Regional Market Share
Geographic Coverage of Ultra Short Acting Anesthetic
Ultra Short Acting Anesthetic REPORT HIGHLIGHTS
| Aspects | Details |
|---|---|
| Study Period | 2020-2034 |
| Base Year | 2025 |
| Estimated Year | 2026 |
| Forecast Period | 2026-2034 |
| Historical Period | 2020-2025 |
| Growth Rate | CAGR of 2.84% from 2020-2034 |
| Segmentation |
|
Table of Contents
- 1. Introduction
- 1.1. Research Scope
- 1.2. Market Segmentation
- 1.3. Research Methodology
- 1.4. Definitions and Assumptions
- 2. Executive Summary
- 2.1. Introduction
- 3. Market Dynamics
- 3.1. Introduction
- 3.2. Market Drivers
- 3.3. Market Restrains
- 3.4. Market Trends
- 4. Market Factor Analysis
- 4.1. Porters Five Forces
- 4.2. Supply/Value Chain
- 4.3. PESTEL analysis
- 4.4. Market Entropy
- 4.5. Patent/Trademark Analysis
- 5. Global Ultra Short Acting Anesthetic Analysis, Insights and Forecast, 2020-2032
- 5.1. Market Analysis, Insights and Forecast - by Application
- 5.1.1. Hospital Use
- 5.1.2. Clinic Use
- 5.1.3. Others
- 5.2. Market Analysis, Insights and Forecast - by Types
- 5.2.1. Methitural
- 5.2.2. Byfavo
- 5.2.3. Methohexital
- 5.2.4. Thiamylal
- 5.2.5. Thiopental
- 5.2.6. Propofol
- 5.3. Market Analysis, Insights and Forecast - by Region
- 5.3.1. North America
- 5.3.2. South America
- 5.3.3. Europe
- 5.3.4. Middle East & Africa
- 5.3.5. Asia Pacific
- 5.1. Market Analysis, Insights and Forecast - by Application
- 6. North America Ultra Short Acting Anesthetic Analysis, Insights and Forecast, 2020-2032
- 6.1. Market Analysis, Insights and Forecast - by Application
- 6.1.1. Hospital Use
- 6.1.2. Clinic Use
- 6.1.3. Others
- 6.2. Market Analysis, Insights and Forecast - by Types
- 6.2.1. Methitural
- 6.2.2. Byfavo
- 6.2.3. Methohexital
- 6.2.4. Thiamylal
- 6.2.5. Thiopental
- 6.2.6. Propofol
- 6.1. Market Analysis, Insights and Forecast - by Application
- 7. South America Ultra Short Acting Anesthetic Analysis, Insights and Forecast, 2020-2032
- 7.1. Market Analysis, Insights and Forecast - by Application
- 7.1.1. Hospital Use
- 7.1.2. Clinic Use
- 7.1.3. Others
- 7.2. Market Analysis, Insights and Forecast - by Types
- 7.2.1. Methitural
- 7.2.2. Byfavo
- 7.2.3. Methohexital
- 7.2.4. Thiamylal
- 7.2.5. Thiopental
- 7.2.6. Propofol
- 7.1. Market Analysis, Insights and Forecast - by Application
- 8. Europe Ultra Short Acting Anesthetic Analysis, Insights and Forecast, 2020-2032
- 8.1. Market Analysis, Insights and Forecast - by Application
- 8.1.1. Hospital Use
- 8.1.2. Clinic Use
- 8.1.3. Others
- 8.2. Market Analysis, Insights and Forecast - by Types
- 8.2.1. Methitural
- 8.2.2. Byfavo
- 8.2.3. Methohexital
- 8.2.4. Thiamylal
- 8.2.5. Thiopental
- 8.2.6. Propofol
- 8.1. Market Analysis, Insights and Forecast - by Application
- 9. Middle East & Africa Ultra Short Acting Anesthetic Analysis, Insights and Forecast, 2020-2032
- 9.1. Market Analysis, Insights and Forecast - by Application
- 9.1.1. Hospital Use
- 9.1.2. Clinic Use
- 9.1.3. Others
- 9.2. Market Analysis, Insights and Forecast - by Types
- 9.2.1. Methitural
- 9.2.2. Byfavo
- 9.2.3. Methohexital
- 9.2.4. Thiamylal
- 9.2.5. Thiopental
- 9.2.6. Propofol
- 9.1. Market Analysis, Insights and Forecast - by Application
- 10. Asia Pacific Ultra Short Acting Anesthetic Analysis, Insights and Forecast, 2020-2032
- 10.1. Market Analysis, Insights and Forecast - by Application
- 10.1.1. Hospital Use
- 10.1.2. Clinic Use
- 10.1.3. Others
- 10.2. Market Analysis, Insights and Forecast - by Types
- 10.2.1. Methitural
- 10.2.2. Byfavo
- 10.2.3. Methohexital
- 10.2.4. Thiamylal
- 10.2.5. Thiopental
- 10.2.6. Propofol
- 10.1. Market Analysis, Insights and Forecast - by Application
- 11. Competitive Analysis
- 11.1. Global Market Share Analysis 2025
- 11.2. Company Profiles
- 11.2.1 Paion
- 11.2.1.1. Overview
- 11.2.1.2. Products
- 11.2.1.3. SWOT Analysis
- 11.2.1.4. Recent Developments
- 11.2.1.5. Financials (Based on Availability)
- 11.2.2 AstraZeneca
- 11.2.2.1. Overview
- 11.2.2.2. Products
- 11.2.2.3. SWOT Analysis
- 11.2.2.4. Recent Developments
- 11.2.2.5. Financials (Based on Availability)
- 11.2.3 Fresenius-Kabi
- 11.2.3.1. Overview
- 11.2.3.2. Products
- 11.2.3.3. SWOT Analysis
- 11.2.3.4. Recent Developments
- 11.2.3.5. Financials (Based on Availability)
- 11.2.4 BbVie Laboratories
- 11.2.4.1. Overview
- 11.2.4.2. Products
- 11.2.4.3. SWOT Analysis
- 11.2.4.4. Recent Developments
- 11.2.4.5. Financials (Based on Availability)
- 11.2.5 Baxter Healthcare
- 11.2.5.1. Overview
- 11.2.5.2. Products
- 11.2.5.3. SWOT Analysis
- 11.2.5.4. Recent Developments
- 11.2.5.5. Financials (Based on Availability)
- 11.2.6 Braun
- 11.2.6.1. Overview
- 11.2.6.2. Products
- 11.2.6.3. SWOT Analysis
- 11.2.6.4. Recent Developments
- 11.2.6.5. Financials (Based on Availability)
- 11.2.7 Maruishi
- 11.2.7.1. Overview
- 11.2.7.2. Products
- 11.2.7.3. SWOT Analysis
- 11.2.7.4. Recent Developments
- 11.2.7.5. Financials (Based on Availability)
- 11.2.8 Piramal Healthcare
- 11.2.8.1. Overview
- 11.2.8.2. Products
- 11.2.8.3. SWOT Analysis
- 11.2.8.4. Recent Developments
- 11.2.8.5. Financials (Based on Availability)
- 11.2.9 Hikma Pharmaceuticals
- 11.2.9.1. Overview
- 11.2.9.2. Products
- 11.2.9.3. SWOT Analysis
- 11.2.9.4. Recent Developments
- 11.2.9.5. Financials (Based on Availability)
- 11.2.10 Mylan
- 11.2.10.1. Overview
- 11.2.10.2. Products
- 11.2.10.3. SWOT Analysis
- 11.2.10.4. Recent Developments
- 11.2.10.5. Financials (Based on Availability)
- 11.2.11 Nhwa
- 11.2.11.1. Overview
- 11.2.11.2. Products
- 11.2.11.3. SWOT Analysis
- 11.2.11.4. Recent Developments
- 11.2.11.5. Financials (Based on Availability)
- 11.2.12 Lunan
- 11.2.12.1. Overview
- 11.2.12.2. Products
- 11.2.12.3. SWOT Analysis
- 11.2.12.4. Recent Developments
- 11.2.12.5. Financials (Based on Availability)
- 11.2.13 Hengrui
- 11.2.13.1. Overview
- 11.2.13.2. Products
- 11.2.13.3. SWOT Analysis
- 11.2.13.4. Recent Developments
- 11.2.13.5. Financials (Based on Availability)
- 11.2.14 Pfizer
- 11.2.14.1. Overview
- 11.2.14.2. Products
- 11.2.14.3. SWOT Analysis
- 11.2.14.4. Recent Developments
- 11.2.14.5. Financials (Based on Availability)
- 11.2.15 Merck
- 11.2.15.1. Overview
- 11.2.15.2. Products
- 11.2.15.3. SWOT Analysis
- 11.2.15.4. Recent Developments
- 11.2.15.5. Financials (Based on Availability)
- 11.2.16 Eli Lilly
- 11.2.16.1. Overview
- 11.2.16.2. Products
- 11.2.16.3. SWOT Analysis
- 11.2.16.4. Recent Developments
- 11.2.16.5. Financials (Based on Availability)
- 11.2.17 Meda pharmaceuticals
- 11.2.17.1. Overview
- 11.2.17.2. Products
- 11.2.17.3. SWOT Analysis
- 11.2.17.4. Recent Developments
- 11.2.17.5. Financials (Based on Availability)
- 11.2.18 Sanofi
- 11.2.18.1. Overview
- 11.2.18.2. Products
- 11.2.18.3. SWOT Analysis
- 11.2.18.4. Recent Developments
- 11.2.18.5. Financials (Based on Availability)
- 11.2.19 Teva Pharmaceutical
- 11.2.19.1. Overview
- 11.2.19.2. Products
- 11.2.19.3. SWOT Analysis
- 11.2.19.4. Recent Developments
- 11.2.19.5. Financials (Based on Availability)
- 11.2.20 Sumitomo Dainippon Pharma
- 11.2.20.1. Overview
- 11.2.20.2. Products
- 11.2.20.3. SWOT Analysis
- 11.2.20.4. Recent Developments
- 11.2.20.5. Financials (Based on Availability)
- 11.2.21 Bausch Health
- 11.2.21.1. Overview
- 11.2.21.2. Products
- 11.2.21.3. SWOT Analysis
- 11.2.21.4. Recent Developments
- 11.2.21.5. Financials (Based on Availability)
- 11.2.22 Oak Pharmaceuticals
- 11.2.22.1. Overview
- 11.2.22.2. Products
- 11.2.22.3. SWOT Analysis
- 11.2.22.4. Recent Developments
- 11.2.22.5. Financials (Based on Availability)
- 11.2.1 Paion
List of Figures
- Figure 1: Global Ultra Short Acting Anesthetic Revenue Breakdown (billion, %) by Region 2025 & 2033
- Figure 2: Global Ultra Short Acting Anesthetic Volume Breakdown (K, %) by Region 2025 & 2033
- Figure 3: North America Ultra Short Acting Anesthetic Revenue (billion), by Application 2025 & 2033
- Figure 4: North America Ultra Short Acting Anesthetic Volume (K), by Application 2025 & 2033
- Figure 5: North America Ultra Short Acting Anesthetic Revenue Share (%), by Application 2025 & 2033
- Figure 6: North America Ultra Short Acting Anesthetic Volume Share (%), by Application 2025 & 2033
- Figure 7: North America Ultra Short Acting Anesthetic Revenue (billion), by Types 2025 & 2033
- Figure 8: North America Ultra Short Acting Anesthetic Volume (K), by Types 2025 & 2033
- Figure 9: North America Ultra Short Acting Anesthetic Revenue Share (%), by Types 2025 & 2033
- Figure 10: North America Ultra Short Acting Anesthetic Volume Share (%), by Types 2025 & 2033
- Figure 11: North America Ultra Short Acting Anesthetic Revenue (billion), by Country 2025 & 2033
- Figure 12: North America Ultra Short Acting Anesthetic Volume (K), by Country 2025 & 2033
- Figure 13: North America Ultra Short Acting Anesthetic Revenue Share (%), by Country 2025 & 2033
- Figure 14: North America Ultra Short Acting Anesthetic Volume Share (%), by Country 2025 & 2033
- Figure 15: South America Ultra Short Acting Anesthetic Revenue (billion), by Application 2025 & 2033
- Figure 16: South America Ultra Short Acting Anesthetic Volume (K), by Application 2025 & 2033
- Figure 17: South America Ultra Short Acting Anesthetic Revenue Share (%), by Application 2025 & 2033
- Figure 18: South America Ultra Short Acting Anesthetic Volume Share (%), by Application 2025 & 2033
- Figure 19: South America Ultra Short Acting Anesthetic Revenue (billion), by Types 2025 & 2033
- Figure 20: South America Ultra Short Acting Anesthetic Volume (K), by Types 2025 & 2033
- Figure 21: South America Ultra Short Acting Anesthetic Revenue Share (%), by Types 2025 & 2033
- Figure 22: South America Ultra Short Acting Anesthetic Volume Share (%), by Types 2025 & 2033
- Figure 23: South America Ultra Short Acting Anesthetic Revenue (billion), by Country 2025 & 2033
- Figure 24: South America Ultra Short Acting Anesthetic Volume (K), by Country 2025 & 2033
- Figure 25: South America Ultra Short Acting Anesthetic Revenue Share (%), by Country 2025 & 2033
- Figure 26: South America Ultra Short Acting Anesthetic Volume Share (%), by Country 2025 & 2033
- Figure 27: Europe Ultra Short Acting Anesthetic Revenue (billion), by Application 2025 & 2033
- Figure 28: Europe Ultra Short Acting Anesthetic Volume (K), by Application 2025 & 2033
- Figure 29: Europe Ultra Short Acting Anesthetic Revenue Share (%), by Application 2025 & 2033
- Figure 30: Europe Ultra Short Acting Anesthetic Volume Share (%), by Application 2025 & 2033
- Figure 31: Europe Ultra Short Acting Anesthetic Revenue (billion), by Types 2025 & 2033
- Figure 32: Europe Ultra Short Acting Anesthetic Volume (K), by Types 2025 & 2033
- Figure 33: Europe Ultra Short Acting Anesthetic Revenue Share (%), by Types 2025 & 2033
- Figure 34: Europe Ultra Short Acting Anesthetic Volume Share (%), by Types 2025 & 2033
- Figure 35: Europe Ultra Short Acting Anesthetic Revenue (billion), by Country 2025 & 2033
- Figure 36: Europe Ultra Short Acting Anesthetic Volume (K), by Country 2025 & 2033
- Figure 37: Europe Ultra Short Acting Anesthetic Revenue Share (%), by Country 2025 & 2033
- Figure 38: Europe Ultra Short Acting Anesthetic Volume Share (%), by Country 2025 & 2033
- Figure 39: Middle East & Africa Ultra Short Acting Anesthetic Revenue (billion), by Application 2025 & 2033
- Figure 40: Middle East & Africa Ultra Short Acting Anesthetic Volume (K), by Application 2025 & 2033
- Figure 41: Middle East & Africa Ultra Short Acting Anesthetic Revenue Share (%), by Application 2025 & 2033
- Figure 42: Middle East & Africa Ultra Short Acting Anesthetic Volume Share (%), by Application 2025 & 2033
- Figure 43: Middle East & Africa Ultra Short Acting Anesthetic Revenue (billion), by Types 2025 & 2033
- Figure 44: Middle East & Africa Ultra Short Acting Anesthetic Volume (K), by Types 2025 & 2033
- Figure 45: Middle East & Africa Ultra Short Acting Anesthetic Revenue Share (%), by Types 2025 & 2033
- Figure 46: Middle East & Africa Ultra Short Acting Anesthetic Volume Share (%), by Types 2025 & 2033
- Figure 47: Middle East & Africa Ultra Short Acting Anesthetic Revenue (billion), by Country 2025 & 2033
- Figure 48: Middle East & Africa Ultra Short Acting Anesthetic Volume (K), by Country 2025 & 2033
- Figure 49: Middle East & Africa Ultra Short Acting Anesthetic Revenue Share (%), by Country 2025 & 2033
- Figure 50: Middle East & Africa Ultra Short Acting Anesthetic Volume Share (%), by Country 2025 & 2033
- Figure 51: Asia Pacific Ultra Short Acting Anesthetic Revenue (billion), by Application 2025 & 2033
- Figure 52: Asia Pacific Ultra Short Acting Anesthetic Volume (K), by Application 2025 & 2033
- Figure 53: Asia Pacific Ultra Short Acting Anesthetic Revenue Share (%), by Application 2025 & 2033
- Figure 54: Asia Pacific Ultra Short Acting Anesthetic Volume Share (%), by Application 2025 & 2033
- Figure 55: Asia Pacific Ultra Short Acting Anesthetic Revenue (billion), by Types 2025 & 2033
- Figure 56: Asia Pacific Ultra Short Acting Anesthetic Volume (K), by Types 2025 & 2033
- Figure 57: Asia Pacific Ultra Short Acting Anesthetic Revenue Share (%), by Types 2025 & 2033
- Figure 58: Asia Pacific Ultra Short Acting Anesthetic Volume Share (%), by Types 2025 & 2033
- Figure 59: Asia Pacific Ultra Short Acting Anesthetic Revenue (billion), by Country 2025 & 2033
- Figure 60: Asia Pacific Ultra Short Acting Anesthetic Volume (K), by Country 2025 & 2033
- Figure 61: Asia Pacific Ultra Short Acting Anesthetic Revenue Share (%), by Country 2025 & 2033
- Figure 62: Asia Pacific Ultra Short Acting Anesthetic Volume Share (%), by Country 2025 & 2033
List of Tables
- Table 1: Global Ultra Short Acting Anesthetic Revenue billion Forecast, by Application 2020 & 2033
- Table 2: Global Ultra Short Acting Anesthetic Volume K Forecast, by Application 2020 & 2033
- Table 3: Global Ultra Short Acting Anesthetic Revenue billion Forecast, by Types 2020 & 2033
- Table 4: Global Ultra Short Acting Anesthetic Volume K Forecast, by Types 2020 & 2033
- Table 5: Global Ultra Short Acting Anesthetic Revenue billion Forecast, by Region 2020 & 2033
- Table 6: Global Ultra Short Acting Anesthetic Volume K Forecast, by Region 2020 & 2033
- Table 7: Global Ultra Short Acting Anesthetic Revenue billion Forecast, by Application 2020 & 2033
- Table 8: Global Ultra Short Acting Anesthetic Volume K Forecast, by Application 2020 & 2033
- Table 9: Global Ultra Short Acting Anesthetic Revenue billion Forecast, by Types 2020 & 2033
- Table 10: Global Ultra Short Acting Anesthetic Volume K Forecast, by Types 2020 & 2033
- Table 11: Global Ultra Short Acting Anesthetic Revenue billion Forecast, by Country 2020 & 2033
- Table 12: Global Ultra Short Acting Anesthetic Volume K Forecast, by Country 2020 & 2033
- Table 13: United States Ultra Short Acting Anesthetic Revenue (billion) Forecast, by Application 2020 & 2033
- Table 14: United States Ultra Short Acting Anesthetic Volume (K) Forecast, by Application 2020 & 2033
- Table 15: Canada Ultra Short Acting Anesthetic Revenue (billion) Forecast, by Application 2020 & 2033
- Table 16: Canada Ultra Short Acting Anesthetic Volume (K) Forecast, by Application 2020 & 2033
- Table 17: Mexico Ultra Short Acting Anesthetic Revenue (billion) Forecast, by Application 2020 & 2033
- Table 18: Mexico Ultra Short Acting Anesthetic Volume (K) Forecast, by Application 2020 & 2033
- Table 19: Global Ultra Short Acting Anesthetic Revenue billion Forecast, by Application 2020 & 2033
- Table 20: Global Ultra Short Acting Anesthetic Volume K Forecast, by Application 2020 & 2033
- Table 21: Global Ultra Short Acting Anesthetic Revenue billion Forecast, by Types 2020 & 2033
- Table 22: Global Ultra Short Acting Anesthetic Volume K Forecast, by Types 2020 & 2033
- Table 23: Global Ultra Short Acting Anesthetic Revenue billion Forecast, by Country 2020 & 2033
- Table 24: Global Ultra Short Acting Anesthetic Volume K Forecast, by Country 2020 & 2033
- Table 25: Brazil Ultra Short Acting Anesthetic Revenue (billion) Forecast, by Application 2020 & 2033
- Table 26: Brazil Ultra Short Acting Anesthetic Volume (K) Forecast, by Application 2020 & 2033
- Table 27: Argentina Ultra Short Acting Anesthetic Revenue (billion) Forecast, by Application 2020 & 2033
- Table 28: Argentina Ultra Short Acting Anesthetic Volume (K) Forecast, by Application 2020 & 2033
- Table 29: Rest of South America Ultra Short Acting Anesthetic Revenue (billion) Forecast, by Application 2020 & 2033
- Table 30: Rest of South America Ultra Short Acting Anesthetic Volume (K) Forecast, by Application 2020 & 2033
- Table 31: Global Ultra Short Acting Anesthetic Revenue billion Forecast, by Application 2020 & 2033
- Table 32: Global Ultra Short Acting Anesthetic Volume K Forecast, by Application 2020 & 2033
- Table 33: Global Ultra Short Acting Anesthetic Revenue billion Forecast, by Types 2020 & 2033
- Table 34: Global Ultra Short Acting Anesthetic Volume K Forecast, by Types 2020 & 2033
- Table 35: Global Ultra Short Acting Anesthetic Revenue billion Forecast, by Country 2020 & 2033
- Table 36: Global Ultra Short Acting Anesthetic Volume K Forecast, by Country 2020 & 2033
- Table 37: United Kingdom Ultra Short Acting Anesthetic Revenue (billion) Forecast, by Application 2020 & 2033
- Table 38: United Kingdom Ultra Short Acting Anesthetic Volume (K) Forecast, by Application 2020 & 2033
- Table 39: Germany Ultra Short Acting Anesthetic Revenue (billion) Forecast, by Application 2020 & 2033
- Table 40: Germany Ultra Short Acting Anesthetic Volume (K) Forecast, by Application 2020 & 2033
- Table 41: France Ultra Short Acting Anesthetic Revenue (billion) Forecast, by Application 2020 & 2033
- Table 42: France Ultra Short Acting Anesthetic Volume (K) Forecast, by Application 2020 & 2033
- Table 43: Italy Ultra Short Acting Anesthetic Revenue (billion) Forecast, by Application 2020 & 2033
- Table 44: Italy Ultra Short Acting Anesthetic Volume (K) Forecast, by Application 2020 & 2033
- Table 45: Spain Ultra Short Acting Anesthetic Revenue (billion) Forecast, by Application 2020 & 2033
- Table 46: Spain Ultra Short Acting Anesthetic Volume (K) Forecast, by Application 2020 & 2033
- Table 47: Russia Ultra Short Acting Anesthetic Revenue (billion) Forecast, by Application 2020 & 2033
- Table 48: Russia Ultra Short Acting Anesthetic Volume (K) Forecast, by Application 2020 & 2033
- Table 49: Benelux Ultra Short Acting Anesthetic Revenue (billion) Forecast, by Application 2020 & 2033
- Table 50: Benelux Ultra Short Acting Anesthetic Volume (K) Forecast, by Application 2020 & 2033
- Table 51: Nordics Ultra Short Acting Anesthetic Revenue (billion) Forecast, by Application 2020 & 2033
- Table 52: Nordics Ultra Short Acting Anesthetic Volume (K) Forecast, by Application 2020 & 2033
- Table 53: Rest of Europe Ultra Short Acting Anesthetic Revenue (billion) Forecast, by Application 2020 & 2033
- Table 54: Rest of Europe Ultra Short Acting Anesthetic Volume (K) Forecast, by Application 2020 & 2033
- Table 55: Global Ultra Short Acting Anesthetic Revenue billion Forecast, by Application 2020 & 2033
- Table 56: Global Ultra Short Acting Anesthetic Volume K Forecast, by Application 2020 & 2033
- Table 57: Global Ultra Short Acting Anesthetic Revenue billion Forecast, by Types 2020 & 2033
- Table 58: Global Ultra Short Acting Anesthetic Volume K Forecast, by Types 2020 & 2033
- Table 59: Global Ultra Short Acting Anesthetic Revenue billion Forecast, by Country 2020 & 2033
- Table 60: Global Ultra Short Acting Anesthetic Volume K Forecast, by Country 2020 & 2033
- Table 61: Turkey Ultra Short Acting Anesthetic Revenue (billion) Forecast, by Application 2020 & 2033
- Table 62: Turkey Ultra Short Acting Anesthetic Volume (K) Forecast, by Application 2020 & 2033
- Table 63: Israel Ultra Short Acting Anesthetic Revenue (billion) Forecast, by Application 2020 & 2033
- Table 64: Israel Ultra Short Acting Anesthetic Volume (K) Forecast, by Application 2020 & 2033
- Table 65: GCC Ultra Short Acting Anesthetic Revenue (billion) Forecast, by Application 2020 & 2033
- Table 66: GCC Ultra Short Acting Anesthetic Volume (K) Forecast, by Application 2020 & 2033
- Table 67: North Africa Ultra Short Acting Anesthetic Revenue (billion) Forecast, by Application 2020 & 2033
- Table 68: North Africa Ultra Short Acting Anesthetic Volume (K) Forecast, by Application 2020 & 2033
- Table 69: South Africa Ultra Short Acting Anesthetic Revenue (billion) Forecast, by Application 2020 & 2033
- Table 70: South Africa Ultra Short Acting Anesthetic Volume (K) Forecast, by Application 2020 & 2033
- Table 71: Rest of Middle East & Africa Ultra Short Acting Anesthetic Revenue (billion) Forecast, by Application 2020 & 2033
- Table 72: Rest of Middle East & Africa Ultra Short Acting Anesthetic Volume (K) Forecast, by Application 2020 & 2033
- Table 73: Global Ultra Short Acting Anesthetic Revenue billion Forecast, by Application 2020 & 2033
- Table 74: Global Ultra Short Acting Anesthetic Volume K Forecast, by Application 2020 & 2033
- Table 75: Global Ultra Short Acting Anesthetic Revenue billion Forecast, by Types 2020 & 2033
- Table 76: Global Ultra Short Acting Anesthetic Volume K Forecast, by Types 2020 & 2033
- Table 77: Global Ultra Short Acting Anesthetic Revenue billion Forecast, by Country 2020 & 2033
- Table 78: Global Ultra Short Acting Anesthetic Volume K Forecast, by Country 2020 & 2033
- Table 79: China Ultra Short Acting Anesthetic Revenue (billion) Forecast, by Application 2020 & 2033
- Table 80: China Ultra Short Acting Anesthetic Volume (K) Forecast, by Application 2020 & 2033
- Table 81: India Ultra Short Acting Anesthetic Revenue (billion) Forecast, by Application 2020 & 2033
- Table 82: India Ultra Short Acting Anesthetic Volume (K) Forecast, by Application 2020 & 2033
- Table 83: Japan Ultra Short Acting Anesthetic Revenue (billion) Forecast, by Application 2020 & 2033
- Table 84: Japan Ultra Short Acting Anesthetic Volume (K) Forecast, by Application 2020 & 2033
- Table 85: South Korea Ultra Short Acting Anesthetic Revenue (billion) Forecast, by Application 2020 & 2033
- Table 86: South Korea Ultra Short Acting Anesthetic Volume (K) Forecast, by Application 2020 & 2033
- Table 87: ASEAN Ultra Short Acting Anesthetic Revenue (billion) Forecast, by Application 2020 & 2033
- Table 88: ASEAN Ultra Short Acting Anesthetic Volume (K) Forecast, by Application 2020 & 2033
- Table 89: Oceania Ultra Short Acting Anesthetic Revenue (billion) Forecast, by Application 2020 & 2033
- Table 90: Oceania Ultra Short Acting Anesthetic Volume (K) Forecast, by Application 2020 & 2033
- Table 91: Rest of Asia Pacific Ultra Short Acting Anesthetic Revenue (billion) Forecast, by Application 2020 & 2033
- Table 92: Rest of Asia Pacific Ultra Short Acting Anesthetic Volume (K) Forecast, by Application 2020 & 2033
Frequently Asked Questions
1. What is the projected Compound Annual Growth Rate (CAGR) of the Ultra Short Acting Anesthetic?
The projected CAGR is approximately 2.84%.
2. Which companies are prominent players in the Ultra Short Acting Anesthetic?
Key companies in the market include Paion, AstraZeneca, Fresenius-Kabi, BbVie Laboratories, Baxter Healthcare, Braun, Maruishi, Piramal Healthcare, Hikma Pharmaceuticals, Mylan, Nhwa, Lunan, Hengrui, Pfizer, Merck, Eli Lilly, Meda pharmaceuticals, Sanofi, Teva Pharmaceutical, Sumitomo Dainippon Pharma, Bausch Health, Oak Pharmaceuticals.
3. What are the main segments of the Ultra Short Acting Anesthetic?
The market segments include Application, Types.
4. Can you provide details about the market size?
The market size is estimated to be USD 1.79 billion as of 2022.
5. What are some drivers contributing to market growth?
N/A
6. What are the notable trends driving market growth?
N/A
7. Are there any restraints impacting market growth?
N/A
8. Can you provide examples of recent developments in the market?
N/A
9. What pricing options are available for accessing the report?
Pricing options include single-user, multi-user, and enterprise licenses priced at USD 3950.00, USD 5925.00, and USD 7900.00 respectively.
10. Is the market size provided in terms of value or volume?
The market size is provided in terms of value, measured in billion and volume, measured in K.
11. Are there any specific market keywords associated with the report?
Yes, the market keyword associated with the report is "Ultra Short Acting Anesthetic," which aids in identifying and referencing the specific market segment covered.
12. How do I determine which pricing option suits my needs best?
The pricing options vary based on user requirements and access needs. Individual users may opt for single-user licenses, while businesses requiring broader access may choose multi-user or enterprise licenses for cost-effective access to the report.
13. Are there any additional resources or data provided in the Ultra Short Acting Anesthetic report?
While the report offers comprehensive insights, it's advisable to review the specific contents or supplementary materials provided to ascertain if additional resources or data are available.
14. How can I stay updated on further developments or reports in the Ultra Short Acting Anesthetic?
To stay informed about further developments, trends, and reports in the Ultra Short Acting Anesthetic, consider subscribing to industry newsletters, following relevant companies and organizations, or regularly checking reputable industry news sources and publications.
Methodology
Step 1 - Identification of Relevant Samples Size from Population Database


Step 2 - Approaches for Defining Global Market Size (Value, Volume* & Price*)

Note*: In applicable scenarios
Step 3 - Data Sources
Primary Research
- Web Analytics
- Survey Reports
- Research Institute
- Latest Research Reports
- Opinion Leaders
Secondary Research
- Annual Reports
- White Paper
- Latest Press Release
- Industry Association
- Paid Database
- Investor Presentations

Step 4 - Data Triangulation
Involves using different sources of information in order to increase the validity of a study
These sources are likely to be stakeholders in a program - participants, other researchers, program staff, other community members, and so on.
Then we put all data in single framework & apply various statistical tools to find out the dynamic on the market.
During the analysis stage, feedback from the stakeholder groups would be compared to determine areas of agreement as well as areas of divergence