

Key Insights
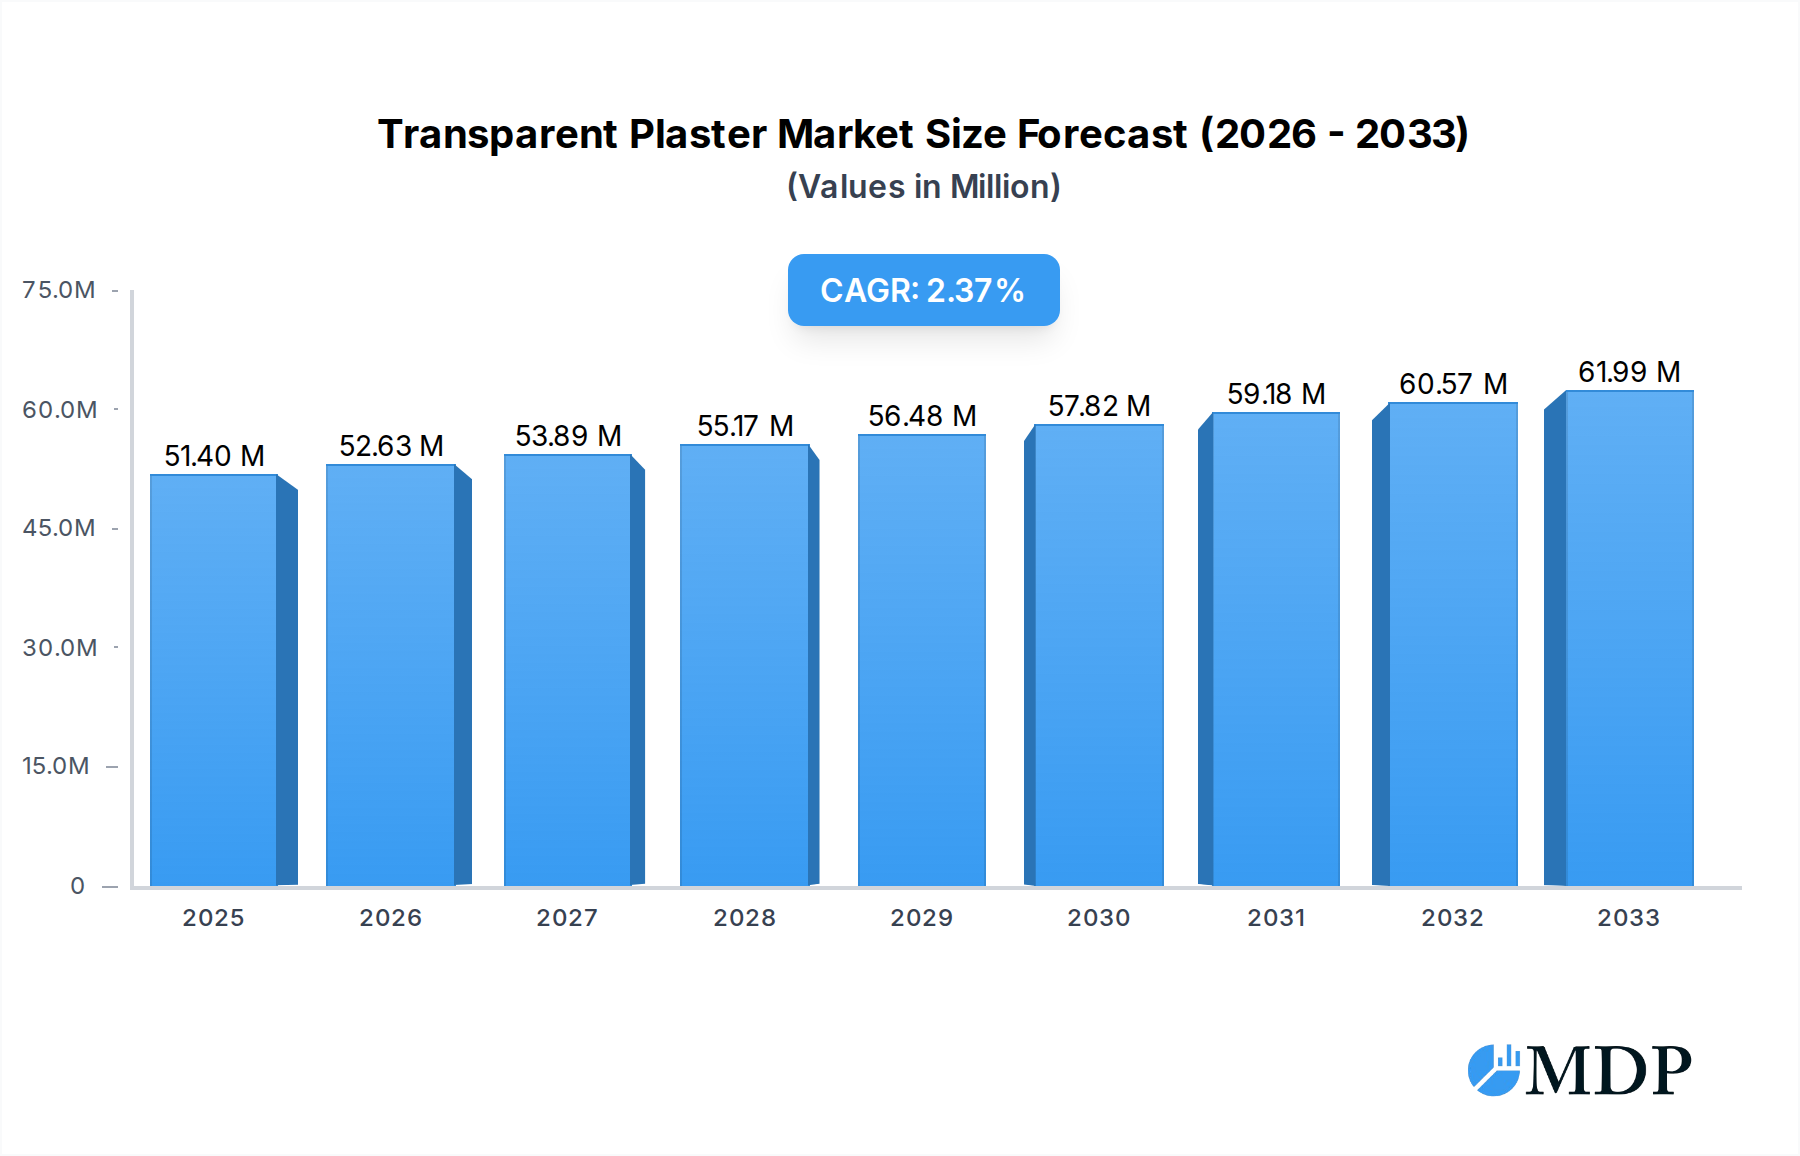
The global transparent plaster market is projected to reach a valuation of $51.4 million in 2025, exhibiting a steady compound annual growth rate (CAGR) of 2.4% through 2033. This growth is underpinned by increasing consumer awareness regarding wound care management and the rising prevalence of minor injuries and skin conditions. The convenience and aesthetic appeal of transparent plasters, which allow for visual monitoring of the wound without removal, are significant drivers. Furthermore, advancements in material technology, leading to improved breathability and adhesion, are enhancing product efficacy and user satisfaction. The market's expansion is also influenced by the growing demand from healthcare settings like hospitals and clinics, where efficient and observable wound dressing is crucial for patient recovery. Retail pharmacies and the "Others" segment, encompassing direct-to-consumer sales and online platforms, also contribute substantially to market penetration, reflecting the accessibility and widespread availability of these essential wound care products.

Transparent Plaster Market Size (In Million)
The transparent plaster market is segmented into "Non-Perforated Transparent Plaster" and "Perforated Transparent Plaster" based on type, catering to diverse wound healing needs. Applications span across pharmacies, hospitals, clinics, and other healthcare-related channels. Key players such as 3M, Johnson & Johnson, Smith & Nephew, and Beiersdorf are actively investing in research and development to introduce innovative, skin-friendly, and highly effective transparent plaster solutions. Emerging market trends include a focus on hypoallergenic materials and the development of plasters with enhanced antimicrobial properties. While the market benefits from increasing healthcare expenditure and a growing elderly population prone to injuries, potential restraints could include the availability of alternative wound care products and price sensitivity in certain consumer segments. Despite these challenges, the inherent advantages of transparent plasters are expected to sustain their upward trajectory in the global market.
Transparent Plaster Company Market Share
Comprehensive Report: Transparent Plaster Market Analysis (2019–2033)
This in-depth report provides a thorough analysis of the global transparent plaster market, covering historical trends, current dynamics, and future projections. Spanning the period from 2019 to 2033, with a base year of 2025, this research offers actionable insights for industry stakeholders, including manufacturers, suppliers, distributors, and investors. We delve into market segmentation by application and product type, identify leading market players, and explore key drivers, challenges, and emerging opportunities. The report utilizes high-traffic keywords to ensure maximum search visibility and relevance within the healthcare and medical supplies sectors.
Transparent Plaster Market Dynamics & Concentration
The transparent plaster market exhibits a moderate concentration, with a few key players holding significant market share, estimated to be in the range of 40-50%. However, the presence of numerous smaller and regional manufacturers contributes to a competitive landscape. Innovation drivers are primarily focused on enhancing product efficacy, patient comfort, and ease of application. This includes the development of advanced adhesive technologies, hypoallergenic materials, and improved breathability. Regulatory frameworks, such as those set by the FDA and EMA, play a crucial role in shaping product standards and market access, influencing approximately 30-40% of market dynamics through compliance requirements. Product substitutes, including traditional fabric plasters and advanced wound care dressings, represent a constant competitive pressure, impacting market share by an estimated 15-25%. End-user trends reveal a growing demand for discreet and waterproof wound care solutions, particularly among consumers seeking aesthetic appeal and functionality. Merger and acquisition (M&A) activities in the sector have been moderate, with an estimated 5-10 significant deals recorded over the historical period, aimed at expanding product portfolios and geographical reach.
Transparent Plaster Industry Trends & Analysis
The transparent plaster industry is poised for significant expansion, driven by a confluence of factors that are reshaping consumer preferences and healthcare practices. The projected Compound Annual Growth Rate (CAGR) for the forecast period is estimated at a robust 6-8%, indicating substantial market growth. This upward trajectory is fueled by an increasing awareness among consumers and healthcare professionals regarding the benefits of transparent plasters, such as their ability to allow for easy wound monitoring without removal, thereby minimizing disturbance and promoting healing. The market penetration of transparent plasters is steadily increasing, particularly in developed economies, as they become a preferred choice over traditional wound coverings in various settings.
Technological disruptions are playing a pivotal role in this evolution. Advancements in polymer science have led to the development of highly flexible, breathable, and hypoallergenic materials that offer superior adhesion and are less likely to cause skin irritation. Waterproofing capabilities are also being enhanced, allowing individuals to maintain hygiene and continue daily activities without compromising wound protection. Consumer preferences are leaning towards products that offer both efficacy and discretion. The aesthetic appeal of transparent plasters, being virtually invisible on the skin, makes them particularly attractive to a broad demographic, including athletes, children, and individuals conscious of their appearance. This shift is evident in the rising demand for transparent plasters in retail pharmacies and direct-to-consumer channels.
The competitive dynamics within the transparent plaster market are characterized by a blend of established global brands and agile regional players. Companies are increasingly investing in research and development to differentiate their offerings through unique features and improved performance. The rising prevalence of minor injuries and cuts, coupled with a proactive approach to personal health management, further bolsters the demand for readily available and effective wound care solutions. The growing emphasis on preventative healthcare and self-care practices is also contributing to the sustained demand for transparent plasters, solidifying their position as an essential item in medicine cabinets worldwide. The market is expected to reach a valuation of approximately $5,000 million by the end of the forecast period, a testament to its sustained growth and expanding consumer base.
Leading Markets & Segments in Transparent Plaster
The transparent plaster market is characterized by distinct regional dominance and segment preferences, each contributing to the overall market landscape. North America currently stands as the leading region, accounting for an estimated 35-40% of the global market share. This dominance is attributed to a combination of factors, including high disposable incomes, advanced healthcare infrastructure, and a strong consumer emphasis on health and wellness. The United States, in particular, represents a substantial portion of this regional market, driven by a mature retail pharmacy sector and widespread adoption of advanced medical supplies.
Within the application segments, Pharmacy emerges as the most significant, commanding an estimated 45-50% of the market. This is due to the high accessibility of transparent plasters in retail pharmacies, catering to everyday minor wound care needs. The increasing trend of self-medication and home healthcare further amplifies the demand in this segment. The Hospital segment follows, representing approximately 25-30% of the market share. Here, transparent plasters are utilized for post-operative wound dressing, minor surgical procedures, and as a secure, breathable covering for intravenous sites, valuing their sterility and ease of monitoring. The Clinic segment, while smaller, contributes around 15-20%, primarily for routine medical examinations, minor injuries, and dermatological applications. The 'Others' segment, encompassing sports medicine, first-aid kits, and specialized industrial applications, accounts for the remaining 5-10%.
In terms of product types, the Non-Perforated Transparent Plaster holds a dominant position, capturing an estimated 55-60% of the market. These plasters offer a completely sealed barrier, ideal for situations requiring maximum protection against water and contaminants. Their versatility makes them suitable for a wide range of applications, from protecting cuts and blisters to covering sensitive wounds. The Perforated Transparent Plaster, accounting for the remaining 40-45%, offers breathability through its micro-perforations. This feature is crucial for wounds that require some air circulation to promote faster healing and reduce the risk of maceration. The demand for perforated variants is growing, particularly in applications where prolonged wear is anticipated and skin health is a primary concern. Economic policies favoring healthcare accessibility and robust supply chain infrastructure in leading countries further solidify the dominance of these key markets and segments.
Transparent Plaster Product Developments
Product innovation in the transparent plaster market is centered on enhancing user experience and therapeutic outcomes. Manufacturers are actively developing plasters with superior adhesive qualities that are both gentle on the skin and provide secure fixation, even in moist conditions. Advancements in materials science are yielding plasters with increased breathability, reducing the risk of skin irritation and promoting faster wound healing. Furthermore, the integration of antimicrobial properties into transparent plasters is a significant trend, offering added protection against infection. The development of specialized transparent plasters for sensitive skin, pediatric use, and specific wound types further diversifies the market offerings, providing competitive advantages through tailored solutions.
Key Drivers of Transparent Plaster Growth
Several key factors are propelling the growth of the transparent plaster market. Firstly, a growing global emphasis on personal health and hygiene management drives consistent demand for accessible wound care solutions. Secondly, technological advancements in material science are leading to more effective, comfortable, and user-friendly transparent plasters. Thirdly, the increasing prevalence of minor injuries in sports and daily activities, coupled with a proactive approach to wound care, fuels market expansion. Finally, favorable regulatory environments that encourage innovation and product quality also contribute to sustained growth.
Challenges in the Transparent Plaster Market
Despite its growth potential, the transparent plaster market faces several challenges. Intense competition from established brands and new entrants exerts significant pricing pressure, potentially impacting profit margins. The availability of lower-cost alternatives, such as traditional fabric plasters, poses a continuous threat. Furthermore, stringent regulatory approval processes for new product formulations or advanced features can lead to extended development timelines and increased costs. Supply chain disruptions, particularly for specialized raw materials, can also affect production and availability, impacting market accessibility by an estimated 10-15%.
Emerging Opportunities in Transparent Plaster
Emerging opportunities in the transparent plaster market are largely driven by innovation and expanding market reach. The development of biodegradable and eco-friendly transparent plasters presents a significant opportunity, catering to the growing consumer demand for sustainable products. Strategic partnerships between transparent plaster manufacturers and wound care specialists can lead to the co-development of advanced, integrated wound management solutions. Furthermore, expanding into emerging economies with growing healthcare awareness and increasing disposable incomes offers substantial untapped market potential. The ongoing research into advanced wound healing technologies, such as those incorporating drug delivery systems within transparent plaster designs, promises to unlock new therapeutic applications.
Leading Players in the Transparent Plaster Sector
- Boots
- Reliance Medical
- Tesco
- Sainsbury's
- Robinson Healthcare (Vernacare)
- Paul Murray
- Waitrose & Partners
- Watsons
- Morrisons
- Steroplast Healthcare
- Pharmacare
- Banitore
- Beiersdorf
- 3M
- Avanti Medical
- Guardian Health & Beauty
- LloydsPharmacy
- Scholl's Wellness
- Johnson & Johnson
- Smith & Nephew
- Medline Industries
- Hartmann
- Dynarex
- Derma Sciences
- Curad
Key Milestones in Transparent Plaster Industry
- 2019: Increased consumer adoption of transparent plasters for aesthetic and functional benefits.
- 2020: Enhanced focus on breathable materials to prevent skin irritation during prolonged wear.
- 2021: Introduction of advanced hypoallergenic adhesives for sensitive skin applications.
- 2022: Growing demand for waterproof transparent plasters for active lifestyles.
- 2023: Emergence of antimicrobial transparent plasters to combat wound infections.
- 2024: Increased investment in R&D for biodegradable and eco-friendly transparent plaster options.
Strategic Outlook for Transparent Plaster Market
The strategic outlook for the transparent plaster market remains highly optimistic, with sustained growth anticipated. Key growth accelerators include continued innovation in material science, leading to enhanced product performance and patient comfort. The increasing integration of transparent plasters into comprehensive wound care strategies and the expansion into underdeveloped markets represent significant opportunities. Strategic partnerships and potential mergers and acquisitions will likely shape the competitive landscape, driving consolidation and specialization. Manufacturers focusing on sustainable product development and catering to niche applications will be well-positioned for long-term success in this evolving market.
Transparent Plaster Segmentation
-
1. Application
- 1.1. Pharmacy
- 1.2. Hospital
- 1.3. Clinic
- 1.4. Others
-
2. Types
- 2.1. Non Perforated Transparent Plaster
- 2.2. Perforated Transparent Plaster
Transparent Plaster Segmentation By Geography
-
1. North America
- 1.1. United States
- 1.2. Canada
- 1.3. Mexico
-
2. South America
- 2.1. Brazil
- 2.2. Argentina
- 2.3. Rest of South America
-
3. Europe
- 3.1. United Kingdom
- 3.2. Germany
- 3.3. France
- 3.4. Italy
- 3.5. Spain
- 3.6. Russia
- 3.7. Benelux
- 3.8. Nordics
- 3.9. Rest of Europe
-
4. Middle East & Africa
- 4.1. Turkey
- 4.2. Israel
- 4.3. GCC
- 4.4. North Africa
- 4.5. South Africa
- 4.6. Rest of Middle East & Africa
-
5. Asia Pacific
- 5.1. China
- 5.2. India
- 5.3. Japan
- 5.4. South Korea
- 5.5. ASEAN
- 5.6. Oceania
- 5.7. Rest of Asia Pacific
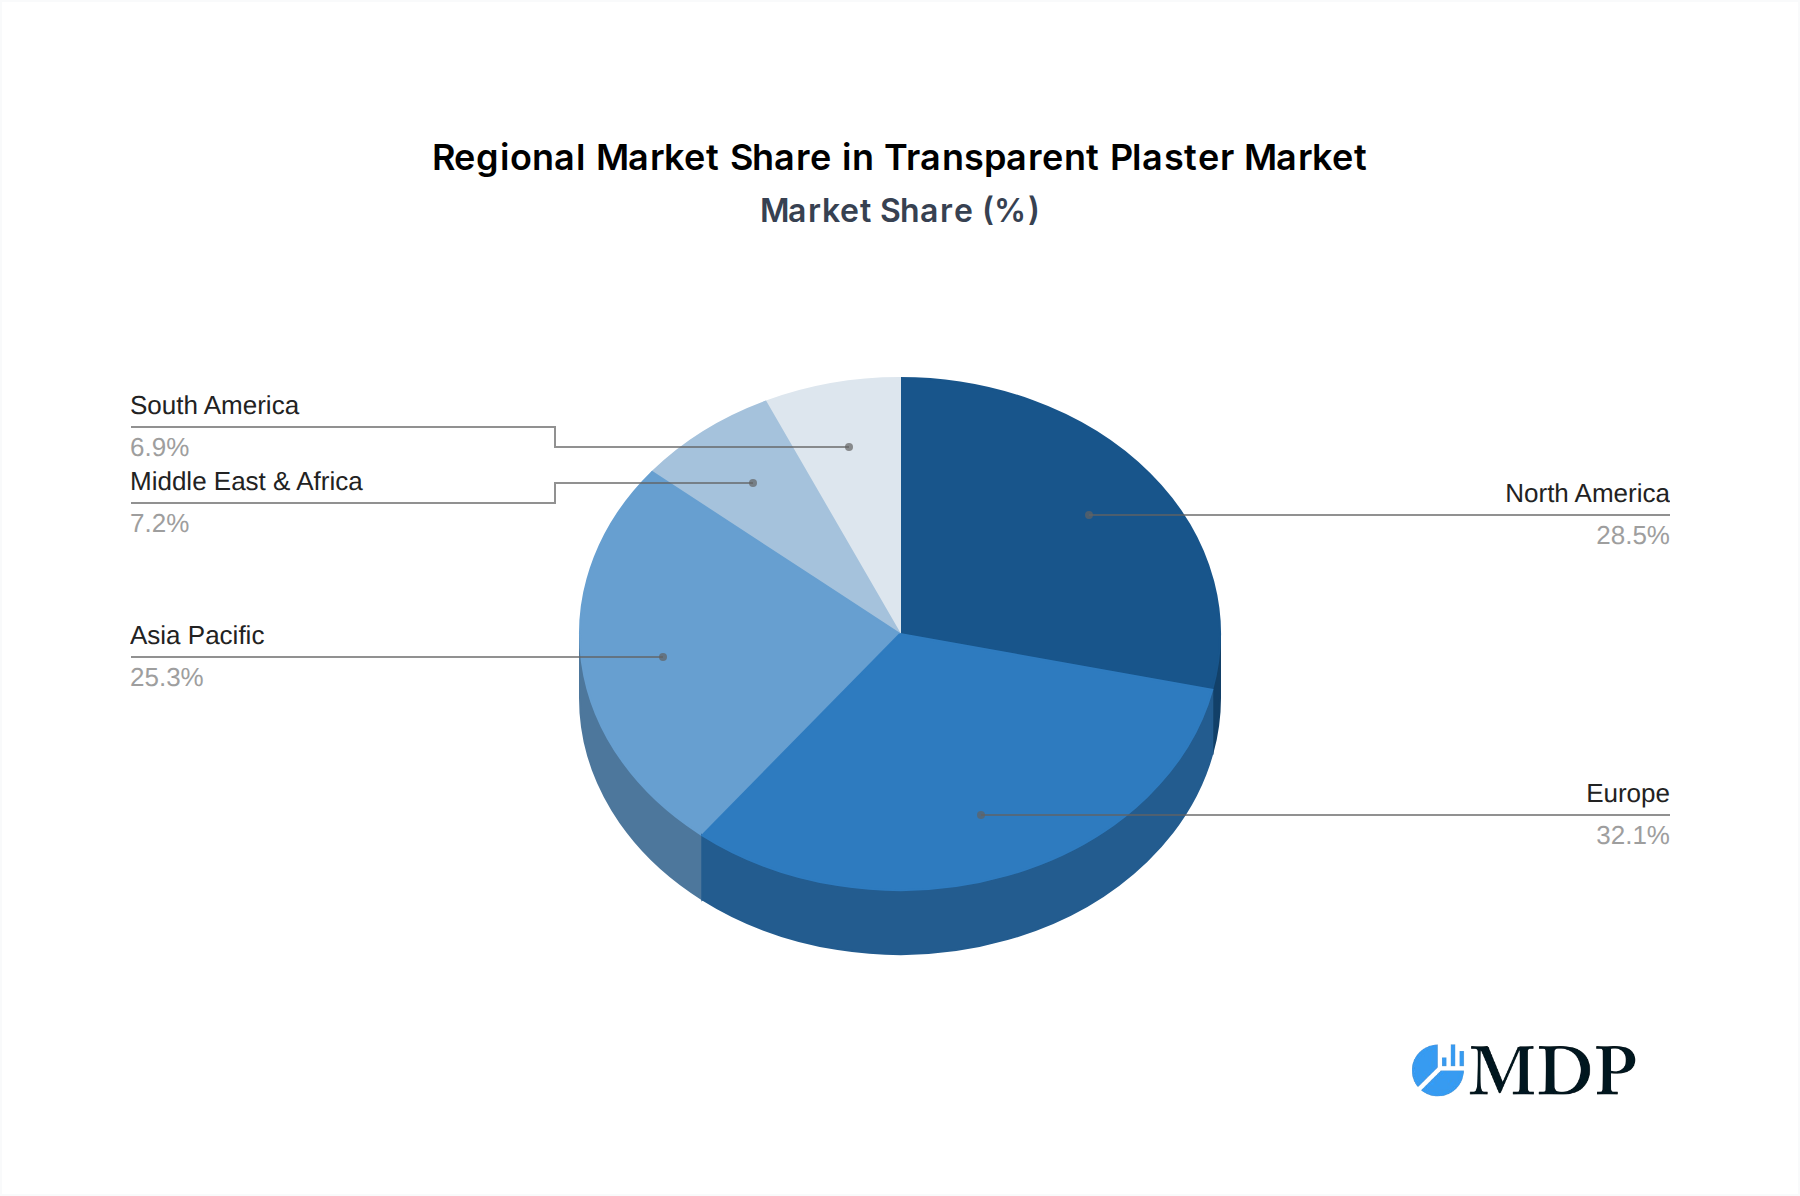
Transparent Plaster Regional Market Share
Geographic Coverage of Transparent Plaster
Transparent Plaster REPORT HIGHLIGHTS
| Aspects | Details |
|---|---|
| Study Period | 2020-2034 |
| Base Year | 2025 |
| Estimated Year | 2026 |
| Forecast Period | 2026-2034 |
| Historical Period | 2020-2025 |
| Growth Rate | CAGR of 14.4% from 2020-2034 |
| Segmentation |
|
Table of Contents
- 1. Introduction
- 1.1. Research Scope
- 1.2. Market Segmentation
- 1.3. Research Methodology
- 1.4. Definitions and Assumptions
- 2. Executive Summary
- 2.1. Introduction
- 3. Market Dynamics
- 3.1. Introduction
- 3.2. Market Drivers
- 3.3. Market Restrains
- 3.4. Market Trends
- 4. Market Factor Analysis
- 4.1. Porters Five Forces
- 4.2. Supply/Value Chain
- 4.3. PESTEL analysis
- 4.4. Market Entropy
- 4.5. Patent/Trademark Analysis
- 5. Global Transparent Plaster Analysis, Insights and Forecast, 2020-2032
- 5.1. Market Analysis, Insights and Forecast - by Application
- 5.1.1. Pharmacy
- 5.1.2. Hospital
- 5.1.3. Clinic
- 5.1.4. Others
- 5.2. Market Analysis, Insights and Forecast - by Types
- 5.2.1. Non Perforated Transparent Plaster
- 5.2.2. Perforated Transparent Plaster
- 5.3. Market Analysis, Insights and Forecast - by Region
- 5.3.1. North America
- 5.3.2. South America
- 5.3.3. Europe
- 5.3.4. Middle East & Africa
- 5.3.5. Asia Pacific
- 5.1. Market Analysis, Insights and Forecast - by Application
- 6. North America Transparent Plaster Analysis, Insights and Forecast, 2020-2032
- 6.1. Market Analysis, Insights and Forecast - by Application
- 6.1.1. Pharmacy
- 6.1.2. Hospital
- 6.1.3. Clinic
- 6.1.4. Others
- 6.2. Market Analysis, Insights and Forecast - by Types
- 6.2.1. Non Perforated Transparent Plaster
- 6.2.2. Perforated Transparent Plaster
- 6.1. Market Analysis, Insights and Forecast - by Application
- 7. South America Transparent Plaster Analysis, Insights and Forecast, 2020-2032
- 7.1. Market Analysis, Insights and Forecast - by Application
- 7.1.1. Pharmacy
- 7.1.2. Hospital
- 7.1.3. Clinic
- 7.1.4. Others
- 7.2. Market Analysis, Insights and Forecast - by Types
- 7.2.1. Non Perforated Transparent Plaster
- 7.2.2. Perforated Transparent Plaster
- 7.1. Market Analysis, Insights and Forecast - by Application
- 8. Europe Transparent Plaster Analysis, Insights and Forecast, 2020-2032
- 8.1. Market Analysis, Insights and Forecast - by Application
- 8.1.1. Pharmacy
- 8.1.2. Hospital
- 8.1.3. Clinic
- 8.1.4. Others
- 8.2. Market Analysis, Insights and Forecast - by Types
- 8.2.1. Non Perforated Transparent Plaster
- 8.2.2. Perforated Transparent Plaster
- 8.1. Market Analysis, Insights and Forecast - by Application
- 9. Middle East & Africa Transparent Plaster Analysis, Insights and Forecast, 2020-2032
- 9.1. Market Analysis, Insights and Forecast - by Application
- 9.1.1. Pharmacy
- 9.1.2. Hospital
- 9.1.3. Clinic
- 9.1.4. Others
- 9.2. Market Analysis, Insights and Forecast - by Types
- 9.2.1. Non Perforated Transparent Plaster
- 9.2.2. Perforated Transparent Plaster
- 9.1. Market Analysis, Insights and Forecast - by Application
- 10. Asia Pacific Transparent Plaster Analysis, Insights and Forecast, 2020-2032
- 10.1. Market Analysis, Insights and Forecast - by Application
- 10.1.1. Pharmacy
- 10.1.2. Hospital
- 10.1.3. Clinic
- 10.1.4. Others
- 10.2. Market Analysis, Insights and Forecast - by Types
- 10.2.1. Non Perforated Transparent Plaster
- 10.2.2. Perforated Transparent Plaster
- 10.1. Market Analysis, Insights and Forecast - by Application
- 11. Competitive Analysis
- 11.1. Global Market Share Analysis 2025
- 11.2. Company Profiles
- 11.2.1 Boots
- 11.2.1.1. Overview
- 11.2.1.2. Products
- 11.2.1.3. SWOT Analysis
- 11.2.1.4. Recent Developments
- 11.2.1.5. Financials (Based on Availability)
- 11.2.2 Reliance Medical
- 11.2.2.1. Overview
- 11.2.2.2. Products
- 11.2.2.3. SWOT Analysis
- 11.2.2.4. Recent Developments
- 11.2.2.5. Financials (Based on Availability)
- 11.2.3 Tesco
- 11.2.3.1. Overview
- 11.2.3.2. Products
- 11.2.3.3. SWOT Analysis
- 11.2.3.4. Recent Developments
- 11.2.3.5. Financials (Based on Availability)
- 11.2.4 Sainsbury's
- 11.2.4.1. Overview
- 11.2.4.2. Products
- 11.2.4.3. SWOT Analysis
- 11.2.4.4. Recent Developments
- 11.2.4.5. Financials (Based on Availability)
- 11.2.5 Robinson Healthcare(Vernacare)
- 11.2.5.1. Overview
- 11.2.5.2. Products
- 11.2.5.3. SWOT Analysis
- 11.2.5.4. Recent Developments
- 11.2.5.5. Financials (Based on Availability)
- 11.2.6 Paul Murray
- 11.2.6.1. Overview
- 11.2.6.2. Products
- 11.2.6.3. SWOT Analysis
- 11.2.6.4. Recent Developments
- 11.2.6.5. Financials (Based on Availability)
- 11.2.7 Waitrose & Partners
- 11.2.7.1. Overview
- 11.2.7.2. Products
- 11.2.7.3. SWOT Analysis
- 11.2.7.4. Recent Developments
- 11.2.7.5. Financials (Based on Availability)
- 11.2.8 Watsons
- 11.2.8.1. Overview
- 11.2.8.2. Products
- 11.2.8.3. SWOT Analysis
- 11.2.8.4. Recent Developments
- 11.2.8.5. Financials (Based on Availability)
- 11.2.9 Morrisons
- 11.2.9.1. Overview
- 11.2.9.2. Products
- 11.2.9.3. SWOT Analysis
- 11.2.9.4. Recent Developments
- 11.2.9.5. Financials (Based on Availability)
- 11.2.10 Steroplast Healthcare
- 11.2.10.1. Overview
- 11.2.10.2. Products
- 11.2.10.3. SWOT Analysis
- 11.2.10.4. Recent Developments
- 11.2.10.5. Financials (Based on Availability)
- 11.2.11 Pharmacare
- 11.2.11.1. Overview
- 11.2.11.2. Products
- 11.2.11.3. SWOT Analysis
- 11.2.11.4. Recent Developments
- 11.2.11.5. Financials (Based on Availability)
- 11.2.12 Banitore
- 11.2.12.1. Overview
- 11.2.12.2. Products
- 11.2.12.3. SWOT Analysis
- 11.2.12.4. Recent Developments
- 11.2.12.5. Financials (Based on Availability)
- 11.2.13 Beiersdorf
- 11.2.13.1. Overview
- 11.2.13.2. Products
- 11.2.13.3. SWOT Analysis
- 11.2.13.4. Recent Developments
- 11.2.13.5. Financials (Based on Availability)
- 11.2.14 3M
- 11.2.14.1. Overview
- 11.2.14.2. Products
- 11.2.14.3. SWOT Analysis
- 11.2.14.4. Recent Developments
- 11.2.14.5. Financials (Based on Availability)
- 11.2.15 Avanti Medical
- 11.2.15.1. Overview
- 11.2.15.2. Products
- 11.2.15.3. SWOT Analysis
- 11.2.15.4. Recent Developments
- 11.2.15.5. Financials (Based on Availability)
- 11.2.16 Guardian Health & Beauty
- 11.2.16.1. Overview
- 11.2.16.2. Products
- 11.2.16.3. SWOT Analysis
- 11.2.16.4. Recent Developments
- 11.2.16.5. Financials (Based on Availability)
- 11.2.17 LloydsPharmacy
- 11.2.17.1. Overview
- 11.2.17.2. Products
- 11.2.17.3. SWOT Analysis
- 11.2.17.4. Recent Developments
- 11.2.17.5. Financials (Based on Availability)
- 11.2.18 Scholl's Wellness
- 11.2.18.1. Overview
- 11.2.18.2. Products
- 11.2.18.3. SWOT Analysis
- 11.2.18.4. Recent Developments
- 11.2.18.5. Financials (Based on Availability)
- 11.2.19 Johnson & Johnson
- 11.2.19.1. Overview
- 11.2.19.2. Products
- 11.2.19.3. SWOT Analysis
- 11.2.19.4. Recent Developments
- 11.2.19.5. Financials (Based on Availability)
- 11.2.20 Smith & Nephew
- 11.2.20.1. Overview
- 11.2.20.2. Products
- 11.2.20.3. SWOT Analysis
- 11.2.20.4. Recent Developments
- 11.2.20.5. Financials (Based on Availability)
- 11.2.21 Medline Industries
- 11.2.21.1. Overview
- 11.2.21.2. Products
- 11.2.21.3. SWOT Analysis
- 11.2.21.4. Recent Developments
- 11.2.21.5. Financials (Based on Availability)
- 11.2.22 Hartmann
- 11.2.22.1. Overview
- 11.2.22.2. Products
- 11.2.22.3. SWOT Analysis
- 11.2.22.4. Recent Developments
- 11.2.22.5. Financials (Based on Availability)
- 11.2.23 Dynarex
- 11.2.23.1. Overview
- 11.2.23.2. Products
- 11.2.23.3. SWOT Analysis
- 11.2.23.4. Recent Developments
- 11.2.23.5. Financials (Based on Availability)
- 11.2.24 Derma Sciences
- 11.2.24.1. Overview
- 11.2.24.2. Products
- 11.2.24.3. SWOT Analysis
- 11.2.24.4. Recent Developments
- 11.2.24.5. Financials (Based on Availability)
- 11.2.25 Curad
- 11.2.25.1. Overview
- 11.2.25.2. Products
- 11.2.25.3. SWOT Analysis
- 11.2.25.4. Recent Developments
- 11.2.25.5. Financials (Based on Availability)
- 11.2.1 Boots
List of Figures
- Figure 1: Global Transparent Plaster Revenue Breakdown (undefined, %) by Region 2025 & 2033
- Figure 2: Global Transparent Plaster Volume Breakdown (K, %) by Region 2025 & 2033
- Figure 3: North America Transparent Plaster Revenue (undefined), by Application 2025 & 2033
- Figure 4: North America Transparent Plaster Volume (K), by Application 2025 & 2033
- Figure 5: North America Transparent Plaster Revenue Share (%), by Application 2025 & 2033
- Figure 6: North America Transparent Plaster Volume Share (%), by Application 2025 & 2033
- Figure 7: North America Transparent Plaster Revenue (undefined), by Types 2025 & 2033
- Figure 8: North America Transparent Plaster Volume (K), by Types 2025 & 2033
- Figure 9: North America Transparent Plaster Revenue Share (%), by Types 2025 & 2033
- Figure 10: North America Transparent Plaster Volume Share (%), by Types 2025 & 2033
- Figure 11: North America Transparent Plaster Revenue (undefined), by Country 2025 & 2033
- Figure 12: North America Transparent Plaster Volume (K), by Country 2025 & 2033
- Figure 13: North America Transparent Plaster Revenue Share (%), by Country 2025 & 2033
- Figure 14: North America Transparent Plaster Volume Share (%), by Country 2025 & 2033
- Figure 15: South America Transparent Plaster Revenue (undefined), by Application 2025 & 2033
- Figure 16: South America Transparent Plaster Volume (K), by Application 2025 & 2033
- Figure 17: South America Transparent Plaster Revenue Share (%), by Application 2025 & 2033
- Figure 18: South America Transparent Plaster Volume Share (%), by Application 2025 & 2033
- Figure 19: South America Transparent Plaster Revenue (undefined), by Types 2025 & 2033
- Figure 20: South America Transparent Plaster Volume (K), by Types 2025 & 2033
- Figure 21: South America Transparent Plaster Revenue Share (%), by Types 2025 & 2033
- Figure 22: South America Transparent Plaster Volume Share (%), by Types 2025 & 2033
- Figure 23: South America Transparent Plaster Revenue (undefined), by Country 2025 & 2033
- Figure 24: South America Transparent Plaster Volume (K), by Country 2025 & 2033
- Figure 25: South America Transparent Plaster Revenue Share (%), by Country 2025 & 2033
- Figure 26: South America Transparent Plaster Volume Share (%), by Country 2025 & 2033
- Figure 27: Europe Transparent Plaster Revenue (undefined), by Application 2025 & 2033
- Figure 28: Europe Transparent Plaster Volume (K), by Application 2025 & 2033
- Figure 29: Europe Transparent Plaster Revenue Share (%), by Application 2025 & 2033
- Figure 30: Europe Transparent Plaster Volume Share (%), by Application 2025 & 2033
- Figure 31: Europe Transparent Plaster Revenue (undefined), by Types 2025 & 2033
- Figure 32: Europe Transparent Plaster Volume (K), by Types 2025 & 2033
- Figure 33: Europe Transparent Plaster Revenue Share (%), by Types 2025 & 2033
- Figure 34: Europe Transparent Plaster Volume Share (%), by Types 2025 & 2033
- Figure 35: Europe Transparent Plaster Revenue (undefined), by Country 2025 & 2033
- Figure 36: Europe Transparent Plaster Volume (K), by Country 2025 & 2033
- Figure 37: Europe Transparent Plaster Revenue Share (%), by Country 2025 & 2033
- Figure 38: Europe Transparent Plaster Volume Share (%), by Country 2025 & 2033
- Figure 39: Middle East & Africa Transparent Plaster Revenue (undefined), by Application 2025 & 2033
- Figure 40: Middle East & Africa Transparent Plaster Volume (K), by Application 2025 & 2033
- Figure 41: Middle East & Africa Transparent Plaster Revenue Share (%), by Application 2025 & 2033
- Figure 42: Middle East & Africa Transparent Plaster Volume Share (%), by Application 2025 & 2033
- Figure 43: Middle East & Africa Transparent Plaster Revenue (undefined), by Types 2025 & 2033
- Figure 44: Middle East & Africa Transparent Plaster Volume (K), by Types 2025 & 2033
- Figure 45: Middle East & Africa Transparent Plaster Revenue Share (%), by Types 2025 & 2033
- Figure 46: Middle East & Africa Transparent Plaster Volume Share (%), by Types 2025 & 2033
- Figure 47: Middle East & Africa Transparent Plaster Revenue (undefined), by Country 2025 & 2033
- Figure 48: Middle East & Africa Transparent Plaster Volume (K), by Country 2025 & 2033
- Figure 49: Middle East & Africa Transparent Plaster Revenue Share (%), by Country 2025 & 2033
- Figure 50: Middle East & Africa Transparent Plaster Volume Share (%), by Country 2025 & 2033
- Figure 51: Asia Pacific Transparent Plaster Revenue (undefined), by Application 2025 & 2033
- Figure 52: Asia Pacific Transparent Plaster Volume (K), by Application 2025 & 2033
- Figure 53: Asia Pacific Transparent Plaster Revenue Share (%), by Application 2025 & 2033
- Figure 54: Asia Pacific Transparent Plaster Volume Share (%), by Application 2025 & 2033
- Figure 55: Asia Pacific Transparent Plaster Revenue (undefined), by Types 2025 & 2033
- Figure 56: Asia Pacific Transparent Plaster Volume (K), by Types 2025 & 2033
- Figure 57: Asia Pacific Transparent Plaster Revenue Share (%), by Types 2025 & 2033
- Figure 58: Asia Pacific Transparent Plaster Volume Share (%), by Types 2025 & 2033
- Figure 59: Asia Pacific Transparent Plaster Revenue (undefined), by Country 2025 & 2033
- Figure 60: Asia Pacific Transparent Plaster Volume (K), by Country 2025 & 2033
- Figure 61: Asia Pacific Transparent Plaster Revenue Share (%), by Country 2025 & 2033
- Figure 62: Asia Pacific Transparent Plaster Volume Share (%), by Country 2025 & 2033
List of Tables
- Table 1: Global Transparent Plaster Revenue undefined Forecast, by Application 2020 & 2033
- Table 2: Global Transparent Plaster Volume K Forecast, by Application 2020 & 2033
- Table 3: Global Transparent Plaster Revenue undefined Forecast, by Types 2020 & 2033
- Table 4: Global Transparent Plaster Volume K Forecast, by Types 2020 & 2033
- Table 5: Global Transparent Plaster Revenue undefined Forecast, by Region 2020 & 2033
- Table 6: Global Transparent Plaster Volume K Forecast, by Region 2020 & 2033
- Table 7: Global Transparent Plaster Revenue undefined Forecast, by Application 2020 & 2033
- Table 8: Global Transparent Plaster Volume K Forecast, by Application 2020 & 2033
- Table 9: Global Transparent Plaster Revenue undefined Forecast, by Types 2020 & 2033
- Table 10: Global Transparent Plaster Volume K Forecast, by Types 2020 & 2033
- Table 11: Global Transparent Plaster Revenue undefined Forecast, by Country 2020 & 2033
- Table 12: Global Transparent Plaster Volume K Forecast, by Country 2020 & 2033
- Table 13: United States Transparent Plaster Revenue (undefined) Forecast, by Application 2020 & 2033
- Table 14: United States Transparent Plaster Volume (K) Forecast, by Application 2020 & 2033
- Table 15: Canada Transparent Plaster Revenue (undefined) Forecast, by Application 2020 & 2033
- Table 16: Canada Transparent Plaster Volume (K) Forecast, by Application 2020 & 2033
- Table 17: Mexico Transparent Plaster Revenue (undefined) Forecast, by Application 2020 & 2033
- Table 18: Mexico Transparent Plaster Volume (K) Forecast, by Application 2020 & 2033
- Table 19: Global Transparent Plaster Revenue undefined Forecast, by Application 2020 & 2033
- Table 20: Global Transparent Plaster Volume K Forecast, by Application 2020 & 2033
- Table 21: Global Transparent Plaster Revenue undefined Forecast, by Types 2020 & 2033
- Table 22: Global Transparent Plaster Volume K Forecast, by Types 2020 & 2033
- Table 23: Global Transparent Plaster Revenue undefined Forecast, by Country 2020 & 2033
- Table 24: Global Transparent Plaster Volume K Forecast, by Country 2020 & 2033
- Table 25: Brazil Transparent Plaster Revenue (undefined) Forecast, by Application 2020 & 2033
- Table 26: Brazil Transparent Plaster Volume (K) Forecast, by Application 2020 & 2033
- Table 27: Argentina Transparent Plaster Revenue (undefined) Forecast, by Application 2020 & 2033
- Table 28: Argentina Transparent Plaster Volume (K) Forecast, by Application 2020 & 2033
- Table 29: Rest of South America Transparent Plaster Revenue (undefined) Forecast, by Application 2020 & 2033
- Table 30: Rest of South America Transparent Plaster Volume (K) Forecast, by Application 2020 & 2033
- Table 31: Global Transparent Plaster Revenue undefined Forecast, by Application 2020 & 2033
- Table 32: Global Transparent Plaster Volume K Forecast, by Application 2020 & 2033
- Table 33: Global Transparent Plaster Revenue undefined Forecast, by Types 2020 & 2033
- Table 34: Global Transparent Plaster Volume K Forecast, by Types 2020 & 2033
- Table 35: Global Transparent Plaster Revenue undefined Forecast, by Country 2020 & 2033
- Table 36: Global Transparent Plaster Volume K Forecast, by Country 2020 & 2033
- Table 37: United Kingdom Transparent Plaster Revenue (undefined) Forecast, by Application 2020 & 2033
- Table 38: United Kingdom Transparent Plaster Volume (K) Forecast, by Application 2020 & 2033
- Table 39: Germany Transparent Plaster Revenue (undefined) Forecast, by Application 2020 & 2033
- Table 40: Germany Transparent Plaster Volume (K) Forecast, by Application 2020 & 2033
- Table 41: France Transparent Plaster Revenue (undefined) Forecast, by Application 2020 & 2033
- Table 42: France Transparent Plaster Volume (K) Forecast, by Application 2020 & 2033
- Table 43: Italy Transparent Plaster Revenue (undefined) Forecast, by Application 2020 & 2033
- Table 44: Italy Transparent Plaster Volume (K) Forecast, by Application 2020 & 2033
- Table 45: Spain Transparent Plaster Revenue (undefined) Forecast, by Application 2020 & 2033
- Table 46: Spain Transparent Plaster Volume (K) Forecast, by Application 2020 & 2033
- Table 47: Russia Transparent Plaster Revenue (undefined) Forecast, by Application 2020 & 2033
- Table 48: Russia Transparent Plaster Volume (K) Forecast, by Application 2020 & 2033
- Table 49: Benelux Transparent Plaster Revenue (undefined) Forecast, by Application 2020 & 2033
- Table 50: Benelux Transparent Plaster Volume (K) Forecast, by Application 2020 & 2033
- Table 51: Nordics Transparent Plaster Revenue (undefined) Forecast, by Application 2020 & 2033
- Table 52: Nordics Transparent Plaster Volume (K) Forecast, by Application 2020 & 2033
- Table 53: Rest of Europe Transparent Plaster Revenue (undefined) Forecast, by Application 2020 & 2033
- Table 54: Rest of Europe Transparent Plaster Volume (K) Forecast, by Application 2020 & 2033
- Table 55: Global Transparent Plaster Revenue undefined Forecast, by Application 2020 & 2033
- Table 56: Global Transparent Plaster Volume K Forecast, by Application 2020 & 2033
- Table 57: Global Transparent Plaster Revenue undefined Forecast, by Types 2020 & 2033
- Table 58: Global Transparent Plaster Volume K Forecast, by Types 2020 & 2033
- Table 59: Global Transparent Plaster Revenue undefined Forecast, by Country 2020 & 2033
- Table 60: Global Transparent Plaster Volume K Forecast, by Country 2020 & 2033
- Table 61: Turkey Transparent Plaster Revenue (undefined) Forecast, by Application 2020 & 2033
- Table 62: Turkey Transparent Plaster Volume (K) Forecast, by Application 2020 & 2033
- Table 63: Israel Transparent Plaster Revenue (undefined) Forecast, by Application 2020 & 2033
- Table 64: Israel Transparent Plaster Volume (K) Forecast, by Application 2020 & 2033
- Table 65: GCC Transparent Plaster Revenue (undefined) Forecast, by Application 2020 & 2033
- Table 66: GCC Transparent Plaster Volume (K) Forecast, by Application 2020 & 2033
- Table 67: North Africa Transparent Plaster Revenue (undefined) Forecast, by Application 2020 & 2033
- Table 68: North Africa Transparent Plaster Volume (K) Forecast, by Application 2020 & 2033
- Table 69: South Africa Transparent Plaster Revenue (undefined) Forecast, by Application 2020 & 2033
- Table 70: South Africa Transparent Plaster Volume (K) Forecast, by Application 2020 & 2033
- Table 71: Rest of Middle East & Africa Transparent Plaster Revenue (undefined) Forecast, by Application 2020 & 2033
- Table 72: Rest of Middle East & Africa Transparent Plaster Volume (K) Forecast, by Application 2020 & 2033
- Table 73: Global Transparent Plaster Revenue undefined Forecast, by Application 2020 & 2033
- Table 74: Global Transparent Plaster Volume K Forecast, by Application 2020 & 2033
- Table 75: Global Transparent Plaster Revenue undefined Forecast, by Types 2020 & 2033
- Table 76: Global Transparent Plaster Volume K Forecast, by Types 2020 & 2033
- Table 77: Global Transparent Plaster Revenue undefined Forecast, by Country 2020 & 2033
- Table 78: Global Transparent Plaster Volume K Forecast, by Country 2020 & 2033
- Table 79: China Transparent Plaster Revenue (undefined) Forecast, by Application 2020 & 2033
- Table 80: China Transparent Plaster Volume (K) Forecast, by Application 2020 & 2033
- Table 81: India Transparent Plaster Revenue (undefined) Forecast, by Application 2020 & 2033
- Table 82: India Transparent Plaster Volume (K) Forecast, by Application 2020 & 2033
- Table 83: Japan Transparent Plaster Revenue (undefined) Forecast, by Application 2020 & 2033
- Table 84: Japan Transparent Plaster Volume (K) Forecast, by Application 2020 & 2033
- Table 85: South Korea Transparent Plaster Revenue (undefined) Forecast, by Application 2020 & 2033
- Table 86: South Korea Transparent Plaster Volume (K) Forecast, by Application 2020 & 2033
- Table 87: ASEAN Transparent Plaster Revenue (undefined) Forecast, by Application 2020 & 2033
- Table 88: ASEAN Transparent Plaster Volume (K) Forecast, by Application 2020 & 2033
- Table 89: Oceania Transparent Plaster Revenue (undefined) Forecast, by Application 2020 & 2033
- Table 90: Oceania Transparent Plaster Volume (K) Forecast, by Application 2020 & 2033
- Table 91: Rest of Asia Pacific Transparent Plaster Revenue (undefined) Forecast, by Application 2020 & 2033
- Table 92: Rest of Asia Pacific Transparent Plaster Volume (K) Forecast, by Application 2020 & 2033
Frequently Asked Questions
1. What is the projected Compound Annual Growth Rate (CAGR) of the Transparent Plaster?
The projected CAGR is approximately 14.4%.
2. Which companies are prominent players in the Transparent Plaster?
Key companies in the market include Boots, Reliance Medical, Tesco, Sainsbury's, Robinson Healthcare(Vernacare), Paul Murray, Waitrose & Partners, Watsons, Morrisons, Steroplast Healthcare, Pharmacare, Banitore, Beiersdorf, 3M, Avanti Medical, Guardian Health & Beauty, LloydsPharmacy, Scholl's Wellness, Johnson & Johnson, Smith & Nephew, Medline Industries, Hartmann, Dynarex, Derma Sciences, Curad.
3. What are the main segments of the Transparent Plaster?
The market segments include Application, Types.
4. Can you provide details about the market size?
The market size is estimated to be USD XXX N/A as of 2022.
5. What are some drivers contributing to market growth?
N/A
6. What are the notable trends driving market growth?
N/A
7. Are there any restraints impacting market growth?
N/A
8. Can you provide examples of recent developments in the market?
N/A
9. What pricing options are available for accessing the report?
Pricing options include single-user, multi-user, and enterprise licenses priced at USD 3350.00, USD 5025.00, and USD 6700.00 respectively.
10. Is the market size provided in terms of value or volume?
The market size is provided in terms of value, measured in N/A and volume, measured in K.
11. Are there any specific market keywords associated with the report?
Yes, the market keyword associated with the report is "Transparent Plaster," which aids in identifying and referencing the specific market segment covered.
12. How do I determine which pricing option suits my needs best?
The pricing options vary based on user requirements and access needs. Individual users may opt for single-user licenses, while businesses requiring broader access may choose multi-user or enterprise licenses for cost-effective access to the report.
13. Are there any additional resources or data provided in the Transparent Plaster report?
While the report offers comprehensive insights, it's advisable to review the specific contents or supplementary materials provided to ascertain if additional resources or data are available.
14. How can I stay updated on further developments or reports in the Transparent Plaster?
To stay informed about further developments, trends, and reports in the Transparent Plaster, consider subscribing to industry newsletters, following relevant companies and organizations, or regularly checking reputable industry news sources and publications.
Methodology
Step 1 - Identification of Relevant Samples Size from Population Database


Step 2 - Approaches for Defining Global Market Size (Value, Volume* & Price*)

Note*: In applicable scenarios
Step 3 - Data Sources
Primary Research
- Web Analytics
- Survey Reports
- Research Institute
- Latest Research Reports
- Opinion Leaders
Secondary Research
- Annual Reports
- White Paper
- Latest Press Release
- Industry Association
- Paid Database
- Investor Presentations

Step 4 - Data Triangulation
Involves using different sources of information in order to increase the validity of a study
These sources are likely to be stakeholders in a program - participants, other researchers, program staff, other community members, and so on.
Then we put all data in single framework & apply various statistical tools to find out the dynamic on the market.
During the analysis stage, feedback from the stakeholder groups would be compared to determine areas of agreement as well as areas of divergence