

Key Insights
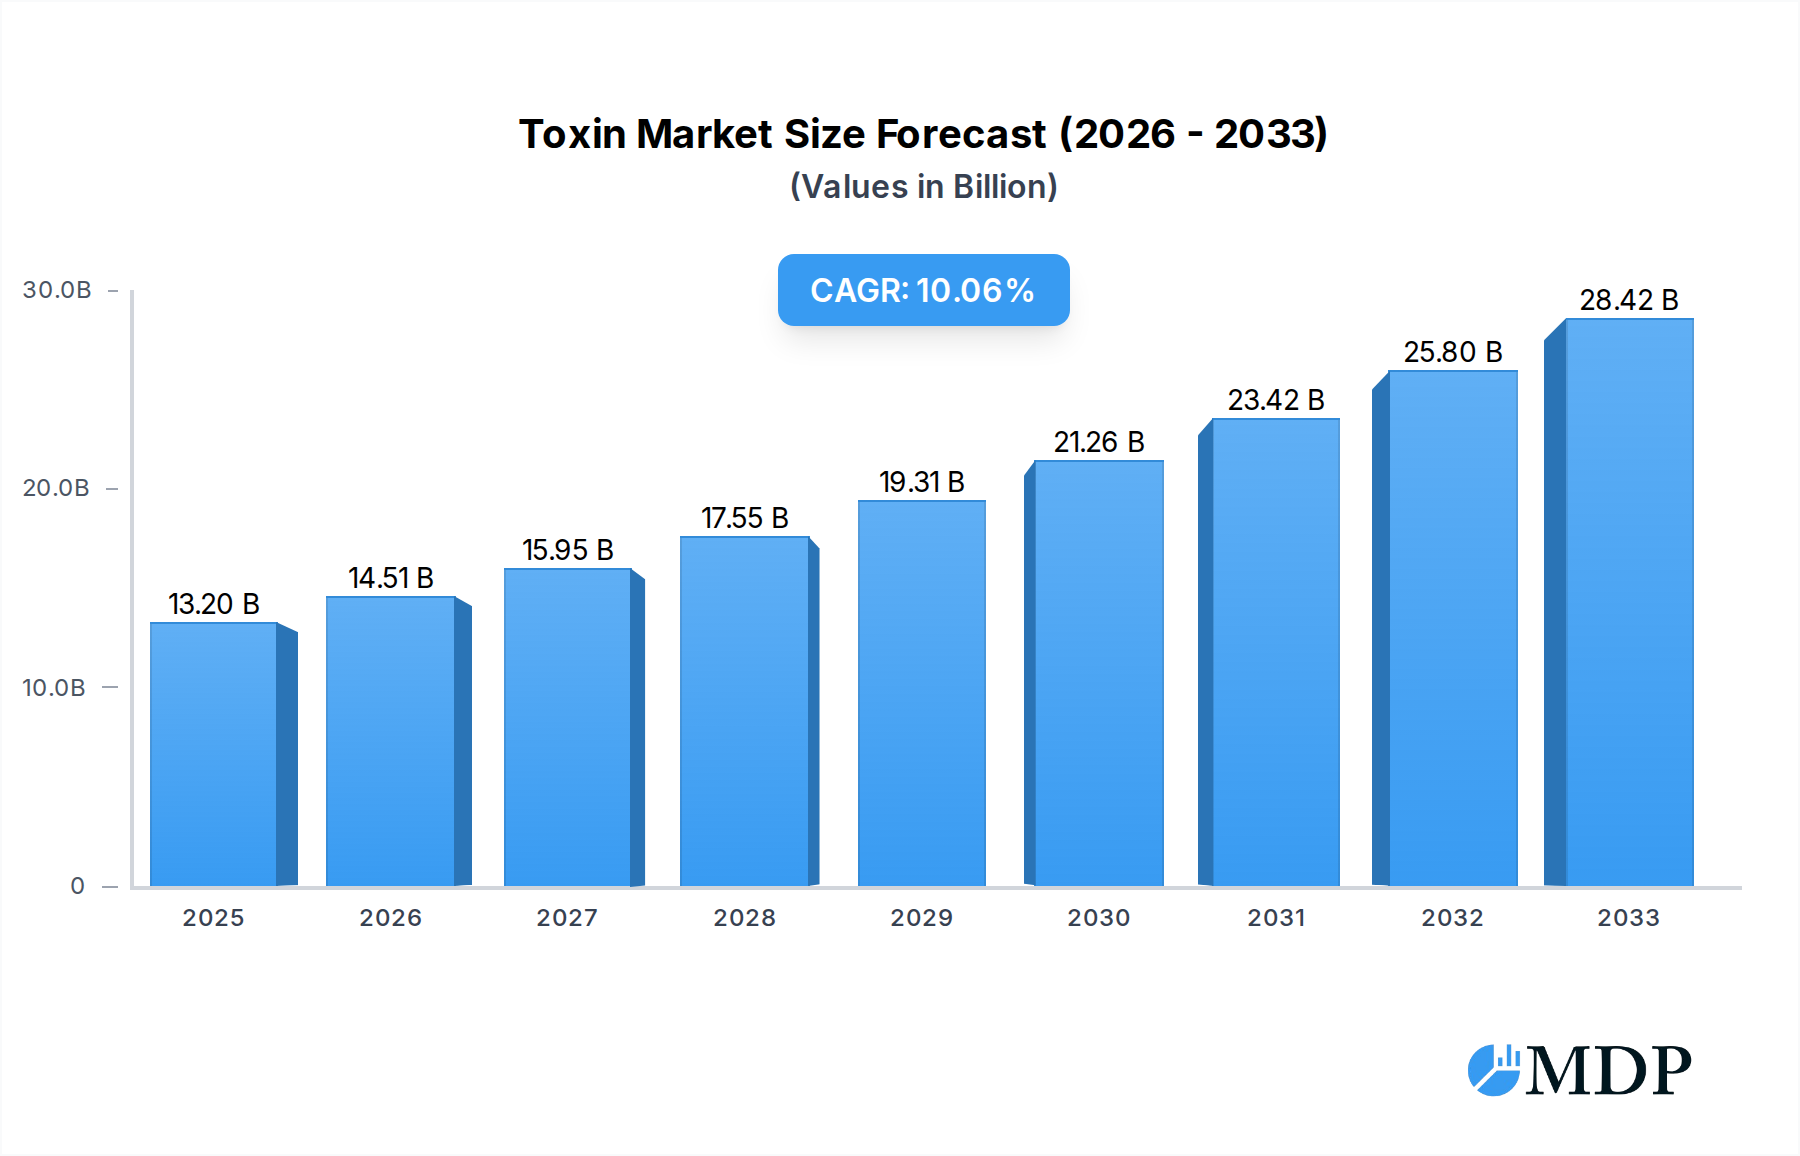
The global Toxin market is projected to reach an impressive $13.2 billion in 2025, exhibiting robust growth with a Compound Annual Growth Rate (CAGR) of 9.9% during the forecast period of 2025-2033. This significant expansion is primarily propelled by the escalating demand for minimally invasive aesthetic procedures, a growing awareness of the therapeutic applications of toxins in treating neurological disorders, and advancements in product development leading to enhanced efficacy and safety profiles. The medical segment, encompassing treatments for conditions like cervical dystonia, blepharospasm, and chronic migraine, is a substantial driver, fueled by an aging global population and an increased focus on improving quality of life. Concurrently, the cosmetic segment is experiencing a surge, driven by a desire for facial rejuvenation and wrinkle reduction, with a growing adoption among younger demographics seeking preventive aesthetic treatments. The market's dynamism is further supported by innovations in formulation and delivery systems, enhancing patient experience and treatment outcomes.

Toxin Market Size (In Billion)
The market is segmented into distinct product types, including 50U and 100U dosages, catering to varying treatment needs, alongside "Others" which likely encompass specialized formulations. Key players such as Allergan, Ipsen, Medytox, Merz Pharmaceuticals, and Daewoong are at the forefront, investing heavily in research and development, strategic partnerships, and market expansion initiatives to capture a larger market share. Geographically, North America and Europe currently dominate the market, driven by high disposable incomes, advanced healthcare infrastructure, and a strong patient inclination towards aesthetic and therapeutic toxin-based treatments. However, the Asia Pacific region is anticipated to witness the fastest growth, propelled by increasing medical tourism, rising awareness, and a burgeoning middle-class population seeking both cosmetic and medical interventions. Restraints, such as stringent regulatory approvals and the potential for adverse effects, are being addressed through continuous innovation and robust clinical trials.
Toxin Company Market Share
Unlocking the Billion-Dollar Toxin Market: Comprehensive Insights for Stakeholders (2019-2033)
This definitive report provides an in-depth analysis of the global Toxin market, projected to reach billions by 2025 and beyond. Covering the historical period of 2019-2024, the base year of 2025, and a comprehensive forecast period from 2025 to 2033, this research is indispensable for industry leaders, investors, and strategists seeking to capitalize on burgeoning opportunities. We dissect market dynamics, identify pivotal trends, and spotlight leading players and innovations within the medical and cosmetic toxin applications, including 50U, 100U, and Other Toxin types.
Toxin Market Dynamics & Concentration
The global Toxin market exhibits a moderately concentrated landscape, with key players like Allergan, Ipsen, and Medytox holding significant market share, estimated in the billions. Innovation remains a primary driver, fueled by continuous research into novel applications and improved delivery systems, contributing to an estimated billions in R&D investments annually. Regulatory frameworks, while robust, are evolving to accommodate new product approvals and safety standards, impacting market entry and expansion strategies. Product substitutes, such as alternative aesthetic procedures and pharmacological treatments for certain medical conditions, exert a competitive pressure, though the unique efficacy of toxins continues to drive demand. End-user trends are strongly influenced by rising disposable incomes, an aging global population, and an increasing aesthetic consciousness, propelling demand for both medical and cosmetic applications. Mergers and Acquisitions (M&A) activity is anticipated to remain strategic, with an estimated billions in deal value, as companies seek to consolidate market presence and acquire innovative technologies.
Toxin Industry Trends & Analysis
The global Toxin industry is poised for remarkable growth, with an estimated Compound Annual Growth Rate (CAGR) of billions percent projected from 2025 to 2033. This expansion is propelled by a confluence of factors, including a growing demand for minimally invasive aesthetic procedures and an increasing adoption of neurotoxins for various medical conditions such as chronic migraine, muscle spasticity, and hyperhidrosis. Technological disruptions are playing a crucial role, with advancements in purification techniques leading to safer and more effective toxin formulations. The development of novel delivery systems, including localized and long-acting formulations, is further enhancing treatment outcomes and patient compliance. Consumer preferences are increasingly shifting towards natural-looking results and personalized treatment plans, driving innovation in product efficacy and application techniques. Competitive dynamics within the market are characterized by intense R&D efforts, strategic partnerships, and a focus on expanding geographical reach. Market penetration is projected to surge, particularly in emerging economies, as awareness and accessibility of toxin-based treatments improve. The market is expected to witness substantial growth in its market size, estimated to reach billions by the end of the forecast period.
Leading Markets & Segments in Toxin
The Cosmetic segment is currently the dominant force within the global Toxin market, driven by a surge in elective aesthetic procedures worldwide. Within this segment, the 50U and 100U types represent the most frequently utilized dosages, catering to a broad spectrum of cosmetic enhancements. North America currently leads the market in terms of revenue, estimated in the billions, owing to a high prevalence of aesthetic consciousness, advanced healthcare infrastructure, and robust consumer spending power. Key economic policies supportive of the healthcare and beauty industries, coupled with well-established distribution networks, further solidify its dominance.
- Dominant Region: North America, accounting for an estimated billions in market share.
- Economic Policies: Favorable reimbursement policies for certain medical applications and high disposable incomes supporting cosmetic treatments.
- Infrastructure: Advanced healthcare facilities and a well-developed network for product distribution.
- Dominant Application Segment: Cosmetic applications, estimated to contribute billions to the market.
- Consumer Preferences: Growing demand for anti-aging solutions and non-surgical cosmetic enhancements.
- Technological Advancements: Development of improved formulations and injection techniques enhancing patient satisfaction.
- Dominant Toxin Types: 50U and 100U dosages, collectively representing an estimated billions in market value.
- Versatility: Suitability for a wide range of cosmetic and medical indications, offering flexibility to practitioners.
- Established Efficacy: Proven track record of safety and effectiveness in clinical practice.
Toxin Product Developments
Ongoing product developments in the Toxin market are centered on enhancing efficacy, safety, and patient convenience. Innovations include the creation of next-generation neurotoxin formulations with longer durations of action and reduced diffusion, thereby minimizing off-target effects and improving cosmetic outcomes. For medical applications, advancements are focused on optimizing treatment protocols for conditions like blepharospasm and cervical dystonia, offering more predictable and sustained relief. Competitive advantages are being forged through unique purification processes, proprietary delivery systems, and comprehensive clinical trial data supporting novel indications. Technological trends like targeted drug delivery and personalized medicine are influencing the development of specialized toxin products designed for specific patient profiles and treatment goals.
Key Drivers of Toxin Growth
The Toxin market is experiencing robust growth driven by several critical factors. Technologically, advancements in protein purification and recombinant DNA technology are leading to the development of purer and more potent toxin products. Economically, rising disposable incomes globally, particularly in emerging markets, are fueling demand for both cosmetic and medical aesthetic procedures. Regulatory factors, such as the approval of new indications for existing toxins and the streamlining of regulatory pathways for novel products, are also contributing to market expansion. The increasing awareness among consumers about the benefits and accessibility of toxin treatments, coupled with the growing aging population seeking rejuvenation, further amplifies growth.
Challenges in the Toxin Market
Despite its promising trajectory, the Toxin market faces several challenges. Regulatory hurdles remain a significant restraint, with stringent approval processes for new indications and geographical market entry demanding extensive clinical validation and substantial investment, estimated in the billions for comprehensive trials. Supply chain disruptions, exacerbated by global events, can impact the availability and cost of essential raw materials and finished products. Intense competitive pressures from established players and emerging biotechnological companies can lead to price erosion and necessitate continuous innovation to maintain market share. Furthermore, public perception and potential side effects associated with toxin use, although generally well-managed, require ongoing education and stringent safety protocols to mitigate risks and build trust, impacting patient adoption rates by an estimated billions.
Emerging Opportunities in Toxin
Emerging opportunities in the Toxin market are abundant and poised to drive long-term growth. Technological breakthroughs in areas such as targeted drug delivery systems and the development of novel toxin serotypes with unique therapeutic properties offer significant potential. Strategic partnerships between pharmaceutical companies, research institutions, and aesthetic clinics can accelerate the development and commercialization of new products and applications. Furthermore, market expansion into underserved geographical regions, particularly in Asia-Pacific and Latin America, presents a substantial opportunity as healthcare infrastructure improves and disposable incomes rise. The exploration of novel medical indications beyond aesthetics, such as in pain management and neurological disorders, is another significant growth catalyst, with an estimated billions in potential market value.
Leading Players in the Toxin Sector
- Allergan
- Ipsen
- Medytox
- LIBP
- Merz Pharmaceuticals
- US World Meds
- Hugel
- Daewoong
Key Milestones in Toxin Industry
- 2019: Approval of novel medical indication for existing toxin product, expanding treatment options.
- 2020: Major player announces significant investment in R&D for next-generation toxin formulations.
- 2021: Strategic merger between two key companies, consolidating market share and technological expertise.
- 2022: Launch of a new toxin product with enhanced purity and a longer duration of action.
- 2023: Significant clinical trial results published, supporting expanded use in chronic pain management.
- 2024: Entry of a new competitor with an innovative delivery system, increasing market competition.
Strategic Outlook for Toxin Market
The strategic outlook for the Toxin market remains exceptionally positive, fueled by sustained innovation and expanding applications. Growth accelerators include the increasing demand for minimally invasive cosmetic procedures, driven by aesthetic trends and an aging global population. The expanding therapeutic applications in the medical domain, for conditions ranging from neurological disorders to pain management, represent a significant untapped potential, estimated to contribute billions to future revenue streams. Companies that focus on developing safer, more effective, and patient-centric toxin products, coupled with strategic market penetration in emerging economies and strategic partnerships, will be well-positioned for sustained success in this dynamic and lucrative industry.
Toxin Segmentation
-
1. Application
- 1.1. Medical
- 1.2. Cosmetic
-
2. Types
- 2.1. 50U
- 2.2. 100U
- 2.3. Others
Toxin Segmentation By Geography
-
1. North America
- 1.1. United States
- 1.2. Canada
- 1.3. Mexico
-
2. South America
- 2.1. Brazil
- 2.2. Argentina
- 2.3. Rest of South America
-
3. Europe
- 3.1. United Kingdom
- 3.2. Germany
- 3.3. France
- 3.4. Italy
- 3.5. Spain
- 3.6. Russia
- 3.7. Benelux
- 3.8. Nordics
- 3.9. Rest of Europe
-
4. Middle East & Africa
- 4.1. Turkey
- 4.2. Israel
- 4.3. GCC
- 4.4. North Africa
- 4.5. South Africa
- 4.6. Rest of Middle East & Africa
-
5. Asia Pacific
- 5.1. China
- 5.2. India
- 5.3. Japan
- 5.4. South Korea
- 5.5. ASEAN
- 5.6. Oceania
- 5.7. Rest of Asia Pacific

Toxin Regional Market Share
Geographic Coverage of Toxin
Toxin REPORT HIGHLIGHTS
| Aspects | Details |
|---|---|
| Study Period | 2020-2034 |
| Base Year | 2025 |
| Estimated Year | 2026 |
| Forecast Period | 2026-2034 |
| Historical Period | 2020-2025 |
| Growth Rate | CAGR of 9.9% from 2020-2034 |
| Segmentation |
|
Table of Contents
- 1. Introduction
- 1.1. Research Scope
- 1.2. Market Segmentation
- 1.3. Research Methodology
- 1.4. Definitions and Assumptions
- 2. Executive Summary
- 2.1. Introduction
- 3. Market Dynamics
- 3.1. Introduction
- 3.2. Market Drivers
- 3.3. Market Restrains
- 3.4. Market Trends
- 4. Market Factor Analysis
- 4.1. Porters Five Forces
- 4.2. Supply/Value Chain
- 4.3. PESTEL analysis
- 4.4. Market Entropy
- 4.5. Patent/Trademark Analysis
- 5. Global Toxin Analysis, Insights and Forecast, 2020-2032
- 5.1. Market Analysis, Insights and Forecast - by Application
- 5.1.1. Medical
- 5.1.2. Cosmetic
- 5.2. Market Analysis, Insights and Forecast - by Types
- 5.2.1. 50U
- 5.2.2. 100U
- 5.2.3. Others
- 5.3. Market Analysis, Insights and Forecast - by Region
- 5.3.1. North America
- 5.3.2. South America
- 5.3.3. Europe
- 5.3.4. Middle East & Africa
- 5.3.5. Asia Pacific
- 5.1. Market Analysis, Insights and Forecast - by Application
- 6. North America Toxin Analysis, Insights and Forecast, 2020-2032
- 6.1. Market Analysis, Insights and Forecast - by Application
- 6.1.1. Medical
- 6.1.2. Cosmetic
- 6.2. Market Analysis, Insights and Forecast - by Types
- 6.2.1. 50U
- 6.2.2. 100U
- 6.2.3. Others
- 6.1. Market Analysis, Insights and Forecast - by Application
- 7. South America Toxin Analysis, Insights and Forecast, 2020-2032
- 7.1. Market Analysis, Insights and Forecast - by Application
- 7.1.1. Medical
- 7.1.2. Cosmetic
- 7.2. Market Analysis, Insights and Forecast - by Types
- 7.2.1. 50U
- 7.2.2. 100U
- 7.2.3. Others
- 7.1. Market Analysis, Insights and Forecast - by Application
- 8. Europe Toxin Analysis, Insights and Forecast, 2020-2032
- 8.1. Market Analysis, Insights and Forecast - by Application
- 8.1.1. Medical
- 8.1.2. Cosmetic
- 8.2. Market Analysis, Insights and Forecast - by Types
- 8.2.1. 50U
- 8.2.2. 100U
- 8.2.3. Others
- 8.1. Market Analysis, Insights and Forecast - by Application
- 9. Middle East & Africa Toxin Analysis, Insights and Forecast, 2020-2032
- 9.1. Market Analysis, Insights and Forecast - by Application
- 9.1.1. Medical
- 9.1.2. Cosmetic
- 9.2. Market Analysis, Insights and Forecast - by Types
- 9.2.1. 50U
- 9.2.2. 100U
- 9.2.3. Others
- 9.1. Market Analysis, Insights and Forecast - by Application
- 10. Asia Pacific Toxin Analysis, Insights and Forecast, 2020-2032
- 10.1. Market Analysis, Insights and Forecast - by Application
- 10.1.1. Medical
- 10.1.2. Cosmetic
- 10.2. Market Analysis, Insights and Forecast - by Types
- 10.2.1. 50U
- 10.2.2. 100U
- 10.2.3. Others
- 10.1. Market Analysis, Insights and Forecast - by Application
- 11. Competitive Analysis
- 11.1. Global Market Share Analysis 2025
- 11.2. Company Profiles
- 11.2.1 Allergan
- 11.2.1.1. Overview
- 11.2.1.2. Products
- 11.2.1.3. SWOT Analysis
- 11.2.1.4. Recent Developments
- 11.2.1.5. Financials (Based on Availability)
- 11.2.2 Ipsen
- 11.2.2.1. Overview
- 11.2.2.2. Products
- 11.2.2.3. SWOT Analysis
- 11.2.2.4. Recent Developments
- 11.2.2.5. Financials (Based on Availability)
- 11.2.3 Medytox
- 11.2.3.1. Overview
- 11.2.3.2. Products
- 11.2.3.3. SWOT Analysis
- 11.2.3.4. Recent Developments
- 11.2.3.5. Financials (Based on Availability)
- 11.2.4 LIBP
- 11.2.4.1. Overview
- 11.2.4.2. Products
- 11.2.4.3. SWOT Analysis
- 11.2.4.4. Recent Developments
- 11.2.4.5. Financials (Based on Availability)
- 11.2.5 Merz Pharmaceuticals
- 11.2.5.1. Overview
- 11.2.5.2. Products
- 11.2.5.3. SWOT Analysis
- 11.2.5.4. Recent Developments
- 11.2.5.5. Financials (Based on Availability)
- 11.2.6 US World Meds
- 11.2.6.1. Overview
- 11.2.6.2. Products
- 11.2.6.3. SWOT Analysis
- 11.2.6.4. Recent Developments
- 11.2.6.5. Financials (Based on Availability)
- 11.2.7 Hugel
- 11.2.7.1. Overview
- 11.2.7.2. Products
- 11.2.7.3. SWOT Analysis
- 11.2.7.4. Recent Developments
- 11.2.7.5. Financials (Based on Availability)
- 11.2.8 Daewoong
- 11.2.8.1. Overview
- 11.2.8.2. Products
- 11.2.8.3. SWOT Analysis
- 11.2.8.4. Recent Developments
- 11.2.8.5. Financials (Based on Availability)
- 11.2.1 Allergan
List of Figures
- Figure 1: Global Toxin Revenue Breakdown (billion, %) by Region 2025 & 2033
- Figure 2: Global Toxin Volume Breakdown (K, %) by Region 2025 & 2033
- Figure 3: North America Toxin Revenue (billion), by Application 2025 & 2033
- Figure 4: North America Toxin Volume (K), by Application 2025 & 2033
- Figure 5: North America Toxin Revenue Share (%), by Application 2025 & 2033
- Figure 6: North America Toxin Volume Share (%), by Application 2025 & 2033
- Figure 7: North America Toxin Revenue (billion), by Types 2025 & 2033
- Figure 8: North America Toxin Volume (K), by Types 2025 & 2033
- Figure 9: North America Toxin Revenue Share (%), by Types 2025 & 2033
- Figure 10: North America Toxin Volume Share (%), by Types 2025 & 2033
- Figure 11: North America Toxin Revenue (billion), by Country 2025 & 2033
- Figure 12: North America Toxin Volume (K), by Country 2025 & 2033
- Figure 13: North America Toxin Revenue Share (%), by Country 2025 & 2033
- Figure 14: North America Toxin Volume Share (%), by Country 2025 & 2033
- Figure 15: South America Toxin Revenue (billion), by Application 2025 & 2033
- Figure 16: South America Toxin Volume (K), by Application 2025 & 2033
- Figure 17: South America Toxin Revenue Share (%), by Application 2025 & 2033
- Figure 18: South America Toxin Volume Share (%), by Application 2025 & 2033
- Figure 19: South America Toxin Revenue (billion), by Types 2025 & 2033
- Figure 20: South America Toxin Volume (K), by Types 2025 & 2033
- Figure 21: South America Toxin Revenue Share (%), by Types 2025 & 2033
- Figure 22: South America Toxin Volume Share (%), by Types 2025 & 2033
- Figure 23: South America Toxin Revenue (billion), by Country 2025 & 2033
- Figure 24: South America Toxin Volume (K), by Country 2025 & 2033
- Figure 25: South America Toxin Revenue Share (%), by Country 2025 & 2033
- Figure 26: South America Toxin Volume Share (%), by Country 2025 & 2033
- Figure 27: Europe Toxin Revenue (billion), by Application 2025 & 2033
- Figure 28: Europe Toxin Volume (K), by Application 2025 & 2033
- Figure 29: Europe Toxin Revenue Share (%), by Application 2025 & 2033
- Figure 30: Europe Toxin Volume Share (%), by Application 2025 & 2033
- Figure 31: Europe Toxin Revenue (billion), by Types 2025 & 2033
- Figure 32: Europe Toxin Volume (K), by Types 2025 & 2033
- Figure 33: Europe Toxin Revenue Share (%), by Types 2025 & 2033
- Figure 34: Europe Toxin Volume Share (%), by Types 2025 & 2033
- Figure 35: Europe Toxin Revenue (billion), by Country 2025 & 2033
- Figure 36: Europe Toxin Volume (K), by Country 2025 & 2033
- Figure 37: Europe Toxin Revenue Share (%), by Country 2025 & 2033
- Figure 38: Europe Toxin Volume Share (%), by Country 2025 & 2033
- Figure 39: Middle East & Africa Toxin Revenue (billion), by Application 2025 & 2033
- Figure 40: Middle East & Africa Toxin Volume (K), by Application 2025 & 2033
- Figure 41: Middle East & Africa Toxin Revenue Share (%), by Application 2025 & 2033
- Figure 42: Middle East & Africa Toxin Volume Share (%), by Application 2025 & 2033
- Figure 43: Middle East & Africa Toxin Revenue (billion), by Types 2025 & 2033
- Figure 44: Middle East & Africa Toxin Volume (K), by Types 2025 & 2033
- Figure 45: Middle East & Africa Toxin Revenue Share (%), by Types 2025 & 2033
- Figure 46: Middle East & Africa Toxin Volume Share (%), by Types 2025 & 2033
- Figure 47: Middle East & Africa Toxin Revenue (billion), by Country 2025 & 2033
- Figure 48: Middle East & Africa Toxin Volume (K), by Country 2025 & 2033
- Figure 49: Middle East & Africa Toxin Revenue Share (%), by Country 2025 & 2033
- Figure 50: Middle East & Africa Toxin Volume Share (%), by Country 2025 & 2033
- Figure 51: Asia Pacific Toxin Revenue (billion), by Application 2025 & 2033
- Figure 52: Asia Pacific Toxin Volume (K), by Application 2025 & 2033
- Figure 53: Asia Pacific Toxin Revenue Share (%), by Application 2025 & 2033
- Figure 54: Asia Pacific Toxin Volume Share (%), by Application 2025 & 2033
- Figure 55: Asia Pacific Toxin Revenue (billion), by Types 2025 & 2033
- Figure 56: Asia Pacific Toxin Volume (K), by Types 2025 & 2033
- Figure 57: Asia Pacific Toxin Revenue Share (%), by Types 2025 & 2033
- Figure 58: Asia Pacific Toxin Volume Share (%), by Types 2025 & 2033
- Figure 59: Asia Pacific Toxin Revenue (billion), by Country 2025 & 2033
- Figure 60: Asia Pacific Toxin Volume (K), by Country 2025 & 2033
- Figure 61: Asia Pacific Toxin Revenue Share (%), by Country 2025 & 2033
- Figure 62: Asia Pacific Toxin Volume Share (%), by Country 2025 & 2033
List of Tables
- Table 1: Global Toxin Revenue billion Forecast, by Application 2020 & 2033
- Table 2: Global Toxin Volume K Forecast, by Application 2020 & 2033
- Table 3: Global Toxin Revenue billion Forecast, by Types 2020 & 2033
- Table 4: Global Toxin Volume K Forecast, by Types 2020 & 2033
- Table 5: Global Toxin Revenue billion Forecast, by Region 2020 & 2033
- Table 6: Global Toxin Volume K Forecast, by Region 2020 & 2033
- Table 7: Global Toxin Revenue billion Forecast, by Application 2020 & 2033
- Table 8: Global Toxin Volume K Forecast, by Application 2020 & 2033
- Table 9: Global Toxin Revenue billion Forecast, by Types 2020 & 2033
- Table 10: Global Toxin Volume K Forecast, by Types 2020 & 2033
- Table 11: Global Toxin Revenue billion Forecast, by Country 2020 & 2033
- Table 12: Global Toxin Volume K Forecast, by Country 2020 & 2033
- Table 13: United States Toxin Revenue (billion) Forecast, by Application 2020 & 2033
- Table 14: United States Toxin Volume (K) Forecast, by Application 2020 & 2033
- Table 15: Canada Toxin Revenue (billion) Forecast, by Application 2020 & 2033
- Table 16: Canada Toxin Volume (K) Forecast, by Application 2020 & 2033
- Table 17: Mexico Toxin Revenue (billion) Forecast, by Application 2020 & 2033
- Table 18: Mexico Toxin Volume (K) Forecast, by Application 2020 & 2033
- Table 19: Global Toxin Revenue billion Forecast, by Application 2020 & 2033
- Table 20: Global Toxin Volume K Forecast, by Application 2020 & 2033
- Table 21: Global Toxin Revenue billion Forecast, by Types 2020 & 2033
- Table 22: Global Toxin Volume K Forecast, by Types 2020 & 2033
- Table 23: Global Toxin Revenue billion Forecast, by Country 2020 & 2033
- Table 24: Global Toxin Volume K Forecast, by Country 2020 & 2033
- Table 25: Brazil Toxin Revenue (billion) Forecast, by Application 2020 & 2033
- Table 26: Brazil Toxin Volume (K) Forecast, by Application 2020 & 2033
- Table 27: Argentina Toxin Revenue (billion) Forecast, by Application 2020 & 2033
- Table 28: Argentina Toxin Volume (K) Forecast, by Application 2020 & 2033
- Table 29: Rest of South America Toxin Revenue (billion) Forecast, by Application 2020 & 2033
- Table 30: Rest of South America Toxin Volume (K) Forecast, by Application 2020 & 2033
- Table 31: Global Toxin Revenue billion Forecast, by Application 2020 & 2033
- Table 32: Global Toxin Volume K Forecast, by Application 2020 & 2033
- Table 33: Global Toxin Revenue billion Forecast, by Types 2020 & 2033
- Table 34: Global Toxin Volume K Forecast, by Types 2020 & 2033
- Table 35: Global Toxin Revenue billion Forecast, by Country 2020 & 2033
- Table 36: Global Toxin Volume K Forecast, by Country 2020 & 2033
- Table 37: United Kingdom Toxin Revenue (billion) Forecast, by Application 2020 & 2033
- Table 38: United Kingdom Toxin Volume (K) Forecast, by Application 2020 & 2033
- Table 39: Germany Toxin Revenue (billion) Forecast, by Application 2020 & 2033
- Table 40: Germany Toxin Volume (K) Forecast, by Application 2020 & 2033
- Table 41: France Toxin Revenue (billion) Forecast, by Application 2020 & 2033
- Table 42: France Toxin Volume (K) Forecast, by Application 2020 & 2033
- Table 43: Italy Toxin Revenue (billion) Forecast, by Application 2020 & 2033
- Table 44: Italy Toxin Volume (K) Forecast, by Application 2020 & 2033
- Table 45: Spain Toxin Revenue (billion) Forecast, by Application 2020 & 2033
- Table 46: Spain Toxin Volume (K) Forecast, by Application 2020 & 2033
- Table 47: Russia Toxin Revenue (billion) Forecast, by Application 2020 & 2033
- Table 48: Russia Toxin Volume (K) Forecast, by Application 2020 & 2033
- Table 49: Benelux Toxin Revenue (billion) Forecast, by Application 2020 & 2033
- Table 50: Benelux Toxin Volume (K) Forecast, by Application 2020 & 2033
- Table 51: Nordics Toxin Revenue (billion) Forecast, by Application 2020 & 2033
- Table 52: Nordics Toxin Volume (K) Forecast, by Application 2020 & 2033
- Table 53: Rest of Europe Toxin Revenue (billion) Forecast, by Application 2020 & 2033
- Table 54: Rest of Europe Toxin Volume (K) Forecast, by Application 2020 & 2033
- Table 55: Global Toxin Revenue billion Forecast, by Application 2020 & 2033
- Table 56: Global Toxin Volume K Forecast, by Application 2020 & 2033
- Table 57: Global Toxin Revenue billion Forecast, by Types 2020 & 2033
- Table 58: Global Toxin Volume K Forecast, by Types 2020 & 2033
- Table 59: Global Toxin Revenue billion Forecast, by Country 2020 & 2033
- Table 60: Global Toxin Volume K Forecast, by Country 2020 & 2033
- Table 61: Turkey Toxin Revenue (billion) Forecast, by Application 2020 & 2033
- Table 62: Turkey Toxin Volume (K) Forecast, by Application 2020 & 2033
- Table 63: Israel Toxin Revenue (billion) Forecast, by Application 2020 & 2033
- Table 64: Israel Toxin Volume (K) Forecast, by Application 2020 & 2033
- Table 65: GCC Toxin Revenue (billion) Forecast, by Application 2020 & 2033
- Table 66: GCC Toxin Volume (K) Forecast, by Application 2020 & 2033
- Table 67: North Africa Toxin Revenue (billion) Forecast, by Application 2020 & 2033
- Table 68: North Africa Toxin Volume (K) Forecast, by Application 2020 & 2033
- Table 69: South Africa Toxin Revenue (billion) Forecast, by Application 2020 & 2033
- Table 70: South Africa Toxin Volume (K) Forecast, by Application 2020 & 2033
- Table 71: Rest of Middle East & Africa Toxin Revenue (billion) Forecast, by Application 2020 & 2033
- Table 72: Rest of Middle East & Africa Toxin Volume (K) Forecast, by Application 2020 & 2033
- Table 73: Global Toxin Revenue billion Forecast, by Application 2020 & 2033
- Table 74: Global Toxin Volume K Forecast, by Application 2020 & 2033
- Table 75: Global Toxin Revenue billion Forecast, by Types 2020 & 2033
- Table 76: Global Toxin Volume K Forecast, by Types 2020 & 2033
- Table 77: Global Toxin Revenue billion Forecast, by Country 2020 & 2033
- Table 78: Global Toxin Volume K Forecast, by Country 2020 & 2033
- Table 79: China Toxin Revenue (billion) Forecast, by Application 2020 & 2033
- Table 80: China Toxin Volume (K) Forecast, by Application 2020 & 2033
- Table 81: India Toxin Revenue (billion) Forecast, by Application 2020 & 2033
- Table 82: India Toxin Volume (K) Forecast, by Application 2020 & 2033
- Table 83: Japan Toxin Revenue (billion) Forecast, by Application 2020 & 2033
- Table 84: Japan Toxin Volume (K) Forecast, by Application 2020 & 2033
- Table 85: South Korea Toxin Revenue (billion) Forecast, by Application 2020 & 2033
- Table 86: South Korea Toxin Volume (K) Forecast, by Application 2020 & 2033
- Table 87: ASEAN Toxin Revenue (billion) Forecast, by Application 2020 & 2033
- Table 88: ASEAN Toxin Volume (K) Forecast, by Application 2020 & 2033
- Table 89: Oceania Toxin Revenue (billion) Forecast, by Application 2020 & 2033
- Table 90: Oceania Toxin Volume (K) Forecast, by Application 2020 & 2033
- Table 91: Rest of Asia Pacific Toxin Revenue (billion) Forecast, by Application 2020 & 2033
- Table 92: Rest of Asia Pacific Toxin Volume (K) Forecast, by Application 2020 & 2033
Frequently Asked Questions
1. What is the projected Compound Annual Growth Rate (CAGR) of the Toxin?
The projected CAGR is approximately 9.9%.
2. Which companies are prominent players in the Toxin?
Key companies in the market include Allergan, Ipsen, Medytox, LIBP, Merz Pharmaceuticals, US World Meds, Hugel, Daewoong.
3. What are the main segments of the Toxin?
The market segments include Application, Types.
4. Can you provide details about the market size?
The market size is estimated to be USD 13.2 billion as of 2022.
5. What are some drivers contributing to market growth?
N/A
6. What are the notable trends driving market growth?
N/A
7. Are there any restraints impacting market growth?
N/A
8. Can you provide examples of recent developments in the market?
N/A
9. What pricing options are available for accessing the report?
Pricing options include single-user, multi-user, and enterprise licenses priced at USD 3350.00, USD 5025.00, and USD 6700.00 respectively.
10. Is the market size provided in terms of value or volume?
The market size is provided in terms of value, measured in billion and volume, measured in K.
11. Are there any specific market keywords associated with the report?
Yes, the market keyword associated with the report is "Toxin," which aids in identifying and referencing the specific market segment covered.
12. How do I determine which pricing option suits my needs best?
The pricing options vary based on user requirements and access needs. Individual users may opt for single-user licenses, while businesses requiring broader access may choose multi-user or enterprise licenses for cost-effective access to the report.
13. Are there any additional resources or data provided in the Toxin report?
While the report offers comprehensive insights, it's advisable to review the specific contents or supplementary materials provided to ascertain if additional resources or data are available.
14. How can I stay updated on further developments or reports in the Toxin?
To stay informed about further developments, trends, and reports in the Toxin, consider subscribing to industry newsletters, following relevant companies and organizations, or regularly checking reputable industry news sources and publications.
Methodology
Step 1 - Identification of Relevant Samples Size from Population Database


Step 2 - Approaches for Defining Global Market Size (Value, Volume* & Price*)

Note*: In applicable scenarios
Step 3 - Data Sources
Primary Research
- Web Analytics
- Survey Reports
- Research Institute
- Latest Research Reports
- Opinion Leaders
Secondary Research
- Annual Reports
- White Paper
- Latest Press Release
- Industry Association
- Paid Database
- Investor Presentations

Step 4 - Data Triangulation
Involves using different sources of information in order to increase the validity of a study
These sources are likely to be stakeholders in a program - participants, other researchers, program staff, other community members, and so on.
Then we put all data in single framework & apply various statistical tools to find out the dynamic on the market.
During the analysis stage, feedback from the stakeholder groups would be compared to determine areas of agreement as well as areas of divergence