

Key Insights
The Telemedicine Carts Systems market is poised for significant expansion, projected to reach $2.04 billion in 2025. This robust growth is fueled by an impressive CAGR of 18.5% from 2019 to 2033, indicating a dynamic and rapidly evolving sector. A primary driver is the increasing demand for remote patient monitoring and virtual healthcare solutions, accelerated by recent global health events and a growing acceptance of telehealth. The integration of advanced technologies such as AI-powered diagnostics and sophisticated communication tools within these carts is enhancing their utility across diverse healthcare settings. Furthermore, the push for improved healthcare accessibility in underserved and remote areas, coupled with the need for efficient patient management in bustling clinics and hospitals, directly contributes to market expansion. The "Other" application segment, encompassing disaster relief and field medical training, also presents a burgeoning opportunity as organizations increasingly rely on mobile and adaptable healthcare delivery systems.
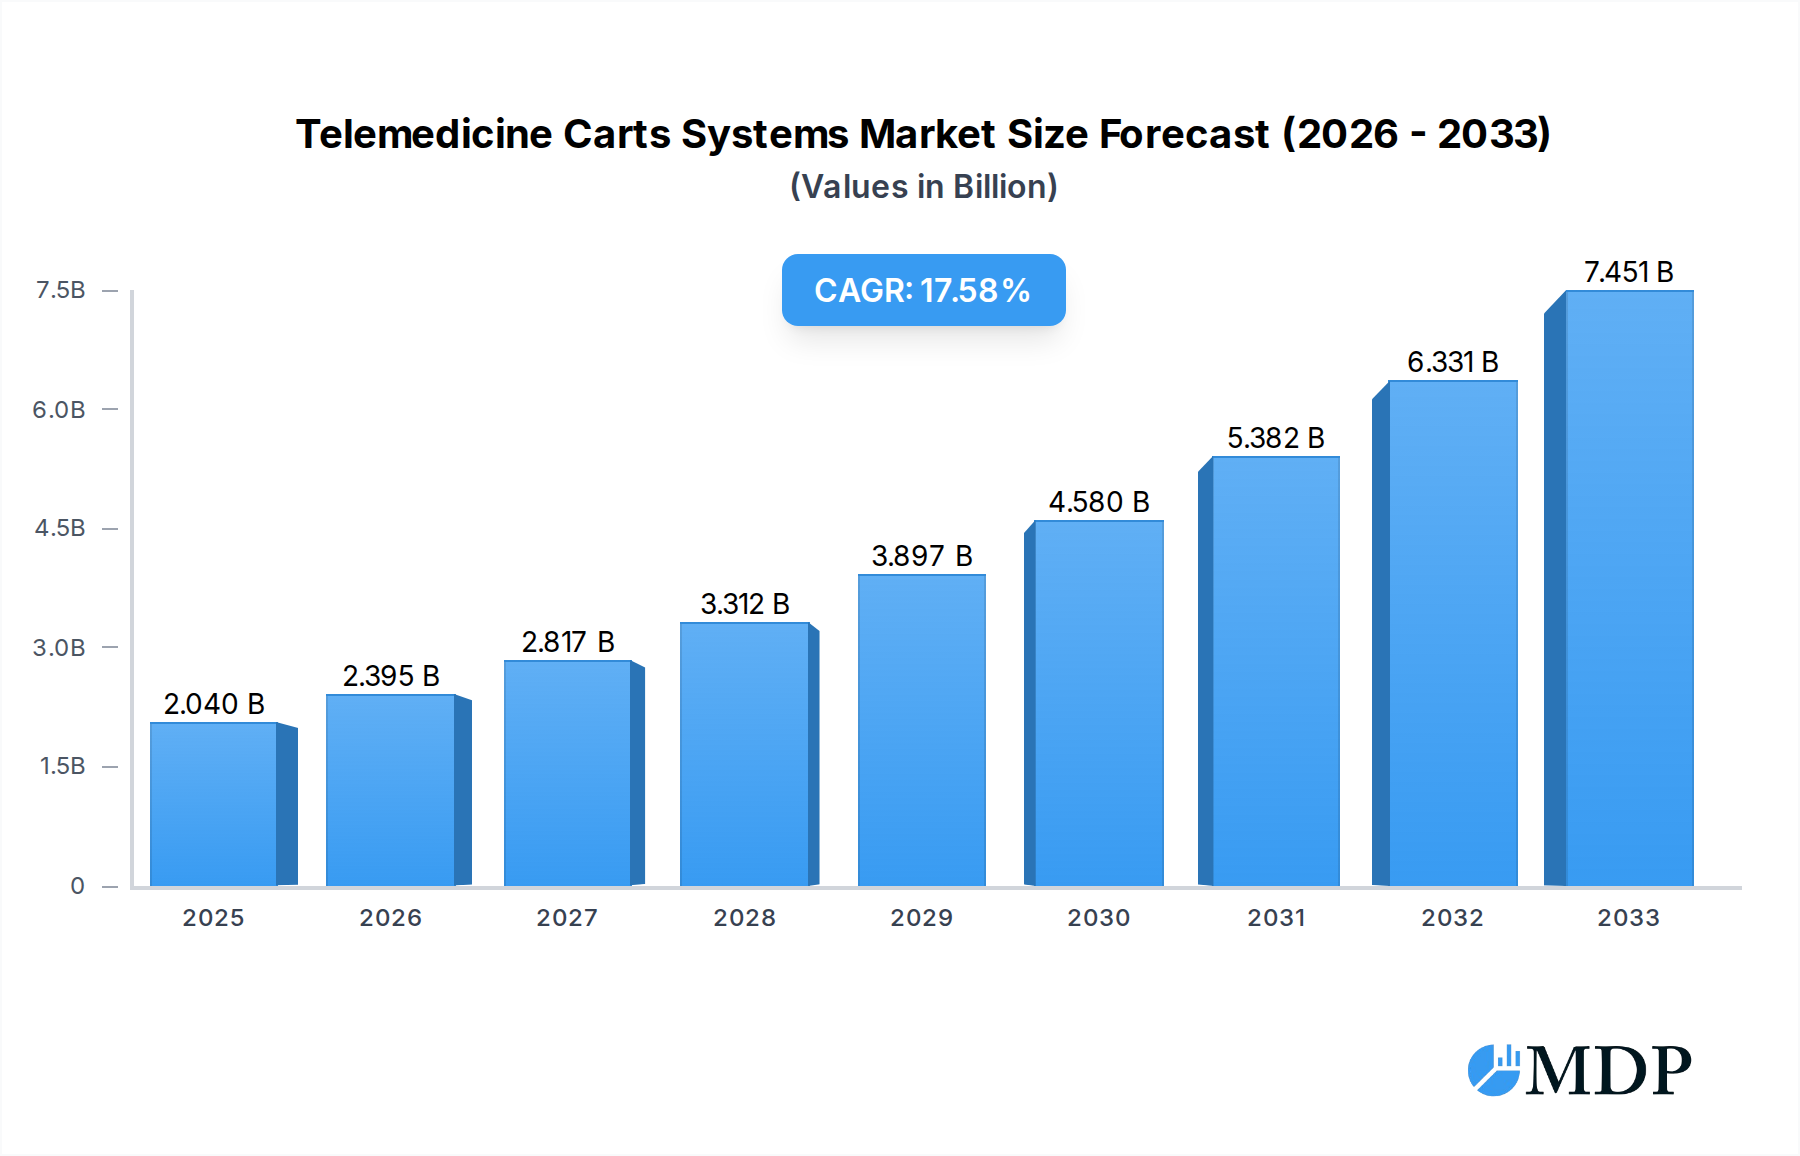
Telemedicine Carts Systems Market Size (In Billion)
The market's trajectory is further supported by key trends such as the miniaturization of medical devices, enhanced mobility of telemedicine carts, and the development of user-friendly interfaces for both healthcare professionals and patients. These advancements are making telehealth more practical and integrated into daily healthcare workflows. However, the market also faces certain restraints, including initial high implementation costs for advanced systems and the ongoing challenge of ensuring robust data security and patient privacy, which remain critical concerns for widespread adoption. Regulatory hurdles and the need for standardized protocols across different regions can also present complexities. Despite these challenges, the overwhelming demand for cost-effective, accessible, and high-quality healthcare solutions is expected to propel the Telemedicine Carts Systems market to new heights, with strong contributions expected from segments like "For Remote Consultation" and "For Illness Diagnose."

Telemedicine Carts Systems Company Market Share
Telemedicine Carts Systems Market Overview
This comprehensive report delves into the Telemedicine Carts Systems market, a critical component of modern healthcare delivery. The study spans from 2019 to 2033, with a base year of 2025 and a forecast period from 2025 to 2033, examining historical trends from 2019 to 2024. We provide in-depth analysis of market dynamics, industry trends, leading segments, product developments, growth drivers, challenges, emerging opportunities, key players, historical milestones, and a strategic outlook. Our analysis incorporates high-traffic keywords such as "telemedicine carts," "healthcare technology," "remote patient monitoring," "medical carts," "digital health solutions," and "clinical mobility systems" to ensure maximum search visibility and engagement with industry stakeholders including healthcare providers, technology manufacturers, investors, and policymakers. The global market is projected to reach several billion dollars in value, with significant growth anticipated across various applications and types of telemedicine carts.
Telemedicine Carts Systems Market Dynamics & Concentration
The Telemedicine Carts Systems market exhibits a moderate to high degree of concentration, with a few key players holding significant market share, estimated to be around 60 billion. Innovation is a primary driver, fueled by advancements in telecommunication technologies, miniaturization of medical devices, and the increasing demand for remote healthcare solutions. Regulatory frameworks, such as those established by the FDA and other global health organizations, are increasingly shaping product development and market entry strategies. The market is also influenced by the availability of product substitutes, including standalone telemedicine devices and integrated hospital IT systems, though specialized telemedicine carts offer unique advantages in mobility and integrated functionality. End-user trends are strongly leaning towards the adoption of integrated solutions that enhance patient care accessibility and clinician efficiency, particularly in underserved areas and during public health emergencies. Merger and acquisition (M&A) activities have been moderate, with approximately 50 deals recorded in the historical period, indicating consolidation and strategic expansion efforts by leading companies to broaden their product portfolios and geographic reach.
Telemedicine Carts Systems Industry Trends & Analysis
The Telemedicine Carts Systems industry is experiencing robust growth, driven by several interconnected trends. The escalating global demand for accessible and convenient healthcare services, amplified by aging populations and the prevalence of chronic diseases, is a primary growth driver. Technological disruptions, including the rapid integration of AI-powered diagnostics, high-definition video conferencing capabilities, and advanced sensor technologies into telemedicine carts, are transforming the capabilities and applications of these systems. Consumer preferences are shifting towards personalized and proactive healthcare, with a strong inclination towards remote consultations and monitoring that reduce the need for in-person visits. This trend is further bolstered by increased digital literacy and comfort with virtual interactions. Competitive dynamics within the market are characterized by innovation races and strategic partnerships aimed at capturing market share. The Compound Annual Growth Rate (CAGR) is estimated to be around 15%, projecting significant market expansion. Market penetration for telemedicine carts is expected to rise from approximately 30% in the historical period to over 70% by the end of the forecast period, reflecting widespread adoption across diverse healthcare settings. The increasing adoption of telehealth platforms, spurred by favorable government reimbursements and a growing recognition of their cost-effectiveness and efficiency, is also a substantial contributor to market growth.
Leading Markets & Segments in Telemedicine Carts Systems
The dominant region for Telemedicine Carts Systems is North America, primarily driven by the United States, which accounts for an estimated 45 billion in market value. Key drivers for this dominance include a well-established healthcare infrastructure, significant investment in healthcare technology, favorable reimbursement policies for telemedicine services, and a high adoption rate of digital health solutions. Within applications, Clinic & Hospitals is the leading segment, representing approximately 70% of the market share, valued at over 40 billion. This is due to the widespread integration of telemedicine carts into existing clinical workflows for patient consultations, remote diagnostics, and intra-hospital patient management.
Application Segments:
- Clinic & Hospitals: Dominant due to widespread adoption in patient care, remote specialist consultations, and acute care settings.
- Field Medical Training: Growing segment, leveraging carts for remote instruction and simulation in diverse environments.
- Earthquake Relief: Crucial for rapid deployment of medical services in disaster-stricken areas, demonstrating the essential nature of mobile healthcare units.
- Other: Includes niche applications like elder care facilities and specialized mobile clinics.
Type Segments:
- For Remote Consultation: The largest segment, valued at over 50 billion, driven by the increasing demand for virtual patient visits.
- For Illness Diagnose: A rapidly growing segment, incorporating advanced diagnostic tools and sensors for remote identification of medical conditions.
- Other: Encompasses carts for specialized procedures or data collection.
Economic policies supporting telehealth expansion and robust healthcare IT infrastructure further solidify North America's leading position. Asia-Pacific is emerging as a significant growth region, with countries like China and India demonstrating increasing adoption driven by government initiatives and a vast population requiring improved healthcare access.
Telemedicine Carts Systems Product Developments
Recent product developments in Telemedicine Carts Systems focus on enhancing mobility, integrating advanced diagnostic tools, and improving user experience. Innovations include lighter, more ergonomic designs for easier maneuverability, extended battery life for uninterrupted use, and the seamless integration of high-resolution cameras, vital sign monitors, and even point-of-care diagnostic devices. Companies are also developing carts with enhanced cybersecurity features to protect patient data and improved connectivity options for reliable video conferencing and data transmission. These advancements aim to create more versatile and efficient mobile healthcare workstations, offering competitive advantages in clinical settings by improving workflow efficiency and enabling a wider range of remote patient care activities.
Key Drivers of Telemedicine Carts Systems Growth
The growth of the Telemedicine Carts Systems market is propelled by several key factors. Technologically, the ongoing advancements in 5G connectivity, artificial intelligence for diagnostic assistance, and the miniaturization of medical devices are enabling more sophisticated and integrated telemedicine solutions. Economically, the increasing healthcare expenditure globally, coupled with the need for cost-effective healthcare delivery models, drives the adoption of telemedicine carts to reduce hospital readmissions and optimize resource allocation. Regulatory support, including favorable reimbursement policies for telehealth services and government initiatives promoting digital health adoption, further accelerates market growth. The undeniable need for expanded healthcare access in remote and underserved areas also serves as a significant growth catalyst, ensuring that quality medical care can reach more individuals.
Challenges in the Telemedicine Carts Systems Market
Despite its promising growth, the Telemedicine Carts Systems market faces several challenges. Regulatory hurdles, including the complexity of cross-border telemedicine regulations and evolving data privacy laws (e.g., HIPAA compliance), can impede market expansion and increase compliance costs. Supply chain issues, exacerbated by global events, can lead to production delays and increased component costs for manufacturers. Competitive pressures from both established players and new entrants necessitate continuous innovation and cost management. Furthermore, the initial investment cost for advanced telemedicine carts can be a barrier for smaller healthcare facilities or those with limited budgets, impacting market penetration in certain segments.
Emerging Opportunities in Telemedicine Carts Systems
Emerging opportunities in the Telemedicine Carts Systems market are abundant, driven by technological breakthroughs and evolving healthcare needs. The growing trend of home-based healthcare and remote patient monitoring presents a significant opportunity for the development of specialized, user-friendly telemedicine carts for patient use. Strategic partnerships between technology providers, healthcare institutions, and pharmaceutical companies can lead to the co-development of integrated solutions for chronic disease management and post-operative care. Market expansion into developing economies, where healthcare infrastructure is less developed, offers substantial growth potential. The increasing demand for telehealth services in specialized fields like mental health and dermatology also opens new avenues for product innovation and market penetration.
Leading Players in the Telemedicine Carts Systems Sector
- GlobalMed
- Rubbermaid Healthcare
- Polycom
- Cisco Systems
- Ergotron
- AVTEQ
- AMD
- Lifebot
- Avizia
- ICUcare
- METRO
- Intouch Health
- Afc Industries
- AFHCAN
Key Milestones in Telemedicine Carts Systems Industry
- 2019: Increased investment in AI-powered diagnostic tools for integration into telemedicine carts, improving diagnostic accuracy and efficiency.
- 2020: Significant surge in demand and adoption of telemedicine carts due to the COVID-19 pandemic, accelerating market growth and innovation.
- 2021: Introduction of enhanced mobility features and longer battery life in new models, addressing practical challenges in clinical settings.
- 2022: Strategic partnerships formed between telemedicine cart manufacturers and telehealth platform providers to offer bundled solutions.
- 2023: Advancements in wireless connectivity and cloud integration, enabling seamless data transfer and remote management of carts.
- 2024: Growing focus on cybersecurity enhancements to protect sensitive patient data transmitted and stored on telemedicine carts.
Strategic Outlook for Telemedicine Carts Systems Market
The strategic outlook for the Telemedicine Carts Systems market remains exceptionally strong. Growth accelerators will be driven by the continued integration of cutting-edge technologies such as AI, IoT, and advanced imaging within these mobile platforms. The increasing global imperative to democratize healthcare access, particularly in rural and underserved regions, will fuel demand. Strategic opportunities lie in developing customized solutions for specific medical specialties, such as emergency response, chronic care management, and long-term care facilities. Furthermore, fostering robust collaborations between hardware manufacturers, software developers, and healthcare providers will be crucial for creating comprehensive, user-centric telemedicine ecosystems that maximize efficiency and patient outcomes, further solidifying the market's upward trajectory.
Telemedicine Carts Systems Segmentation
-
1. Application
- 1.1. Clinic & Hospitals
- 1.2. Field Medical Training
- 1.3. Earthquake Relief
- 1.4. Other
-
2. Type
- 2.1. For Remote Consultation
- 2.2. For Illness Diagnose
- 2.3. Other
Telemedicine Carts Systems Segmentation By Geography
-
1. North America
- 1.1. United States
- 1.2. Canada
- 1.3. Mexico
-
2. South America
- 2.1. Brazil
- 2.2. Argentina
- 2.3. Rest of South America
-
3. Europe
- 3.1. United Kingdom
- 3.2. Germany
- 3.3. France
- 3.4. Italy
- 3.5. Spain
- 3.6. Russia
- 3.7. Benelux
- 3.8. Nordics
- 3.9. Rest of Europe
-
4. Middle East & Africa
- 4.1. Turkey
- 4.2. Israel
- 4.3. GCC
- 4.4. North Africa
- 4.5. South Africa
- 4.6. Rest of Middle East & Africa
-
5. Asia Pacific
- 5.1. China
- 5.2. India
- 5.3. Japan
- 5.4. South Korea
- 5.5. ASEAN
- 5.6. Oceania
- 5.7. Rest of Asia Pacific

Telemedicine Carts Systems Regional Market Share
Geographic Coverage of Telemedicine Carts Systems
Telemedicine Carts Systems REPORT HIGHLIGHTS
| Aspects | Details |
|---|---|
| Study Period | 2020-2034 |
| Base Year | 2025 |
| Estimated Year | 2026 |
| Forecast Period | 2026-2034 |
| Historical Period | 2020-2025 |
| Growth Rate | CAGR of 18.5% from 2020-2034 |
| Segmentation |
|
Table of Contents
- 1. Introduction
- 1.1. Research Scope
- 1.2. Market Segmentation
- 1.3. Research Methodology
- 1.4. Definitions and Assumptions
- 2. Executive Summary
- 2.1. Introduction
- 3. Market Dynamics
- 3.1. Introduction
- 3.2. Market Drivers
- 3.3. Market Restrains
- 3.4. Market Trends
- 4. Market Factor Analysis
- 4.1. Porters Five Forces
- 4.2. Supply/Value Chain
- 4.3. PESTEL analysis
- 4.4. Market Entropy
- 4.5. Patent/Trademark Analysis
- 5. Global Telemedicine Carts Systems Analysis, Insights and Forecast, 2020-2032
- 5.1. Market Analysis, Insights and Forecast - by Application
- 5.1.1. Clinic & Hospitals
- 5.1.2. Field Medical Training
- 5.1.3. Earthquake Relief
- 5.1.4. Other
- 5.2. Market Analysis, Insights and Forecast - by Type
- 5.2.1. For Remote Consultation
- 5.2.2. For Illness Diagnose
- 5.2.3. Other
- 5.3. Market Analysis, Insights and Forecast - by Region
- 5.3.1. North America
- 5.3.2. South America
- 5.3.3. Europe
- 5.3.4. Middle East & Africa
- 5.3.5. Asia Pacific
- 5.1. Market Analysis, Insights and Forecast - by Application
- 6. North America Telemedicine Carts Systems Analysis, Insights and Forecast, 2020-2032
- 6.1. Market Analysis, Insights and Forecast - by Application
- 6.1.1. Clinic & Hospitals
- 6.1.2. Field Medical Training
- 6.1.3. Earthquake Relief
- 6.1.4. Other
- 6.2. Market Analysis, Insights and Forecast - by Type
- 6.2.1. For Remote Consultation
- 6.2.2. For Illness Diagnose
- 6.2.3. Other
- 6.1. Market Analysis, Insights and Forecast - by Application
- 7. South America Telemedicine Carts Systems Analysis, Insights and Forecast, 2020-2032
- 7.1. Market Analysis, Insights and Forecast - by Application
- 7.1.1. Clinic & Hospitals
- 7.1.2. Field Medical Training
- 7.1.3. Earthquake Relief
- 7.1.4. Other
- 7.2. Market Analysis, Insights and Forecast - by Type
- 7.2.1. For Remote Consultation
- 7.2.2. For Illness Diagnose
- 7.2.3. Other
- 7.1. Market Analysis, Insights and Forecast - by Application
- 8. Europe Telemedicine Carts Systems Analysis, Insights and Forecast, 2020-2032
- 8.1. Market Analysis, Insights and Forecast - by Application
- 8.1.1. Clinic & Hospitals
- 8.1.2. Field Medical Training
- 8.1.3. Earthquake Relief
- 8.1.4. Other
- 8.2. Market Analysis, Insights and Forecast - by Type
- 8.2.1. For Remote Consultation
- 8.2.2. For Illness Diagnose
- 8.2.3. Other
- 8.1. Market Analysis, Insights and Forecast - by Application
- 9. Middle East & Africa Telemedicine Carts Systems Analysis, Insights and Forecast, 2020-2032
- 9.1. Market Analysis, Insights and Forecast - by Application
- 9.1.1. Clinic & Hospitals
- 9.1.2. Field Medical Training
- 9.1.3. Earthquake Relief
- 9.1.4. Other
- 9.2. Market Analysis, Insights and Forecast - by Type
- 9.2.1. For Remote Consultation
- 9.2.2. For Illness Diagnose
- 9.2.3. Other
- 9.1. Market Analysis, Insights and Forecast - by Application
- 10. Asia Pacific Telemedicine Carts Systems Analysis, Insights and Forecast, 2020-2032
- 10.1. Market Analysis, Insights and Forecast - by Application
- 10.1.1. Clinic & Hospitals
- 10.1.2. Field Medical Training
- 10.1.3. Earthquake Relief
- 10.1.4. Other
- 10.2. Market Analysis, Insights and Forecast - by Type
- 10.2.1. For Remote Consultation
- 10.2.2. For Illness Diagnose
- 10.2.3. Other
- 10.1. Market Analysis, Insights and Forecast - by Application
- 11. Competitive Analysis
- 11.1. Global Market Share Analysis 2025
- 11.2. Company Profiles
- 11.2.1 GlobalMed
- 11.2.1.1. Overview
- 11.2.1.2. Products
- 11.2.1.3. SWOT Analysis
- 11.2.1.4. Recent Developments
- 11.2.1.5. Financials (Based on Availability)
- 11.2.2 Rubbermaid Healthcare
- 11.2.2.1. Overview
- 11.2.2.2. Products
- 11.2.2.3. SWOT Analysis
- 11.2.2.4. Recent Developments
- 11.2.2.5. Financials (Based on Availability)
- 11.2.3 Polycom
- 11.2.3.1. Overview
- 11.2.3.2. Products
- 11.2.3.3. SWOT Analysis
- 11.2.3.4. Recent Developments
- 11.2.3.5. Financials (Based on Availability)
- 11.2.4 Cisco Systems
- 11.2.4.1. Overview
- 11.2.4.2. Products
- 11.2.4.3. SWOT Analysis
- 11.2.4.4. Recent Developments
- 11.2.4.5. Financials (Based on Availability)
- 11.2.5 Ergotron
- 11.2.5.1. Overview
- 11.2.5.2. Products
- 11.2.5.3. SWOT Analysis
- 11.2.5.4. Recent Developments
- 11.2.5.5. Financials (Based on Availability)
- 11.2.6 AVTEQ
- 11.2.6.1. Overview
- 11.2.6.2. Products
- 11.2.6.3. SWOT Analysis
- 11.2.6.4. Recent Developments
- 11.2.6.5. Financials (Based on Availability)
- 11.2.7 AMD
- 11.2.7.1. Overview
- 11.2.7.2. Products
- 11.2.7.3. SWOT Analysis
- 11.2.7.4. Recent Developments
- 11.2.7.5. Financials (Based on Availability)
- 11.2.8 Lifebot
- 11.2.8.1. Overview
- 11.2.8.2. Products
- 11.2.8.3. SWOT Analysis
- 11.2.8.4. Recent Developments
- 11.2.8.5. Financials (Based on Availability)
- 11.2.9 Avizia
- 11.2.9.1. Overview
- 11.2.9.2. Products
- 11.2.9.3. SWOT Analysis
- 11.2.9.4. Recent Developments
- 11.2.9.5. Financials (Based on Availability)
- 11.2.10 ICUcare
- 11.2.10.1. Overview
- 11.2.10.2. Products
- 11.2.10.3. SWOT Analysis
- 11.2.10.4. Recent Developments
- 11.2.10.5. Financials (Based on Availability)
- 11.2.11 METRO
- 11.2.11.1. Overview
- 11.2.11.2. Products
- 11.2.11.3. SWOT Analysis
- 11.2.11.4. Recent Developments
- 11.2.11.5. Financials (Based on Availability)
- 11.2.12 Intouch Health
- 11.2.12.1. Overview
- 11.2.12.2. Products
- 11.2.12.3. SWOT Analysis
- 11.2.12.4. Recent Developments
- 11.2.12.5. Financials (Based on Availability)
- 11.2.13 Afc Industries
- 11.2.13.1. Overview
- 11.2.13.2. Products
- 11.2.13.3. SWOT Analysis
- 11.2.13.4. Recent Developments
- 11.2.13.5. Financials (Based on Availability)
- 11.2.14 AFHCAN
- 11.2.14.1. Overview
- 11.2.14.2. Products
- 11.2.14.3. SWOT Analysis
- 11.2.14.4. Recent Developments
- 11.2.14.5. Financials (Based on Availability)
- 11.2.1 GlobalMed
List of Figures
- Figure 1: Global Telemedicine Carts Systems Revenue Breakdown (undefined, %) by Region 2025 & 2033
- Figure 2: Global Telemedicine Carts Systems Volume Breakdown (K, %) by Region 2025 & 2033
- Figure 3: North America Telemedicine Carts Systems Revenue (undefined), by Application 2025 & 2033
- Figure 4: North America Telemedicine Carts Systems Volume (K), by Application 2025 & 2033
- Figure 5: North America Telemedicine Carts Systems Revenue Share (%), by Application 2025 & 2033
- Figure 6: North America Telemedicine Carts Systems Volume Share (%), by Application 2025 & 2033
- Figure 7: North America Telemedicine Carts Systems Revenue (undefined), by Type 2025 & 2033
- Figure 8: North America Telemedicine Carts Systems Volume (K), by Type 2025 & 2033
- Figure 9: North America Telemedicine Carts Systems Revenue Share (%), by Type 2025 & 2033
- Figure 10: North America Telemedicine Carts Systems Volume Share (%), by Type 2025 & 2033
- Figure 11: North America Telemedicine Carts Systems Revenue (undefined), by Country 2025 & 2033
- Figure 12: North America Telemedicine Carts Systems Volume (K), by Country 2025 & 2033
- Figure 13: North America Telemedicine Carts Systems Revenue Share (%), by Country 2025 & 2033
- Figure 14: North America Telemedicine Carts Systems Volume Share (%), by Country 2025 & 2033
- Figure 15: South America Telemedicine Carts Systems Revenue (undefined), by Application 2025 & 2033
- Figure 16: South America Telemedicine Carts Systems Volume (K), by Application 2025 & 2033
- Figure 17: South America Telemedicine Carts Systems Revenue Share (%), by Application 2025 & 2033
- Figure 18: South America Telemedicine Carts Systems Volume Share (%), by Application 2025 & 2033
- Figure 19: South America Telemedicine Carts Systems Revenue (undefined), by Type 2025 & 2033
- Figure 20: South America Telemedicine Carts Systems Volume (K), by Type 2025 & 2033
- Figure 21: South America Telemedicine Carts Systems Revenue Share (%), by Type 2025 & 2033
- Figure 22: South America Telemedicine Carts Systems Volume Share (%), by Type 2025 & 2033
- Figure 23: South America Telemedicine Carts Systems Revenue (undefined), by Country 2025 & 2033
- Figure 24: South America Telemedicine Carts Systems Volume (K), by Country 2025 & 2033
- Figure 25: South America Telemedicine Carts Systems Revenue Share (%), by Country 2025 & 2033
- Figure 26: South America Telemedicine Carts Systems Volume Share (%), by Country 2025 & 2033
- Figure 27: Europe Telemedicine Carts Systems Revenue (undefined), by Application 2025 & 2033
- Figure 28: Europe Telemedicine Carts Systems Volume (K), by Application 2025 & 2033
- Figure 29: Europe Telemedicine Carts Systems Revenue Share (%), by Application 2025 & 2033
- Figure 30: Europe Telemedicine Carts Systems Volume Share (%), by Application 2025 & 2033
- Figure 31: Europe Telemedicine Carts Systems Revenue (undefined), by Type 2025 & 2033
- Figure 32: Europe Telemedicine Carts Systems Volume (K), by Type 2025 & 2033
- Figure 33: Europe Telemedicine Carts Systems Revenue Share (%), by Type 2025 & 2033
- Figure 34: Europe Telemedicine Carts Systems Volume Share (%), by Type 2025 & 2033
- Figure 35: Europe Telemedicine Carts Systems Revenue (undefined), by Country 2025 & 2033
- Figure 36: Europe Telemedicine Carts Systems Volume (K), by Country 2025 & 2033
- Figure 37: Europe Telemedicine Carts Systems Revenue Share (%), by Country 2025 & 2033
- Figure 38: Europe Telemedicine Carts Systems Volume Share (%), by Country 2025 & 2033
- Figure 39: Middle East & Africa Telemedicine Carts Systems Revenue (undefined), by Application 2025 & 2033
- Figure 40: Middle East & Africa Telemedicine Carts Systems Volume (K), by Application 2025 & 2033
- Figure 41: Middle East & Africa Telemedicine Carts Systems Revenue Share (%), by Application 2025 & 2033
- Figure 42: Middle East & Africa Telemedicine Carts Systems Volume Share (%), by Application 2025 & 2033
- Figure 43: Middle East & Africa Telemedicine Carts Systems Revenue (undefined), by Type 2025 & 2033
- Figure 44: Middle East & Africa Telemedicine Carts Systems Volume (K), by Type 2025 & 2033
- Figure 45: Middle East & Africa Telemedicine Carts Systems Revenue Share (%), by Type 2025 & 2033
- Figure 46: Middle East & Africa Telemedicine Carts Systems Volume Share (%), by Type 2025 & 2033
- Figure 47: Middle East & Africa Telemedicine Carts Systems Revenue (undefined), by Country 2025 & 2033
- Figure 48: Middle East & Africa Telemedicine Carts Systems Volume (K), by Country 2025 & 2033
- Figure 49: Middle East & Africa Telemedicine Carts Systems Revenue Share (%), by Country 2025 & 2033
- Figure 50: Middle East & Africa Telemedicine Carts Systems Volume Share (%), by Country 2025 & 2033
- Figure 51: Asia Pacific Telemedicine Carts Systems Revenue (undefined), by Application 2025 & 2033
- Figure 52: Asia Pacific Telemedicine Carts Systems Volume (K), by Application 2025 & 2033
- Figure 53: Asia Pacific Telemedicine Carts Systems Revenue Share (%), by Application 2025 & 2033
- Figure 54: Asia Pacific Telemedicine Carts Systems Volume Share (%), by Application 2025 & 2033
- Figure 55: Asia Pacific Telemedicine Carts Systems Revenue (undefined), by Type 2025 & 2033
- Figure 56: Asia Pacific Telemedicine Carts Systems Volume (K), by Type 2025 & 2033
- Figure 57: Asia Pacific Telemedicine Carts Systems Revenue Share (%), by Type 2025 & 2033
- Figure 58: Asia Pacific Telemedicine Carts Systems Volume Share (%), by Type 2025 & 2033
- Figure 59: Asia Pacific Telemedicine Carts Systems Revenue (undefined), by Country 2025 & 2033
- Figure 60: Asia Pacific Telemedicine Carts Systems Volume (K), by Country 2025 & 2033
- Figure 61: Asia Pacific Telemedicine Carts Systems Revenue Share (%), by Country 2025 & 2033
- Figure 62: Asia Pacific Telemedicine Carts Systems Volume Share (%), by Country 2025 & 2033
List of Tables
- Table 1: Global Telemedicine Carts Systems Revenue undefined Forecast, by Application 2020 & 2033
- Table 2: Global Telemedicine Carts Systems Volume K Forecast, by Application 2020 & 2033
- Table 3: Global Telemedicine Carts Systems Revenue undefined Forecast, by Type 2020 & 2033
- Table 4: Global Telemedicine Carts Systems Volume K Forecast, by Type 2020 & 2033
- Table 5: Global Telemedicine Carts Systems Revenue undefined Forecast, by Region 2020 & 2033
- Table 6: Global Telemedicine Carts Systems Volume K Forecast, by Region 2020 & 2033
- Table 7: Global Telemedicine Carts Systems Revenue undefined Forecast, by Application 2020 & 2033
- Table 8: Global Telemedicine Carts Systems Volume K Forecast, by Application 2020 & 2033
- Table 9: Global Telemedicine Carts Systems Revenue undefined Forecast, by Type 2020 & 2033
- Table 10: Global Telemedicine Carts Systems Volume K Forecast, by Type 2020 & 2033
- Table 11: Global Telemedicine Carts Systems Revenue undefined Forecast, by Country 2020 & 2033
- Table 12: Global Telemedicine Carts Systems Volume K Forecast, by Country 2020 & 2033
- Table 13: United States Telemedicine Carts Systems Revenue (undefined) Forecast, by Application 2020 & 2033
- Table 14: United States Telemedicine Carts Systems Volume (K) Forecast, by Application 2020 & 2033
- Table 15: Canada Telemedicine Carts Systems Revenue (undefined) Forecast, by Application 2020 & 2033
- Table 16: Canada Telemedicine Carts Systems Volume (K) Forecast, by Application 2020 & 2033
- Table 17: Mexico Telemedicine Carts Systems Revenue (undefined) Forecast, by Application 2020 & 2033
- Table 18: Mexico Telemedicine Carts Systems Volume (K) Forecast, by Application 2020 & 2033
- Table 19: Global Telemedicine Carts Systems Revenue undefined Forecast, by Application 2020 & 2033
- Table 20: Global Telemedicine Carts Systems Volume K Forecast, by Application 2020 & 2033
- Table 21: Global Telemedicine Carts Systems Revenue undefined Forecast, by Type 2020 & 2033
- Table 22: Global Telemedicine Carts Systems Volume K Forecast, by Type 2020 & 2033
- Table 23: Global Telemedicine Carts Systems Revenue undefined Forecast, by Country 2020 & 2033
- Table 24: Global Telemedicine Carts Systems Volume K Forecast, by Country 2020 & 2033
- Table 25: Brazil Telemedicine Carts Systems Revenue (undefined) Forecast, by Application 2020 & 2033
- Table 26: Brazil Telemedicine Carts Systems Volume (K) Forecast, by Application 2020 & 2033
- Table 27: Argentina Telemedicine Carts Systems Revenue (undefined) Forecast, by Application 2020 & 2033
- Table 28: Argentina Telemedicine Carts Systems Volume (K) Forecast, by Application 2020 & 2033
- Table 29: Rest of South America Telemedicine Carts Systems Revenue (undefined) Forecast, by Application 2020 & 2033
- Table 30: Rest of South America Telemedicine Carts Systems Volume (K) Forecast, by Application 2020 & 2033
- Table 31: Global Telemedicine Carts Systems Revenue undefined Forecast, by Application 2020 & 2033
- Table 32: Global Telemedicine Carts Systems Volume K Forecast, by Application 2020 & 2033
- Table 33: Global Telemedicine Carts Systems Revenue undefined Forecast, by Type 2020 & 2033
- Table 34: Global Telemedicine Carts Systems Volume K Forecast, by Type 2020 & 2033
- Table 35: Global Telemedicine Carts Systems Revenue undefined Forecast, by Country 2020 & 2033
- Table 36: Global Telemedicine Carts Systems Volume K Forecast, by Country 2020 & 2033
- Table 37: United Kingdom Telemedicine Carts Systems Revenue (undefined) Forecast, by Application 2020 & 2033
- Table 38: United Kingdom Telemedicine Carts Systems Volume (K) Forecast, by Application 2020 & 2033
- Table 39: Germany Telemedicine Carts Systems Revenue (undefined) Forecast, by Application 2020 & 2033
- Table 40: Germany Telemedicine Carts Systems Volume (K) Forecast, by Application 2020 & 2033
- Table 41: France Telemedicine Carts Systems Revenue (undefined) Forecast, by Application 2020 & 2033
- Table 42: France Telemedicine Carts Systems Volume (K) Forecast, by Application 2020 & 2033
- Table 43: Italy Telemedicine Carts Systems Revenue (undefined) Forecast, by Application 2020 & 2033
- Table 44: Italy Telemedicine Carts Systems Volume (K) Forecast, by Application 2020 & 2033
- Table 45: Spain Telemedicine Carts Systems Revenue (undefined) Forecast, by Application 2020 & 2033
- Table 46: Spain Telemedicine Carts Systems Volume (K) Forecast, by Application 2020 & 2033
- Table 47: Russia Telemedicine Carts Systems Revenue (undefined) Forecast, by Application 2020 & 2033
- Table 48: Russia Telemedicine Carts Systems Volume (K) Forecast, by Application 2020 & 2033
- Table 49: Benelux Telemedicine Carts Systems Revenue (undefined) Forecast, by Application 2020 & 2033
- Table 50: Benelux Telemedicine Carts Systems Volume (K) Forecast, by Application 2020 & 2033
- Table 51: Nordics Telemedicine Carts Systems Revenue (undefined) Forecast, by Application 2020 & 2033
- Table 52: Nordics Telemedicine Carts Systems Volume (K) Forecast, by Application 2020 & 2033
- Table 53: Rest of Europe Telemedicine Carts Systems Revenue (undefined) Forecast, by Application 2020 & 2033
- Table 54: Rest of Europe Telemedicine Carts Systems Volume (K) Forecast, by Application 2020 & 2033
- Table 55: Global Telemedicine Carts Systems Revenue undefined Forecast, by Application 2020 & 2033
- Table 56: Global Telemedicine Carts Systems Volume K Forecast, by Application 2020 & 2033
- Table 57: Global Telemedicine Carts Systems Revenue undefined Forecast, by Type 2020 & 2033
- Table 58: Global Telemedicine Carts Systems Volume K Forecast, by Type 2020 & 2033
- Table 59: Global Telemedicine Carts Systems Revenue undefined Forecast, by Country 2020 & 2033
- Table 60: Global Telemedicine Carts Systems Volume K Forecast, by Country 2020 & 2033
- Table 61: Turkey Telemedicine Carts Systems Revenue (undefined) Forecast, by Application 2020 & 2033
- Table 62: Turkey Telemedicine Carts Systems Volume (K) Forecast, by Application 2020 & 2033
- Table 63: Israel Telemedicine Carts Systems Revenue (undefined) Forecast, by Application 2020 & 2033
- Table 64: Israel Telemedicine Carts Systems Volume (K) Forecast, by Application 2020 & 2033
- Table 65: GCC Telemedicine Carts Systems Revenue (undefined) Forecast, by Application 2020 & 2033
- Table 66: GCC Telemedicine Carts Systems Volume (K) Forecast, by Application 2020 & 2033
- Table 67: North Africa Telemedicine Carts Systems Revenue (undefined) Forecast, by Application 2020 & 2033
- Table 68: North Africa Telemedicine Carts Systems Volume (K) Forecast, by Application 2020 & 2033
- Table 69: South Africa Telemedicine Carts Systems Revenue (undefined) Forecast, by Application 2020 & 2033
- Table 70: South Africa Telemedicine Carts Systems Volume (K) Forecast, by Application 2020 & 2033
- Table 71: Rest of Middle East & Africa Telemedicine Carts Systems Revenue (undefined) Forecast, by Application 2020 & 2033
- Table 72: Rest of Middle East & Africa Telemedicine Carts Systems Volume (K) Forecast, by Application 2020 & 2033
- Table 73: Global Telemedicine Carts Systems Revenue undefined Forecast, by Application 2020 & 2033
- Table 74: Global Telemedicine Carts Systems Volume K Forecast, by Application 2020 & 2033
- Table 75: Global Telemedicine Carts Systems Revenue undefined Forecast, by Type 2020 & 2033
- Table 76: Global Telemedicine Carts Systems Volume K Forecast, by Type 2020 & 2033
- Table 77: Global Telemedicine Carts Systems Revenue undefined Forecast, by Country 2020 & 2033
- Table 78: Global Telemedicine Carts Systems Volume K Forecast, by Country 2020 & 2033
- Table 79: China Telemedicine Carts Systems Revenue (undefined) Forecast, by Application 2020 & 2033
- Table 80: China Telemedicine Carts Systems Volume (K) Forecast, by Application 2020 & 2033
- Table 81: India Telemedicine Carts Systems Revenue (undefined) Forecast, by Application 2020 & 2033
- Table 82: India Telemedicine Carts Systems Volume (K) Forecast, by Application 2020 & 2033
- Table 83: Japan Telemedicine Carts Systems Revenue (undefined) Forecast, by Application 2020 & 2033
- Table 84: Japan Telemedicine Carts Systems Volume (K) Forecast, by Application 2020 & 2033
- Table 85: South Korea Telemedicine Carts Systems Revenue (undefined) Forecast, by Application 2020 & 2033
- Table 86: South Korea Telemedicine Carts Systems Volume (K) Forecast, by Application 2020 & 2033
- Table 87: ASEAN Telemedicine Carts Systems Revenue (undefined) Forecast, by Application 2020 & 2033
- Table 88: ASEAN Telemedicine Carts Systems Volume (K) Forecast, by Application 2020 & 2033
- Table 89: Oceania Telemedicine Carts Systems Revenue (undefined) Forecast, by Application 2020 & 2033
- Table 90: Oceania Telemedicine Carts Systems Volume (K) Forecast, by Application 2020 & 2033
- Table 91: Rest of Asia Pacific Telemedicine Carts Systems Revenue (undefined) Forecast, by Application 2020 & 2033
- Table 92: Rest of Asia Pacific Telemedicine Carts Systems Volume (K) Forecast, by Application 2020 & 2033
Frequently Asked Questions
1. What is the projected Compound Annual Growth Rate (CAGR) of the Telemedicine Carts Systems?
The projected CAGR is approximately 18.5%.
2. Which companies are prominent players in the Telemedicine Carts Systems?
Key companies in the market include GlobalMed, Rubbermaid Healthcare, Polycom, Cisco Systems, Ergotron, AVTEQ, AMD, Lifebot, Avizia, ICUcare, METRO, Intouch Health, Afc Industries, AFHCAN.
3. What are the main segments of the Telemedicine Carts Systems?
The market segments include Application, Type.
4. Can you provide details about the market size?
The market size is estimated to be USD XXX N/A as of 2022.
5. What are some drivers contributing to market growth?
N/A
6. What are the notable trends driving market growth?
N/A
7. Are there any restraints impacting market growth?
N/A
8. Can you provide examples of recent developments in the market?
N/A
9. What pricing options are available for accessing the report?
Pricing options include single-user, multi-user, and enterprise licenses priced at USD 3950.00, USD 5925.00, and USD 7900.00 respectively.
10. Is the market size provided in terms of value or volume?
The market size is provided in terms of value, measured in N/A and volume, measured in K.
11. Are there any specific market keywords associated with the report?
Yes, the market keyword associated with the report is "Telemedicine Carts Systems," which aids in identifying and referencing the specific market segment covered.
12. How do I determine which pricing option suits my needs best?
The pricing options vary based on user requirements and access needs. Individual users may opt for single-user licenses, while businesses requiring broader access may choose multi-user or enterprise licenses for cost-effective access to the report.
13. Are there any additional resources or data provided in the Telemedicine Carts Systems report?
While the report offers comprehensive insights, it's advisable to review the specific contents or supplementary materials provided to ascertain if additional resources or data are available.
14. How can I stay updated on further developments or reports in the Telemedicine Carts Systems?
To stay informed about further developments, trends, and reports in the Telemedicine Carts Systems, consider subscribing to industry newsletters, following relevant companies and organizations, or regularly checking reputable industry news sources and publications.
Methodology
Step 1 - Identification of Relevant Samples Size from Population Database


Step 2 - Approaches for Defining Global Market Size (Value, Volume* & Price*)

Note*: In applicable scenarios
Step 3 - Data Sources
Primary Research
- Web Analytics
- Survey Reports
- Research Institute
- Latest Research Reports
- Opinion Leaders
Secondary Research
- Annual Reports
- White Paper
- Latest Press Release
- Industry Association
- Paid Database
- Investor Presentations

Step 4 - Data Triangulation
Involves using different sources of information in order to increase the validity of a study
These sources are likely to be stakeholders in a program - participants, other researchers, program staff, other community members, and so on.
Then we put all data in single framework & apply various statistical tools to find out the dynamic on the market.
During the analysis stage, feedback from the stakeholder groups would be compared to determine areas of agreement as well as areas of divergence