

Key Insights
The global SPECT and PET Radiopharmaceuticals market is poised for significant expansion, driven by increasing adoption in diagnostic imaging and a growing prevalence of chronic diseases requiring advanced medical intervention. The market was valued at an estimated $6.8 billion in 2024, reflecting its robust present standing. Projections indicate a dynamic growth trajectory, with a Compound Annual Growth Rate (CAGR) of 10.3% anticipated through 2033. This impressive expansion is underpinned by several key factors. The increasing demand for early and accurate disease detection, particularly in oncology, neurology, and cardiology, fuels the utilization of SPECT and PET imaging agents. Advancements in radiopharmaceutical development, leading to more targeted and effective diagnostic and therapeutic agents, are also critical growth catalysts. Furthermore, an aging global population, prone to age-related diseases, necessitates more sophisticated diagnostic tools, thus bolstering market demand. The expanding healthcare infrastructure in emerging economies also contributes to market penetration and accessibility.
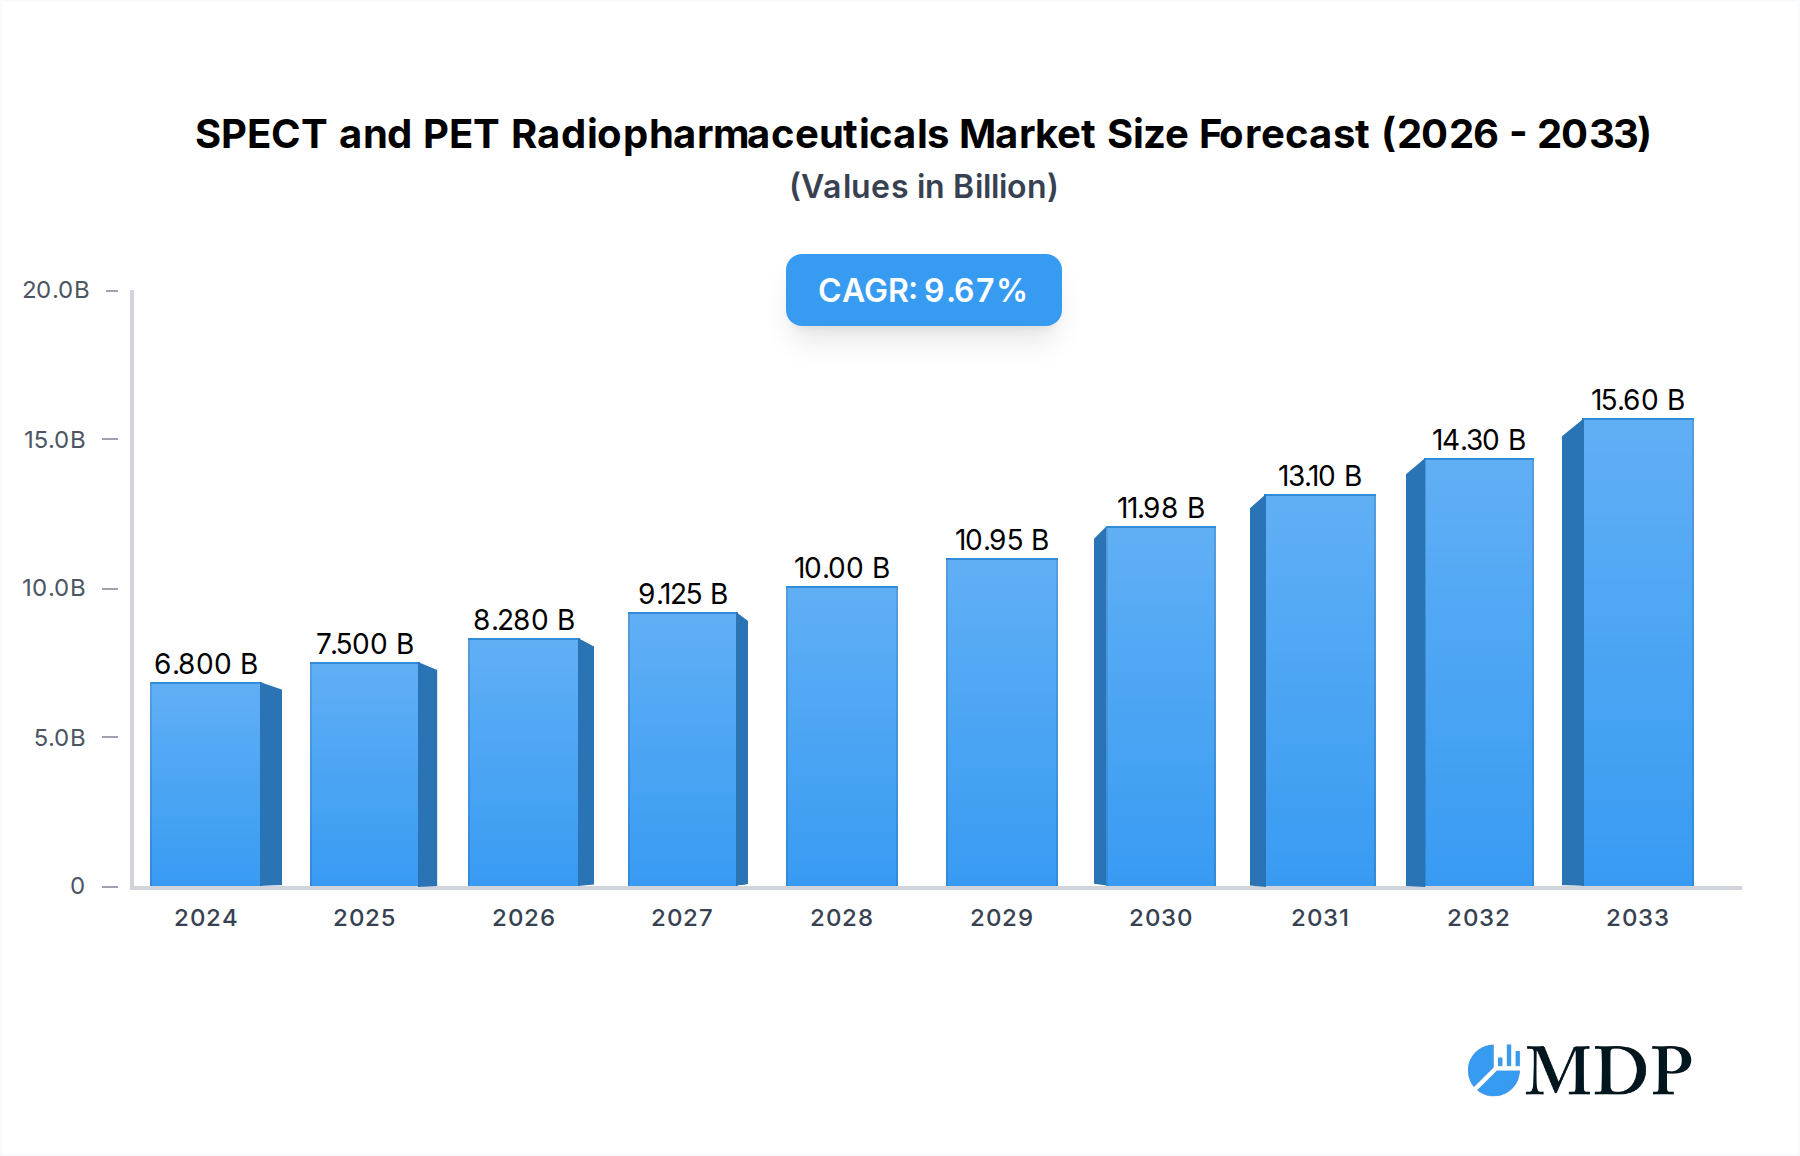
SPECT and PET Radiopharmaceuticals Market Size (In Billion)
Key market drivers include the rising incidence of cancer and neurodegenerative disorders, where SPECT and PET imaging play a crucial role in diagnosis, staging, and treatment monitoring. The continuous innovation in radiotracer development, offering enhanced specificity and sensitivity for various disease states, is another significant driver. Therapeutic radiopharmaceuticals are also gaining traction, offering targeted treatment options for certain cancers. However, restraints such as stringent regulatory approvals for new radiopharmaceuticals, high manufacturing costs, and limited availability of skilled personnel for handling radioactive materials may pose challenges. Despite these hurdles, the overarching trend of personalized medicine and the growing investment in nuclear medicine research and development are expected to propel the market forward, creating substantial opportunities for both diagnostic and therapeutic applications across a wide range of healthcare settings.

SPECT and PET Radiopharmaceuticals Company Market Share
Unleash the Future of Nuclear Medicine: Comprehensive Report on SPECT and PET Radiopharmaceuticals
This in-depth report offers a definitive analysis of the global SPECT and PET Radiopharmaceuticals market, a critical and rapidly evolving sector within diagnostic and therapeutic nuclear medicine. With a study period spanning 2019–2033, a base year of 2025, and a forecast period from 2025–2033, this report provides unparalleled insights for industry stakeholders, researchers, and investors. Dive deep into market dynamics, emerging trends, leading players, and future opportunities, leveraging high-traffic keywords like "radiopharmaceuticals," "SPECT," "PET," "nuclear medicine," "diagnostic imaging," "theranostics," and "oncology treatments." The report is meticulously structured to offer actionable intelligence, covering market size valued in the billions, CAGR projections, and market penetration figures.
SPECT and PET Radiopharmaceuticals Market Dynamics & Concentration
The SPECT and PET radiopharmaceuticals market is characterized by a moderate to high concentration, with key players investing heavily in research and development to drive innovation. Major market share is held by established companies, but emerging players and strategic collaborations are increasingly shaping the competitive landscape. Innovation drivers include the development of novel radiotracers for early disease detection, personalized medicine approaches, and advancements in imaging technologies. Regulatory frameworks, such as those governed by the FDA and EMA, play a crucial role in product approval and market access, often requiring extensive clinical trials and stringent quality control. Product substitutes are limited, primarily revolving around alternative imaging modalities, but the unique capabilities of SPECT and PET in molecular imaging and targeted therapy are hard to replicate. End-user trends point towards increasing demand from Hospitals and Clinics for advanced diagnostic and therapeutic applications, particularly in oncology, neurology, and cardiology. Mergers and Acquisition (M&A) activities are a significant aspect of market dynamics, with several substantial deals valued in the billions anticipated over the forecast period to expand product portfolios and geographical reach. For instance, M&A deal counts are projected to rise by approximately 15% by 2027 as companies seek to consolidate their market positions and gain access to innovative technologies.
SPECT and PET Radiopharmaceuticals Industry Trends & Analysis
The SPECT and PET Radiopharmaceuticals industry is poised for substantial growth, with an estimated Compound Annual Growth Rate (CAGR) of 10.5% projected from 2025 to 2033. This robust expansion is fueled by a confluence of factors including the increasing incidence of chronic diseases like cancer and cardiovascular ailments, leading to a greater demand for advanced diagnostic tools. Technological disruptions are at the forefront of this growth; advancements in cyclotron technology, automation in radiopharmaceutical production, and the development of new radiotracers are enhancing the efficacy and accessibility of SPECT and PET imaging. Consumer preferences are increasingly shifting towards minimally invasive diagnostic procedures and personalized treatment plans, making radiopharmaceuticals an attractive option. The competitive dynamics within the market are intense, with companies continuously striving to develop and commercialize novel radiotracers with improved target specificity and diagnostic accuracy. Market penetration is expected to deepen significantly, especially in emerging economies, as healthcare infrastructure improves and awareness regarding the benefits of nuclear medicine grows. The global market size for SPECT and PET radiopharmaceuticals is projected to reach approximately $25 billion by 2025, with continued expansion driven by these trends.
Leading Markets & Segments in SPECT and PET Radiopharmaceuticals
The SPECT and PET Radiopharmaceuticals market is dominated by Diagnostic Radiopharmaceuticals, accounting for an estimated 80% of the total market value in 2025, driven by their widespread use in early disease detection and staging. Within applications, Hospitals represent the largest segment, expected to contribute over $18 billion to the market by 2025, owing to their advanced infrastructure and higher patient volumes. Geographically, North America is the leading market, with an estimated market share of 35% in 2025, propelled by a well-established healthcare system, high adoption rates of advanced imaging technologies, and significant government investment in medical research. Economic policies in the United States and Canada, such as research grants and favorable reimbursement policies for diagnostic imaging procedures, are key drivers. Infrastructure development, including the expansion of nuclear medicine departments and the installation of new SPECT and PET scanners, further solidifies North America's dominance.
- Dominant Application: Hospitals
- High volume of diagnostic and therapeutic procedures.
- Access to advanced imaging equipment and skilled personnel.
- Increasing adoption of radiopharmaceuticals for oncology, cardiology, and neurology.
- Significant investment in nuclear medicine infrastructure.
- Dominant Type: Diagnostic Radiopharmaceuticals
- Wider range of applications in disease detection and monitoring.
- Established clinical protocols and reimbursement frameworks.
- Continuous innovation in tracer development for various disease states.
- Dominant Region: North America
- Robust healthcare infrastructure and high per capita spending.
- Favorable regulatory environment for new product approvals.
- Leading hub for radiopharmaceutical research and development.
- Strong presence of key market players.
SPECT and PET Radiopharmaceuticals Product Developments
Product developments in SPECT and PET Radiopharmaceuticals are rapidly advancing, focusing on enhancing diagnostic precision and therapeutic efficacy. Innovations include the creation of new targeted radiotracers for specific cancer types, such as PSMA-based radioligands for prostate cancer, and novel agents for neurodegenerative diseases like Alzheimer's. These developments aim to provide earlier and more accurate diagnoses, enabling personalized treatment strategies. Competitive advantages are derived from improved target specificity, reduced off-target effects, and enhanced pharmacokinetic profiles. The growing field of theranostics, which combines diagnostic and therapeutic radiopharmaceuticals for a single disease target, is a major area of innovation, offering a holistic approach to patient care. The market is witnessing the launch of approximately 10-15 new radiopharmaceutical products annually, with many showing significant promise in clinical trials.
Key Drivers of SPECT and PET Radiopharmaceuticals Growth
The SPECT and PET Radiopharmaceuticals market is propelled by several key drivers. Technological advancements, including the development of more sensitive detectors and sophisticated image reconstruction algorithms, are enhancing image quality and diagnostic accuracy. The increasing prevalence of chronic diseases, particularly cancer and cardiovascular diseases, is creating a sustained demand for advanced diagnostic and therapeutic nuclear medicine tools. Growing awareness and acceptance of nuclear medicine procedures among healthcare professionals and patients, coupled with supportive government initiatives and funding for medical research, further contribute to market expansion. The shift towards personalized medicine and targeted therapies is also a significant growth accelerator, as radiopharmaceuticals are integral to these approaches.
Challenges in the SPECT and PET Radiopharmaceuticals Market
Despite robust growth, the SPECT and PET Radiopharmaceuticals market faces several challenges. Stringent regulatory hurdles for new product approvals, requiring extensive clinical validation and significant investment, can slow down market entry. Supply chain complexities and short shelf-life of many radiopharmaceuticals necessitate sophisticated logistics and on-site production capabilities, leading to higher operational costs. High costs associated with radiopharmaceutical production and imaging equipment can limit accessibility, particularly in resource-constrained regions. Furthermore, limited reimbursement policies for certain novel radiopharmaceuticals in some regions can hinder widespread adoption. Competitive pressures from alternative diagnostic modalities and the need for continuous innovation also present ongoing challenges.
Emerging Opportunities in SPECT and PET Radiopharmaceuticals
Emerging opportunities within the SPECT and PET Radiopharmaceuticals sector are diverse and promising. The rapidly expanding field of theranostics, offering simultaneous diagnosis and treatment for diseases like cancer, presents a significant growth catalyst. Advancements in artificial intelligence (AI) and machine learning are enabling more sophisticated image analysis and personalized treatment planning, further enhancing the value of SPECT and PET imaging. Strategic partnerships between radiopharmaceutical developers, imaging equipment manufacturers, and academic research institutions are fostering innovation and accelerating product development. Furthermore, the increasing focus on neurological disorders and infectious diseases is opening new avenues for the application of SPECT and PET radiopharmaceuticals, expanding their market reach beyond oncology. Market expansion into emerging economies with improving healthcare infrastructure also represents a substantial untapped opportunity.
Leading Players in the SPECT and PET Radiopharmaceuticals Sector
The global SPECT and PET Radiopharmaceuticals landscape is shaped by a consortium of leading companies. These industry giants are at the forefront of innovation, production, and distribution:
- Cardinal Health
- GE Healthcare
- Jubilant Pharma
- Novartis
- Curium Pharma
- SIEMENS
- Lantheus
- Bracco Imaging
- Bayer
- Eli Lilly
- Aurobindo Pharma
- Mundipharma
- China Isotope & Radiation
- Dongcheng
Key Milestones in SPECT and PET Radiopharmaceuticals Industry
The SPECT and PET Radiopharmaceuticals industry has been marked by several pivotal milestones that have significantly shaped its trajectory:
- 2019: Launch of enhanced radiotracers for Alzheimer's disease diagnosis, improving early detection rates.
- 2020: Major advancements in cyclotron technology, enabling localized and more efficient radiopharmaceutical production.
- 2021: Approval of new radioligands for advanced prostate cancer imaging and therapy, marking a significant stride in theranostics.
- 2022: Increased investment in R&D for radiopharmaceuticals targeting rare diseases.
- 2023: Emergence of AI-driven radiomics for predictive diagnostics in oncology.
- 2024: Strategic acquisitions aimed at expanding the therapeutic radiopharmaceutical portfolio.
- 2025: Projected introduction of next-generation SPECT/PET tracers with improved specificity and safety profiles.
Strategic Outlook for SPECT and PET Radiopharmaceuticals Market
The strategic outlook for the SPECT and PET Radiopharmaceuticals market is exceptionally bright, driven by a sustained demand for advanced diagnostic and therapeutic solutions. The continued development of novel radiotracers, particularly in the realm of theranostics and personalized medicine, will be a key growth accelerator. Strategic partnerships and collaborations will remain crucial for navigating regulatory landscapes and expanding market access. Furthermore, the increasing integration of AI and data analytics will unlock new opportunities for more precise diagnosis and treatment planning. The market's potential for expansion into underserved geographical regions and new therapeutic areas, such as infectious diseases and autoimmune disorders, underscores its long-term growth trajectory. A projected market growth rate of over 10% CAGR highlights the immense potential for innovation and investment in this vital sector of nuclear medicine.
SPECT and PET Radiopharmaceuticals Segmentation
-
1. Application
- 1.1. Hospitals
- 1.2. Clinics
- 1.3. Others
-
2. Types
- 2.1. Diagnostic Radiopharmaceuticals
- 2.2. Therapeutic Radiopharmaceuticals
SPECT and PET Radiopharmaceuticals Segmentation By Geography
-
1. North America
- 1.1. United States
- 1.2. Canada
- 1.3. Mexico
-
2. South America
- 2.1. Brazil
- 2.2. Argentina
- 2.3. Rest of South America
-
3. Europe
- 3.1. United Kingdom
- 3.2. Germany
- 3.3. France
- 3.4. Italy
- 3.5. Spain
- 3.6. Russia
- 3.7. Benelux
- 3.8. Nordics
- 3.9. Rest of Europe
-
4. Middle East & Africa
- 4.1. Turkey
- 4.2. Israel
- 4.3. GCC
- 4.4. North Africa
- 4.5. South Africa
- 4.6. Rest of Middle East & Africa
-
5. Asia Pacific
- 5.1. China
- 5.2. India
- 5.3. Japan
- 5.4. South Korea
- 5.5. ASEAN
- 5.6. Oceania
- 5.7. Rest of Asia Pacific
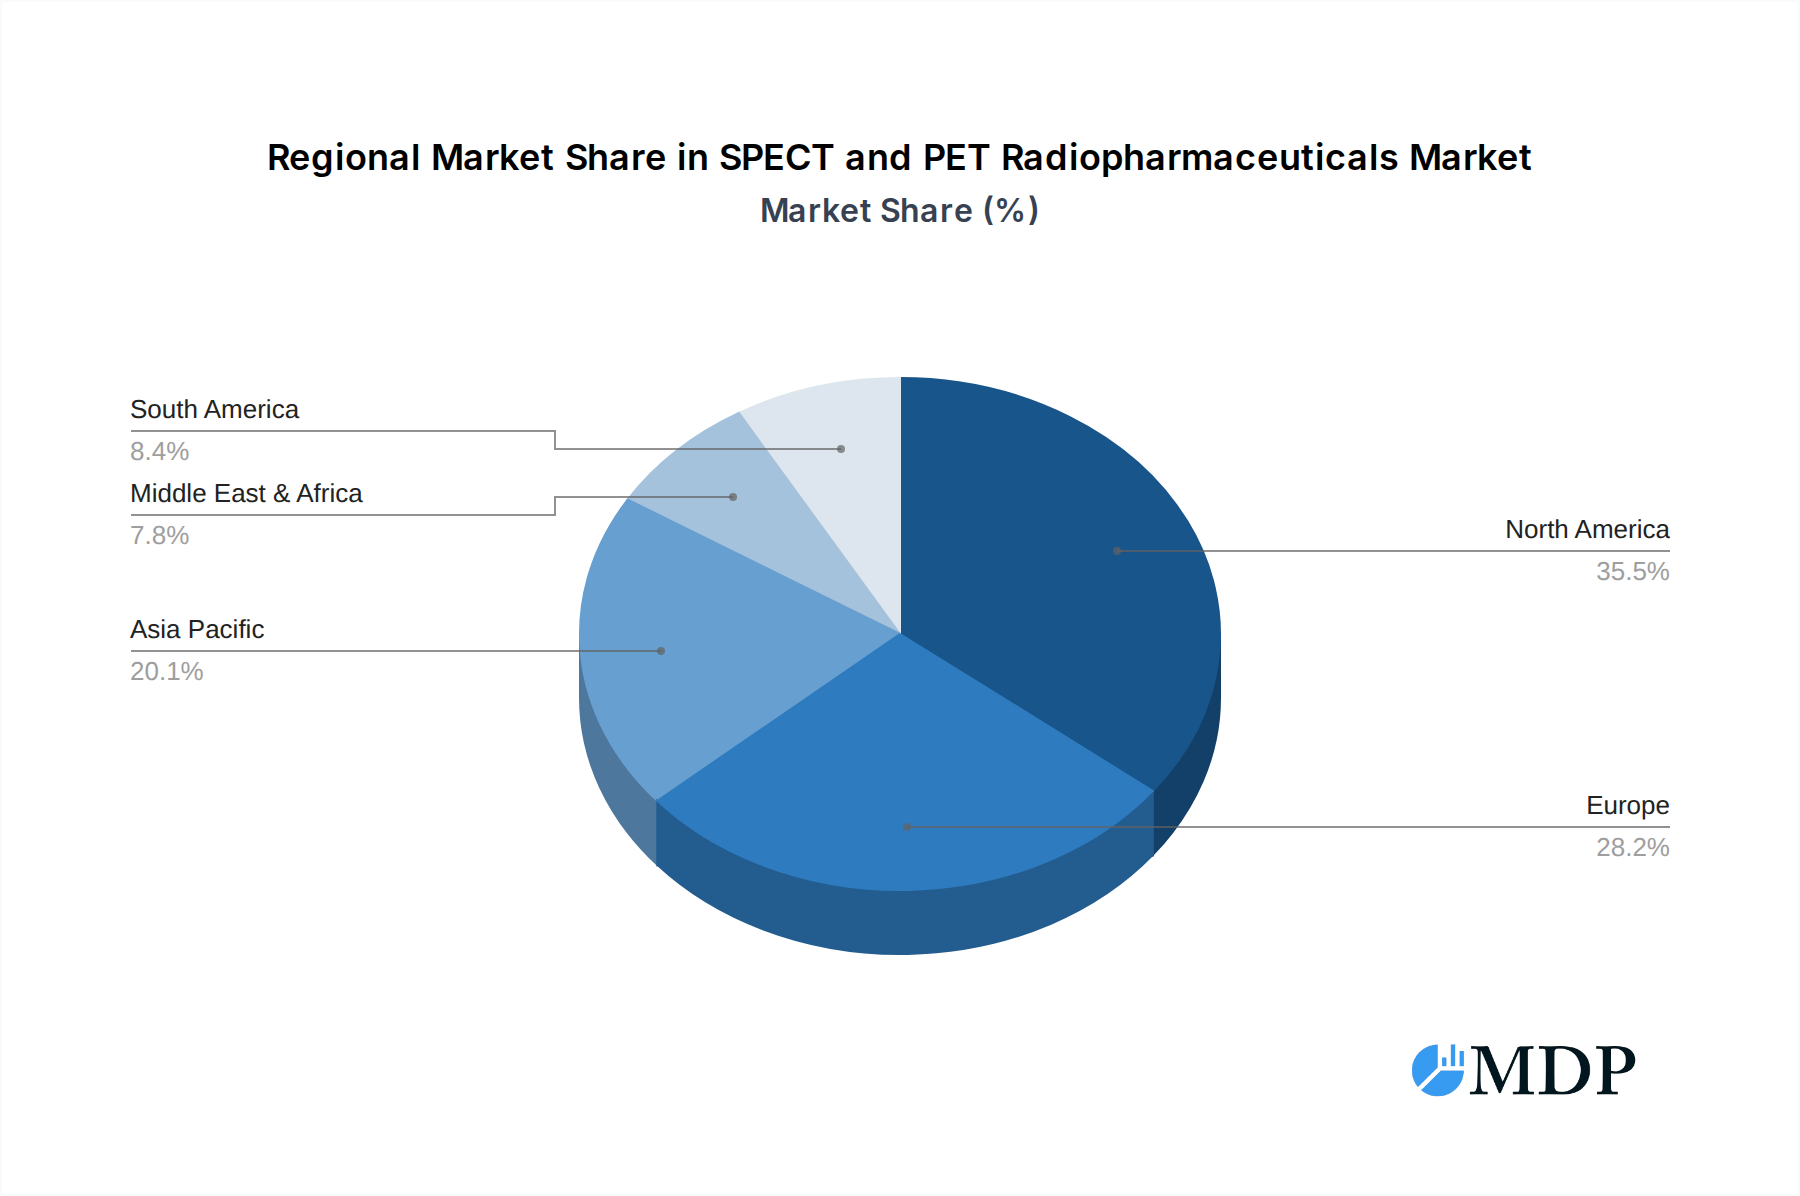
SPECT and PET Radiopharmaceuticals Regional Market Share
Geographic Coverage of SPECT and PET Radiopharmaceuticals
SPECT and PET Radiopharmaceuticals REPORT HIGHLIGHTS
| Aspects | Details |
|---|---|
| Study Period | 2020-2034 |
| Base Year | 2025 |
| Estimated Year | 2026 |
| Forecast Period | 2026-2034 |
| Historical Period | 2020-2025 |
| Growth Rate | CAGR of 10.3% from 2020-2034 |
| Segmentation |
|
Table of Contents
- 1. Introduction
- 1.1. Research Scope
- 1.2. Market Segmentation
- 1.3. Research Methodology
- 1.4. Definitions and Assumptions
- 2. Executive Summary
- 2.1. Introduction
- 3. Market Dynamics
- 3.1. Introduction
- 3.2. Market Drivers
- 3.3. Market Restrains
- 3.4. Market Trends
- 4. Market Factor Analysis
- 4.1. Porters Five Forces
- 4.2. Supply/Value Chain
- 4.3. PESTEL analysis
- 4.4. Market Entropy
- 4.5. Patent/Trademark Analysis
- 5. Global SPECT and PET Radiopharmaceuticals Analysis, Insights and Forecast, 2020-2032
- 5.1. Market Analysis, Insights and Forecast - by Application
- 5.1.1. Hospitals
- 5.1.2. Clinics
- 5.1.3. Others
- 5.2. Market Analysis, Insights and Forecast - by Types
- 5.2.1. Diagnostic Radiopharmaceuticals
- 5.2.2. Therapeutic Radiopharmaceuticals
- 5.3. Market Analysis, Insights and Forecast - by Region
- 5.3.1. North America
- 5.3.2. South America
- 5.3.3. Europe
- 5.3.4. Middle East & Africa
- 5.3.5. Asia Pacific
- 5.1. Market Analysis, Insights and Forecast - by Application
- 6. North America SPECT and PET Radiopharmaceuticals Analysis, Insights and Forecast, 2020-2032
- 6.1. Market Analysis, Insights and Forecast - by Application
- 6.1.1. Hospitals
- 6.1.2. Clinics
- 6.1.3. Others
- 6.2. Market Analysis, Insights and Forecast - by Types
- 6.2.1. Diagnostic Radiopharmaceuticals
- 6.2.2. Therapeutic Radiopharmaceuticals
- 6.1. Market Analysis, Insights and Forecast - by Application
- 7. South America SPECT and PET Radiopharmaceuticals Analysis, Insights and Forecast, 2020-2032
- 7.1. Market Analysis, Insights and Forecast - by Application
- 7.1.1. Hospitals
- 7.1.2. Clinics
- 7.1.3. Others
- 7.2. Market Analysis, Insights and Forecast - by Types
- 7.2.1. Diagnostic Radiopharmaceuticals
- 7.2.2. Therapeutic Radiopharmaceuticals
- 7.1. Market Analysis, Insights and Forecast - by Application
- 8. Europe SPECT and PET Radiopharmaceuticals Analysis, Insights and Forecast, 2020-2032
- 8.1. Market Analysis, Insights and Forecast - by Application
- 8.1.1. Hospitals
- 8.1.2. Clinics
- 8.1.3. Others
- 8.2. Market Analysis, Insights and Forecast - by Types
- 8.2.1. Diagnostic Radiopharmaceuticals
- 8.2.2. Therapeutic Radiopharmaceuticals
- 8.1. Market Analysis, Insights and Forecast - by Application
- 9. Middle East & Africa SPECT and PET Radiopharmaceuticals Analysis, Insights and Forecast, 2020-2032
- 9.1. Market Analysis, Insights and Forecast - by Application
- 9.1.1. Hospitals
- 9.1.2. Clinics
- 9.1.3. Others
- 9.2. Market Analysis, Insights and Forecast - by Types
- 9.2.1. Diagnostic Radiopharmaceuticals
- 9.2.2. Therapeutic Radiopharmaceuticals
- 9.1. Market Analysis, Insights and Forecast - by Application
- 10. Asia Pacific SPECT and PET Radiopharmaceuticals Analysis, Insights and Forecast, 2020-2032
- 10.1. Market Analysis, Insights and Forecast - by Application
- 10.1.1. Hospitals
- 10.1.2. Clinics
- 10.1.3. Others
- 10.2. Market Analysis, Insights and Forecast - by Types
- 10.2.1. Diagnostic Radiopharmaceuticals
- 10.2.2. Therapeutic Radiopharmaceuticals
- 10.1. Market Analysis, Insights and Forecast - by Application
- 11. Competitive Analysis
- 11.1. Global Market Share Analysis 2025
- 11.2. Company Profiles
- 11.2.1 Cardinal Health
- 11.2.1.1. Overview
- 11.2.1.2. Products
- 11.2.1.3. SWOT Analysis
- 11.2.1.4. Recent Developments
- 11.2.1.5. Financials (Based on Availability)
- 11.2.2 GE Healthcare
- 11.2.2.1. Overview
- 11.2.2.2. Products
- 11.2.2.3. SWOT Analysis
- 11.2.2.4. Recent Developments
- 11.2.2.5. Financials (Based on Availability)
- 11.2.3 Jubilant Pharma
- 11.2.3.1. Overview
- 11.2.3.2. Products
- 11.2.3.3. SWOT Analysis
- 11.2.3.4. Recent Developments
- 11.2.3.5. Financials (Based on Availability)
- 11.2.4 Novartis
- 11.2.4.1. Overview
- 11.2.4.2. Products
- 11.2.4.3. SWOT Analysis
- 11.2.4.4. Recent Developments
- 11.2.4.5. Financials (Based on Availability)
- 11.2.5 Curium Pharma
- 11.2.5.1. Overview
- 11.2.5.2. Products
- 11.2.5.3. SWOT Analysis
- 11.2.5.4. Recent Developments
- 11.2.5.5. Financials (Based on Availability)
- 11.2.6 SIEMENS
- 11.2.6.1. Overview
- 11.2.6.2. Products
- 11.2.6.3. SWOT Analysis
- 11.2.6.4. Recent Developments
- 11.2.6.5. Financials (Based on Availability)
- 11.2.7 Lantheus
- 11.2.7.1. Overview
- 11.2.7.2. Products
- 11.2.7.3. SWOT Analysis
- 11.2.7.4. Recent Developments
- 11.2.7.5. Financials (Based on Availability)
- 11.2.8 Bracco Imaging
- 11.2.8.1. Overview
- 11.2.8.2. Products
- 11.2.8.3. SWOT Analysis
- 11.2.8.4. Recent Developments
- 11.2.8.5. Financials (Based on Availability)
- 11.2.9 Bayer
- 11.2.9.1. Overview
- 11.2.9.2. Products
- 11.2.9.3. SWOT Analysis
- 11.2.9.4. Recent Developments
- 11.2.9.5. Financials (Based on Availability)
- 11.2.10 Eli Lilly
- 11.2.10.1. Overview
- 11.2.10.2. Products
- 11.2.10.3. SWOT Analysis
- 11.2.10.4. Recent Developments
- 11.2.10.5. Financials (Based on Availability)
- 11.2.11 Aurobindo Pharma
- 11.2.11.1. Overview
- 11.2.11.2. Products
- 11.2.11.3. SWOT Analysis
- 11.2.11.4. Recent Developments
- 11.2.11.5. Financials (Based on Availability)
- 11.2.12 Mundipharma
- 11.2.12.1. Overview
- 11.2.12.2. Products
- 11.2.12.3. SWOT Analysis
- 11.2.12.4. Recent Developments
- 11.2.12.5. Financials (Based on Availability)
- 11.2.13 China Isotope & Radiation
- 11.2.13.1. Overview
- 11.2.13.2. Products
- 11.2.13.3. SWOT Analysis
- 11.2.13.4. Recent Developments
- 11.2.13.5. Financials (Based on Availability)
- 11.2.14 Dongcheng
- 11.2.14.1. Overview
- 11.2.14.2. Products
- 11.2.14.3. SWOT Analysis
- 11.2.14.4. Recent Developments
- 11.2.14.5. Financials (Based on Availability)
- 11.2.1 Cardinal Health
List of Figures
- Figure 1: Global SPECT and PET Radiopharmaceuticals Revenue Breakdown (billion, %) by Region 2025 & 2033
- Figure 2: Global SPECT and PET Radiopharmaceuticals Volume Breakdown (K, %) by Region 2025 & 2033
- Figure 3: North America SPECT and PET Radiopharmaceuticals Revenue (billion), by Application 2025 & 2033
- Figure 4: North America SPECT and PET Radiopharmaceuticals Volume (K), by Application 2025 & 2033
- Figure 5: North America SPECT and PET Radiopharmaceuticals Revenue Share (%), by Application 2025 & 2033
- Figure 6: North America SPECT and PET Radiopharmaceuticals Volume Share (%), by Application 2025 & 2033
- Figure 7: North America SPECT and PET Radiopharmaceuticals Revenue (billion), by Types 2025 & 2033
- Figure 8: North America SPECT and PET Radiopharmaceuticals Volume (K), by Types 2025 & 2033
- Figure 9: North America SPECT and PET Radiopharmaceuticals Revenue Share (%), by Types 2025 & 2033
- Figure 10: North America SPECT and PET Radiopharmaceuticals Volume Share (%), by Types 2025 & 2033
- Figure 11: North America SPECT and PET Radiopharmaceuticals Revenue (billion), by Country 2025 & 2033
- Figure 12: North America SPECT and PET Radiopharmaceuticals Volume (K), by Country 2025 & 2033
- Figure 13: North America SPECT and PET Radiopharmaceuticals Revenue Share (%), by Country 2025 & 2033
- Figure 14: North America SPECT and PET Radiopharmaceuticals Volume Share (%), by Country 2025 & 2033
- Figure 15: South America SPECT and PET Radiopharmaceuticals Revenue (billion), by Application 2025 & 2033
- Figure 16: South America SPECT and PET Radiopharmaceuticals Volume (K), by Application 2025 & 2033
- Figure 17: South America SPECT and PET Radiopharmaceuticals Revenue Share (%), by Application 2025 & 2033
- Figure 18: South America SPECT and PET Radiopharmaceuticals Volume Share (%), by Application 2025 & 2033
- Figure 19: South America SPECT and PET Radiopharmaceuticals Revenue (billion), by Types 2025 & 2033
- Figure 20: South America SPECT and PET Radiopharmaceuticals Volume (K), by Types 2025 & 2033
- Figure 21: South America SPECT and PET Radiopharmaceuticals Revenue Share (%), by Types 2025 & 2033
- Figure 22: South America SPECT and PET Radiopharmaceuticals Volume Share (%), by Types 2025 & 2033
- Figure 23: South America SPECT and PET Radiopharmaceuticals Revenue (billion), by Country 2025 & 2033
- Figure 24: South America SPECT and PET Radiopharmaceuticals Volume (K), by Country 2025 & 2033
- Figure 25: South America SPECT and PET Radiopharmaceuticals Revenue Share (%), by Country 2025 & 2033
- Figure 26: South America SPECT and PET Radiopharmaceuticals Volume Share (%), by Country 2025 & 2033
- Figure 27: Europe SPECT and PET Radiopharmaceuticals Revenue (billion), by Application 2025 & 2033
- Figure 28: Europe SPECT and PET Radiopharmaceuticals Volume (K), by Application 2025 & 2033
- Figure 29: Europe SPECT and PET Radiopharmaceuticals Revenue Share (%), by Application 2025 & 2033
- Figure 30: Europe SPECT and PET Radiopharmaceuticals Volume Share (%), by Application 2025 & 2033
- Figure 31: Europe SPECT and PET Radiopharmaceuticals Revenue (billion), by Types 2025 & 2033
- Figure 32: Europe SPECT and PET Radiopharmaceuticals Volume (K), by Types 2025 & 2033
- Figure 33: Europe SPECT and PET Radiopharmaceuticals Revenue Share (%), by Types 2025 & 2033
- Figure 34: Europe SPECT and PET Radiopharmaceuticals Volume Share (%), by Types 2025 & 2033
- Figure 35: Europe SPECT and PET Radiopharmaceuticals Revenue (billion), by Country 2025 & 2033
- Figure 36: Europe SPECT and PET Radiopharmaceuticals Volume (K), by Country 2025 & 2033
- Figure 37: Europe SPECT and PET Radiopharmaceuticals Revenue Share (%), by Country 2025 & 2033
- Figure 38: Europe SPECT and PET Radiopharmaceuticals Volume Share (%), by Country 2025 & 2033
- Figure 39: Middle East & Africa SPECT and PET Radiopharmaceuticals Revenue (billion), by Application 2025 & 2033
- Figure 40: Middle East & Africa SPECT and PET Radiopharmaceuticals Volume (K), by Application 2025 & 2033
- Figure 41: Middle East & Africa SPECT and PET Radiopharmaceuticals Revenue Share (%), by Application 2025 & 2033
- Figure 42: Middle East & Africa SPECT and PET Radiopharmaceuticals Volume Share (%), by Application 2025 & 2033
- Figure 43: Middle East & Africa SPECT and PET Radiopharmaceuticals Revenue (billion), by Types 2025 & 2033
- Figure 44: Middle East & Africa SPECT and PET Radiopharmaceuticals Volume (K), by Types 2025 & 2033
- Figure 45: Middle East & Africa SPECT and PET Radiopharmaceuticals Revenue Share (%), by Types 2025 & 2033
- Figure 46: Middle East & Africa SPECT and PET Radiopharmaceuticals Volume Share (%), by Types 2025 & 2033
- Figure 47: Middle East & Africa SPECT and PET Radiopharmaceuticals Revenue (billion), by Country 2025 & 2033
- Figure 48: Middle East & Africa SPECT and PET Radiopharmaceuticals Volume (K), by Country 2025 & 2033
- Figure 49: Middle East & Africa SPECT and PET Radiopharmaceuticals Revenue Share (%), by Country 2025 & 2033
- Figure 50: Middle East & Africa SPECT and PET Radiopharmaceuticals Volume Share (%), by Country 2025 & 2033
- Figure 51: Asia Pacific SPECT and PET Radiopharmaceuticals Revenue (billion), by Application 2025 & 2033
- Figure 52: Asia Pacific SPECT and PET Radiopharmaceuticals Volume (K), by Application 2025 & 2033
- Figure 53: Asia Pacific SPECT and PET Radiopharmaceuticals Revenue Share (%), by Application 2025 & 2033
- Figure 54: Asia Pacific SPECT and PET Radiopharmaceuticals Volume Share (%), by Application 2025 & 2033
- Figure 55: Asia Pacific SPECT and PET Radiopharmaceuticals Revenue (billion), by Types 2025 & 2033
- Figure 56: Asia Pacific SPECT and PET Radiopharmaceuticals Volume (K), by Types 2025 & 2033
- Figure 57: Asia Pacific SPECT and PET Radiopharmaceuticals Revenue Share (%), by Types 2025 & 2033
- Figure 58: Asia Pacific SPECT and PET Radiopharmaceuticals Volume Share (%), by Types 2025 & 2033
- Figure 59: Asia Pacific SPECT and PET Radiopharmaceuticals Revenue (billion), by Country 2025 & 2033
- Figure 60: Asia Pacific SPECT and PET Radiopharmaceuticals Volume (K), by Country 2025 & 2033
- Figure 61: Asia Pacific SPECT and PET Radiopharmaceuticals Revenue Share (%), by Country 2025 & 2033
- Figure 62: Asia Pacific SPECT and PET Radiopharmaceuticals Volume Share (%), by Country 2025 & 2033
List of Tables
- Table 1: Global SPECT and PET Radiopharmaceuticals Revenue billion Forecast, by Application 2020 & 2033
- Table 2: Global SPECT and PET Radiopharmaceuticals Volume K Forecast, by Application 2020 & 2033
- Table 3: Global SPECT and PET Radiopharmaceuticals Revenue billion Forecast, by Types 2020 & 2033
- Table 4: Global SPECT and PET Radiopharmaceuticals Volume K Forecast, by Types 2020 & 2033
- Table 5: Global SPECT and PET Radiopharmaceuticals Revenue billion Forecast, by Region 2020 & 2033
- Table 6: Global SPECT and PET Radiopharmaceuticals Volume K Forecast, by Region 2020 & 2033
- Table 7: Global SPECT and PET Radiopharmaceuticals Revenue billion Forecast, by Application 2020 & 2033
- Table 8: Global SPECT and PET Radiopharmaceuticals Volume K Forecast, by Application 2020 & 2033
- Table 9: Global SPECT and PET Radiopharmaceuticals Revenue billion Forecast, by Types 2020 & 2033
- Table 10: Global SPECT and PET Radiopharmaceuticals Volume K Forecast, by Types 2020 & 2033
- Table 11: Global SPECT and PET Radiopharmaceuticals Revenue billion Forecast, by Country 2020 & 2033
- Table 12: Global SPECT and PET Radiopharmaceuticals Volume K Forecast, by Country 2020 & 2033
- Table 13: United States SPECT and PET Radiopharmaceuticals Revenue (billion) Forecast, by Application 2020 & 2033
- Table 14: United States SPECT and PET Radiopharmaceuticals Volume (K) Forecast, by Application 2020 & 2033
- Table 15: Canada SPECT and PET Radiopharmaceuticals Revenue (billion) Forecast, by Application 2020 & 2033
- Table 16: Canada SPECT and PET Radiopharmaceuticals Volume (K) Forecast, by Application 2020 & 2033
- Table 17: Mexico SPECT and PET Radiopharmaceuticals Revenue (billion) Forecast, by Application 2020 & 2033
- Table 18: Mexico SPECT and PET Radiopharmaceuticals Volume (K) Forecast, by Application 2020 & 2033
- Table 19: Global SPECT and PET Radiopharmaceuticals Revenue billion Forecast, by Application 2020 & 2033
- Table 20: Global SPECT and PET Radiopharmaceuticals Volume K Forecast, by Application 2020 & 2033
- Table 21: Global SPECT and PET Radiopharmaceuticals Revenue billion Forecast, by Types 2020 & 2033
- Table 22: Global SPECT and PET Radiopharmaceuticals Volume K Forecast, by Types 2020 & 2033
- Table 23: Global SPECT and PET Radiopharmaceuticals Revenue billion Forecast, by Country 2020 & 2033
- Table 24: Global SPECT and PET Radiopharmaceuticals Volume K Forecast, by Country 2020 & 2033
- Table 25: Brazil SPECT and PET Radiopharmaceuticals Revenue (billion) Forecast, by Application 2020 & 2033
- Table 26: Brazil SPECT and PET Radiopharmaceuticals Volume (K) Forecast, by Application 2020 & 2033
- Table 27: Argentina SPECT and PET Radiopharmaceuticals Revenue (billion) Forecast, by Application 2020 & 2033
- Table 28: Argentina SPECT and PET Radiopharmaceuticals Volume (K) Forecast, by Application 2020 & 2033
- Table 29: Rest of South America SPECT and PET Radiopharmaceuticals Revenue (billion) Forecast, by Application 2020 & 2033
- Table 30: Rest of South America SPECT and PET Radiopharmaceuticals Volume (K) Forecast, by Application 2020 & 2033
- Table 31: Global SPECT and PET Radiopharmaceuticals Revenue billion Forecast, by Application 2020 & 2033
- Table 32: Global SPECT and PET Radiopharmaceuticals Volume K Forecast, by Application 2020 & 2033
- Table 33: Global SPECT and PET Radiopharmaceuticals Revenue billion Forecast, by Types 2020 & 2033
- Table 34: Global SPECT and PET Radiopharmaceuticals Volume K Forecast, by Types 2020 & 2033
- Table 35: Global SPECT and PET Radiopharmaceuticals Revenue billion Forecast, by Country 2020 & 2033
- Table 36: Global SPECT and PET Radiopharmaceuticals Volume K Forecast, by Country 2020 & 2033
- Table 37: United Kingdom SPECT and PET Radiopharmaceuticals Revenue (billion) Forecast, by Application 2020 & 2033
- Table 38: United Kingdom SPECT and PET Radiopharmaceuticals Volume (K) Forecast, by Application 2020 & 2033
- Table 39: Germany SPECT and PET Radiopharmaceuticals Revenue (billion) Forecast, by Application 2020 & 2033
- Table 40: Germany SPECT and PET Radiopharmaceuticals Volume (K) Forecast, by Application 2020 & 2033
- Table 41: France SPECT and PET Radiopharmaceuticals Revenue (billion) Forecast, by Application 2020 & 2033
- Table 42: France SPECT and PET Radiopharmaceuticals Volume (K) Forecast, by Application 2020 & 2033
- Table 43: Italy SPECT and PET Radiopharmaceuticals Revenue (billion) Forecast, by Application 2020 & 2033
- Table 44: Italy SPECT and PET Radiopharmaceuticals Volume (K) Forecast, by Application 2020 & 2033
- Table 45: Spain SPECT and PET Radiopharmaceuticals Revenue (billion) Forecast, by Application 2020 & 2033
- Table 46: Spain SPECT and PET Radiopharmaceuticals Volume (K) Forecast, by Application 2020 & 2033
- Table 47: Russia SPECT and PET Radiopharmaceuticals Revenue (billion) Forecast, by Application 2020 & 2033
- Table 48: Russia SPECT and PET Radiopharmaceuticals Volume (K) Forecast, by Application 2020 & 2033
- Table 49: Benelux SPECT and PET Radiopharmaceuticals Revenue (billion) Forecast, by Application 2020 & 2033
- Table 50: Benelux SPECT and PET Radiopharmaceuticals Volume (K) Forecast, by Application 2020 & 2033
- Table 51: Nordics SPECT and PET Radiopharmaceuticals Revenue (billion) Forecast, by Application 2020 & 2033
- Table 52: Nordics SPECT and PET Radiopharmaceuticals Volume (K) Forecast, by Application 2020 & 2033
- Table 53: Rest of Europe SPECT and PET Radiopharmaceuticals Revenue (billion) Forecast, by Application 2020 & 2033
- Table 54: Rest of Europe SPECT and PET Radiopharmaceuticals Volume (K) Forecast, by Application 2020 & 2033
- Table 55: Global SPECT and PET Radiopharmaceuticals Revenue billion Forecast, by Application 2020 & 2033
- Table 56: Global SPECT and PET Radiopharmaceuticals Volume K Forecast, by Application 2020 & 2033
- Table 57: Global SPECT and PET Radiopharmaceuticals Revenue billion Forecast, by Types 2020 & 2033
- Table 58: Global SPECT and PET Radiopharmaceuticals Volume K Forecast, by Types 2020 & 2033
- Table 59: Global SPECT and PET Radiopharmaceuticals Revenue billion Forecast, by Country 2020 & 2033
- Table 60: Global SPECT and PET Radiopharmaceuticals Volume K Forecast, by Country 2020 & 2033
- Table 61: Turkey SPECT and PET Radiopharmaceuticals Revenue (billion) Forecast, by Application 2020 & 2033
- Table 62: Turkey SPECT and PET Radiopharmaceuticals Volume (K) Forecast, by Application 2020 & 2033
- Table 63: Israel SPECT and PET Radiopharmaceuticals Revenue (billion) Forecast, by Application 2020 & 2033
- Table 64: Israel SPECT and PET Radiopharmaceuticals Volume (K) Forecast, by Application 2020 & 2033
- Table 65: GCC SPECT and PET Radiopharmaceuticals Revenue (billion) Forecast, by Application 2020 & 2033
- Table 66: GCC SPECT and PET Radiopharmaceuticals Volume (K) Forecast, by Application 2020 & 2033
- Table 67: North Africa SPECT and PET Radiopharmaceuticals Revenue (billion) Forecast, by Application 2020 & 2033
- Table 68: North Africa SPECT and PET Radiopharmaceuticals Volume (K) Forecast, by Application 2020 & 2033
- Table 69: South Africa SPECT and PET Radiopharmaceuticals Revenue (billion) Forecast, by Application 2020 & 2033
- Table 70: South Africa SPECT and PET Radiopharmaceuticals Volume (K) Forecast, by Application 2020 & 2033
- Table 71: Rest of Middle East & Africa SPECT and PET Radiopharmaceuticals Revenue (billion) Forecast, by Application 2020 & 2033
- Table 72: Rest of Middle East & Africa SPECT and PET Radiopharmaceuticals Volume (K) Forecast, by Application 2020 & 2033
- Table 73: Global SPECT and PET Radiopharmaceuticals Revenue billion Forecast, by Application 2020 & 2033
- Table 74: Global SPECT and PET Radiopharmaceuticals Volume K Forecast, by Application 2020 & 2033
- Table 75: Global SPECT and PET Radiopharmaceuticals Revenue billion Forecast, by Types 2020 & 2033
- Table 76: Global SPECT and PET Radiopharmaceuticals Volume K Forecast, by Types 2020 & 2033
- Table 77: Global SPECT and PET Radiopharmaceuticals Revenue billion Forecast, by Country 2020 & 2033
- Table 78: Global SPECT and PET Radiopharmaceuticals Volume K Forecast, by Country 2020 & 2033
- Table 79: China SPECT and PET Radiopharmaceuticals Revenue (billion) Forecast, by Application 2020 & 2033
- Table 80: China SPECT and PET Radiopharmaceuticals Volume (K) Forecast, by Application 2020 & 2033
- Table 81: India SPECT and PET Radiopharmaceuticals Revenue (billion) Forecast, by Application 2020 & 2033
- Table 82: India SPECT and PET Radiopharmaceuticals Volume (K) Forecast, by Application 2020 & 2033
- Table 83: Japan SPECT and PET Radiopharmaceuticals Revenue (billion) Forecast, by Application 2020 & 2033
- Table 84: Japan SPECT and PET Radiopharmaceuticals Volume (K) Forecast, by Application 2020 & 2033
- Table 85: South Korea SPECT and PET Radiopharmaceuticals Revenue (billion) Forecast, by Application 2020 & 2033
- Table 86: South Korea SPECT and PET Radiopharmaceuticals Volume (K) Forecast, by Application 2020 & 2033
- Table 87: ASEAN SPECT and PET Radiopharmaceuticals Revenue (billion) Forecast, by Application 2020 & 2033
- Table 88: ASEAN SPECT and PET Radiopharmaceuticals Volume (K) Forecast, by Application 2020 & 2033
- Table 89: Oceania SPECT and PET Radiopharmaceuticals Revenue (billion) Forecast, by Application 2020 & 2033
- Table 90: Oceania SPECT and PET Radiopharmaceuticals Volume (K) Forecast, by Application 2020 & 2033
- Table 91: Rest of Asia Pacific SPECT and PET Radiopharmaceuticals Revenue (billion) Forecast, by Application 2020 & 2033
- Table 92: Rest of Asia Pacific SPECT and PET Radiopharmaceuticals Volume (K) Forecast, by Application 2020 & 2033
Frequently Asked Questions
1. What is the projected Compound Annual Growth Rate (CAGR) of the SPECT and PET Radiopharmaceuticals?
The projected CAGR is approximately 10.3%.
2. Which companies are prominent players in the SPECT and PET Radiopharmaceuticals?
Key companies in the market include Cardinal Health, GE Healthcare, Jubilant Pharma, Novartis, Curium Pharma, SIEMENS, Lantheus, Bracco Imaging, Bayer, Eli Lilly, Aurobindo Pharma, Mundipharma, China Isotope & Radiation, Dongcheng.
3. What are the main segments of the SPECT and PET Radiopharmaceuticals?
The market segments include Application, Types.
4. Can you provide details about the market size?
The market size is estimated to be USD 6.8 billion as of 2022.
5. What are some drivers contributing to market growth?
N/A
6. What are the notable trends driving market growth?
N/A
7. Are there any restraints impacting market growth?
N/A
8. Can you provide examples of recent developments in the market?
N/A
9. What pricing options are available for accessing the report?
Pricing options include single-user, multi-user, and enterprise licenses priced at USD 3950.00, USD 5925.00, and USD 7900.00 respectively.
10. Is the market size provided in terms of value or volume?
The market size is provided in terms of value, measured in billion and volume, measured in K.
11. Are there any specific market keywords associated with the report?
Yes, the market keyword associated with the report is "SPECT and PET Radiopharmaceuticals," which aids in identifying and referencing the specific market segment covered.
12. How do I determine which pricing option suits my needs best?
The pricing options vary based on user requirements and access needs. Individual users may opt for single-user licenses, while businesses requiring broader access may choose multi-user or enterprise licenses for cost-effective access to the report.
13. Are there any additional resources or data provided in the SPECT and PET Radiopharmaceuticals report?
While the report offers comprehensive insights, it's advisable to review the specific contents or supplementary materials provided to ascertain if additional resources or data are available.
14. How can I stay updated on further developments or reports in the SPECT and PET Radiopharmaceuticals?
To stay informed about further developments, trends, and reports in the SPECT and PET Radiopharmaceuticals, consider subscribing to industry newsletters, following relevant companies and organizations, or regularly checking reputable industry news sources and publications.
Methodology
Step 1 - Identification of Relevant Samples Size from Population Database


Step 2 - Approaches for Defining Global Market Size (Value, Volume* & Price*)

Note*: In applicable scenarios
Step 3 - Data Sources
Primary Research
- Web Analytics
- Survey Reports
- Research Institute
- Latest Research Reports
- Opinion Leaders
Secondary Research
- Annual Reports
- White Paper
- Latest Press Release
- Industry Association
- Paid Database
- Investor Presentations

Step 4 - Data Triangulation
Involves using different sources of information in order to increase the validity of a study
These sources are likely to be stakeholders in a program - participants, other researchers, program staff, other community members, and so on.
Then we put all data in single framework & apply various statistical tools to find out the dynamic on the market.
During the analysis stage, feedback from the stakeholder groups would be compared to determine areas of agreement as well as areas of divergence