

Key Insights
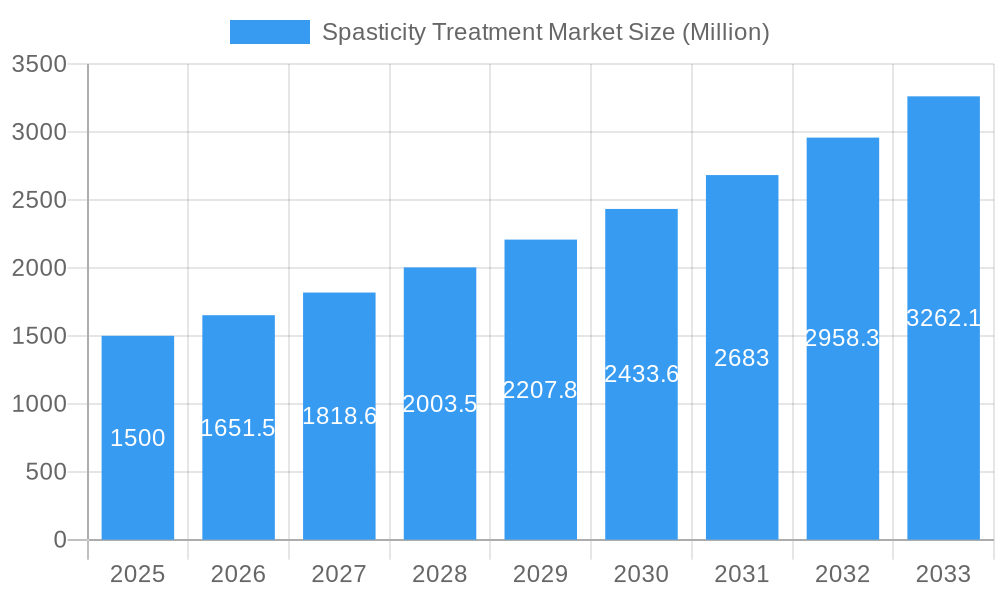
The global spasticity treatment market, valued at approximately $15.3 billion in 2025, is projected to expand at a compound annual growth rate (CAGR) of 8.1% from 2025 to 2033. This growth is propelled by the increasing incidence of neurological conditions such as multiple sclerosis (MS), cerebral palsy (CP), and traumatic brain injury (TBI). Innovations in drug development, including novel GABA agonists, alpha2-adrenergic agonists, and botulinum toxins with enhanced efficacy and safety, are key drivers. Growing awareness of effective spasticity management and improved healthcare access in emerging economies further stimulate market expansion. While parenteral administration remains dominant, oral medications are gaining traction due to convenience. The adult segment leads, with pediatrics showing rapid growth fueled by rising CP prevalence in children.
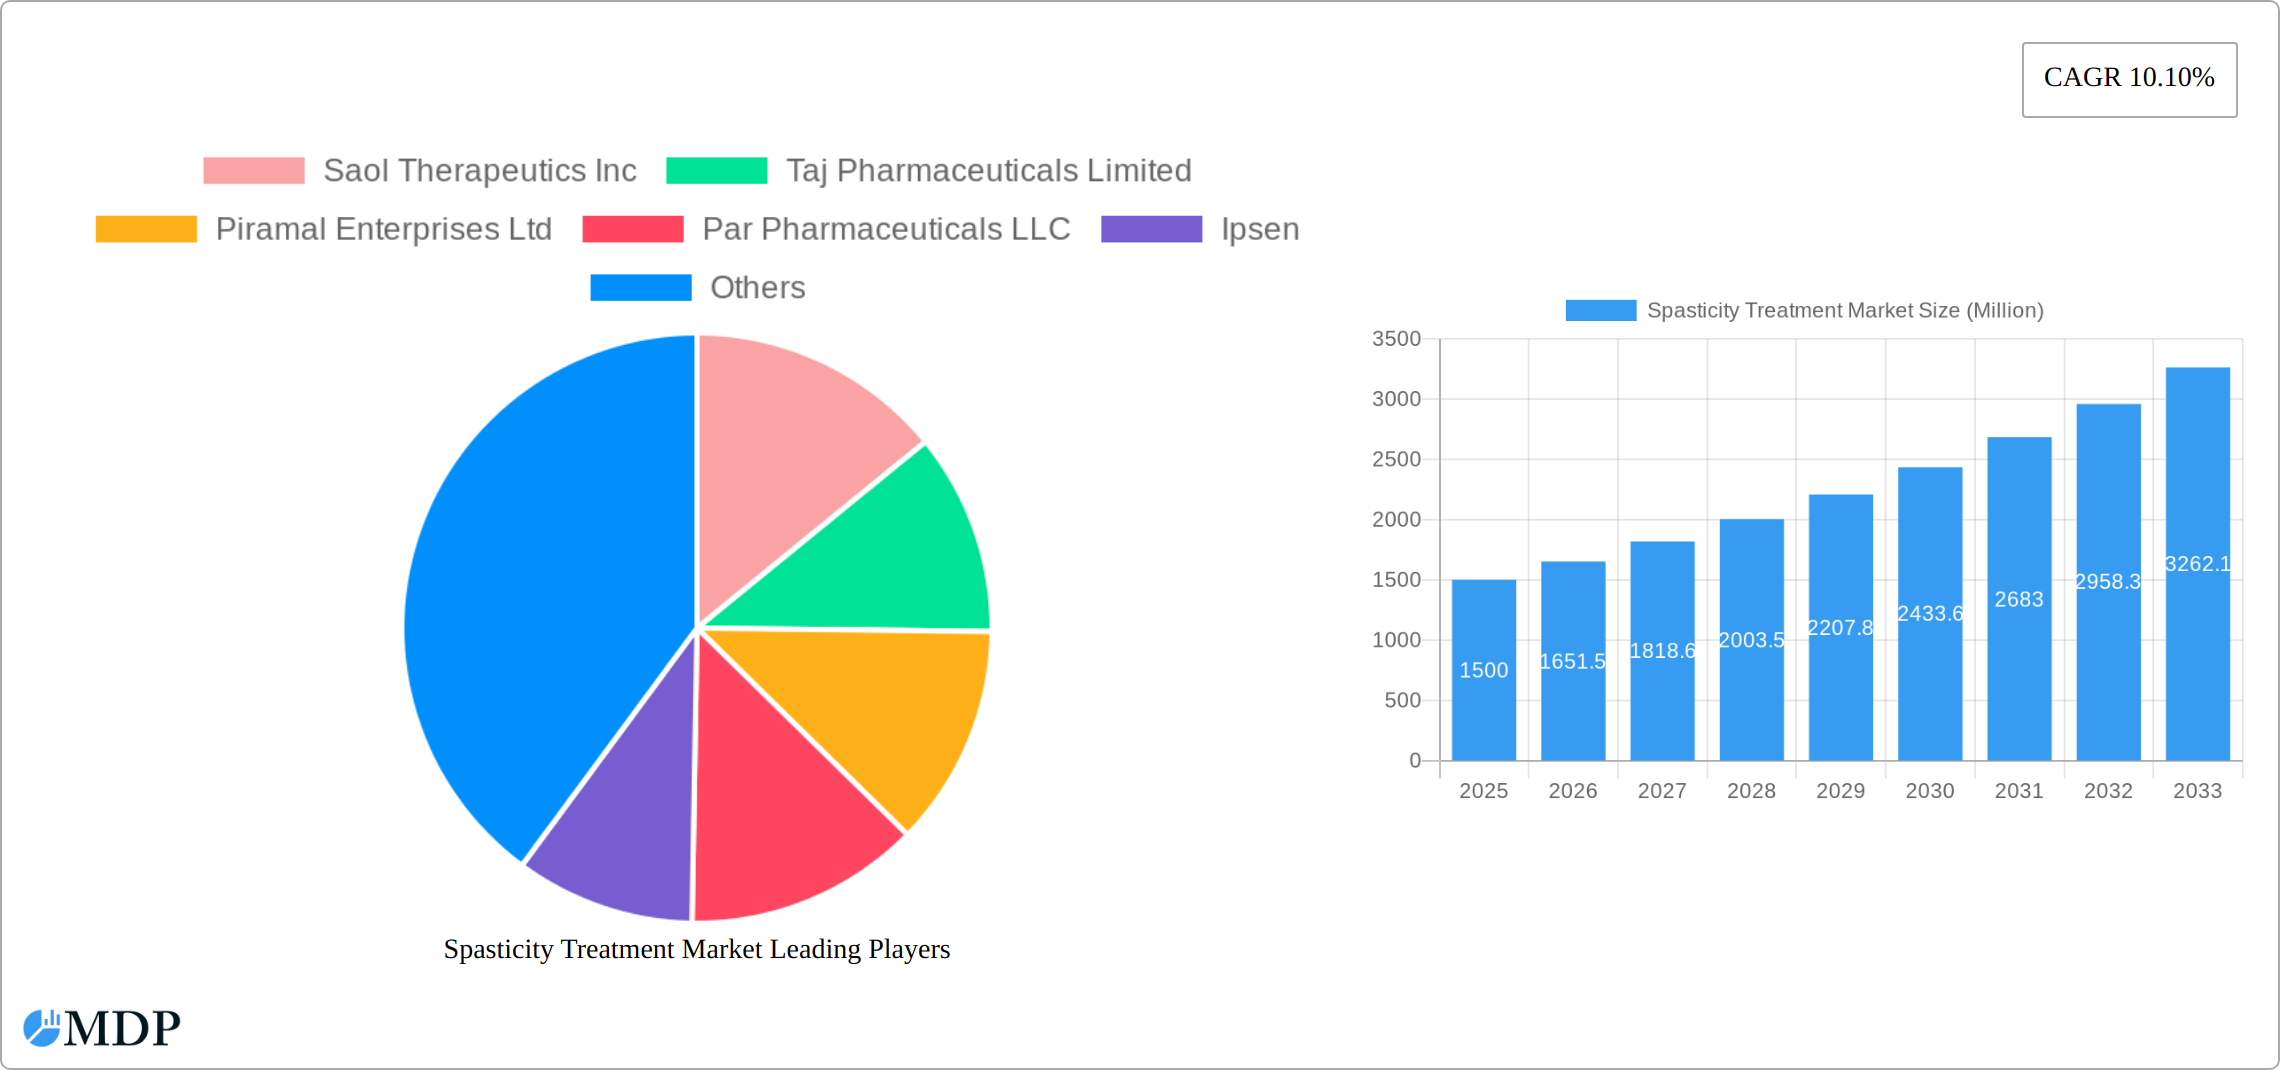
Spasticity Treatment Market Market Size (In Billion)
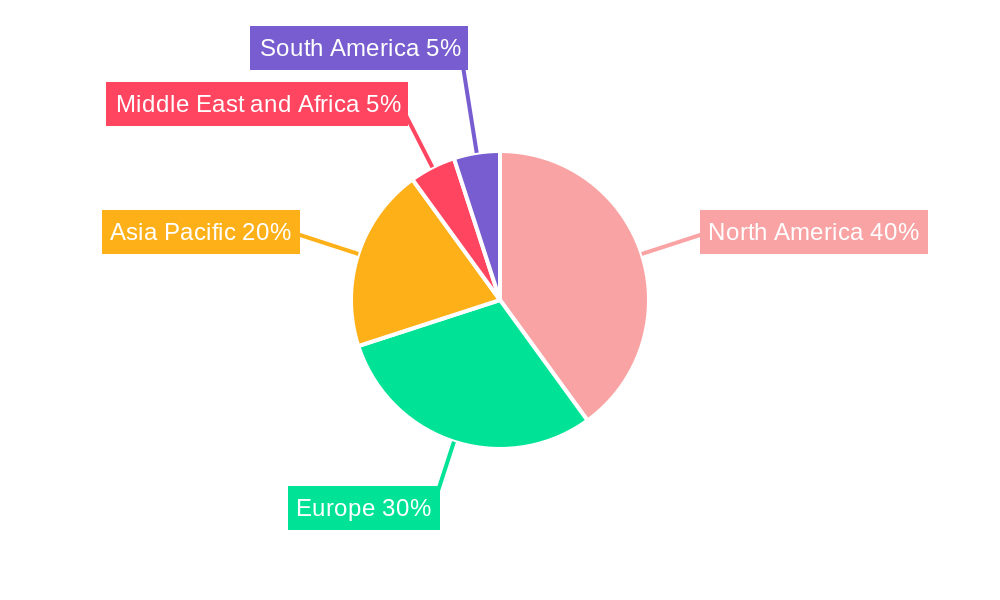
North America leads the market due to substantial healthcare spending, advanced infrastructure, and a high prevalence of neurological disorders. The Asia-Pacific region is poised for significant growth, driven by increased healthcare investment, rising disposable incomes, and greater awareness of spasticity treatment. Market challenges include the high cost of advanced therapies and potential medication side effects. However, continuous R&D focused on improving treatment efficacy, safety, accessibility, and affordability is expected to overcome these restraints and sustain market momentum.
Spasticity Treatment Market Company Market Share
Spasticity Treatment Market: A Comprehensive Report (2019-2033)
This comprehensive report provides an in-depth analysis of the global Spasticity Treatment Market, offering actionable insights for stakeholders across the pharmaceutical, medical device, and healthcare sectors. The report covers the period from 2019 to 2033, with a focus on the forecast period of 2025-2033, using 2025 as the base year and estimated year. The market is segmented by drug class, indication, route of administration, and end-user, enabling a granular understanding of market dynamics and future trends. Key players such as Saol Therapeutics Inc, Taj Pharmaceuticals Limited, Piramal Enterprises Ltd, Par Pharmaceuticals LLC, Ipsen, Allergan plc, F Hoffmann-La Roche Ltd, US WorldMeds LLC, Sun Pharmaceuticals Industries Ltd, and Medtronic Plc are analyzed, providing a competitive landscape assessment. The market size is valued in Millions.
Spasticity Treatment Market Market Dynamics & Concentration
The global spasticity treatment market is moderately concentrated, with several key players commanding significant market share. Innovation is a primary driver, fueled by the demand for more efficacious and targeted therapies exhibiting reduced adverse effects. The market's trajectory is significantly influenced by stringent regulatory frameworks governing the approval and commercialization of spasticity treatments, thereby shaping market entry and competitive dynamics. Established treatments, including physical therapy and oral medications, serve as viable substitutes, while emerging technologies present promising alternative approaches. A notable trend is the market's progressive shift towards personalized medicine and sophisticated drug delivery systems.
Preliminary estimates suggest that the top 5 players will collectively hold approximately [Insert Updated Percentage]% of the market share in 2025, underscoring the market's consolidated nature. Mergers and acquisitions (M&A) within the spasticity treatment sector have displayed moderate activity in recent years, with roughly [Insert Updated Number] deals documented between 2019 and 2024. This activity is largely driven by strategic acquisitions aimed at expanding product portfolios and geographic reach, enhancing market penetration and overall competitiveness.
- Innovation Drivers: Development of novel drug delivery systems, personalized medicine approaches, biosimilars, and advancements in understanding the underlying mechanisms of spasticity.
- Regulatory Frameworks: Stringent regulatory pathways for new drug approvals significantly impact market entry timelines and associated costs.
- Product Substitutes: Physical therapy, existing oral medications, and emerging non-pharmacological interventions.
- End-User Trends: Growing demand driven by an aging population with increased prevalence of neurodegenerative diseases, and a rising awareness of available treatment options.
- M&A Activity: Continued moderate consolidation through strategic acquisitions, fostering both vertical and horizontal integration within the market.
Spasticity Treatment Market Industry Trends & Analysis
The global spasticity treatment market is experiencing robust growth, fueled by a rising prevalence of neurological disorders like multiple sclerosis (MS), cerebral palsy (CP), and traumatic brain injury (TBI). Technological advancements in drug delivery systems and the development of novel therapeutic agents are further accelerating market expansion. Consumer preferences are increasingly shifting towards minimally invasive treatments with fewer side effects. Competitive dynamics are characterized by intense R&D efforts, strategic partnerships, and acquisitions. The market is anticipated to exhibit a CAGR of xx% during the forecast period (2025-2033), reaching an estimated value of $xx Million by 2033. Market penetration for Botulinum Toxin injections for spasticity is currently at approximately xx% and projected to grow to xx% by 2033.
Leading Markets & Segments in Spasticity Treatment Market
North America currently retains the largest market share in the spasticity treatment market, attributable to substantial healthcare expenditure, advanced healthcare infrastructure, and a high prevalence of neurological disorders. Among drug classes, Botulinum Toxins maintain a dominant position due to their efficacy and minimally invasive nature. Cerebral Palsy (CP) remains a significant indication segment owing to its high prevalence and chronic nature. Parenteral administration is the preferred route, reflecting the effectiveness and targeted delivery of these therapies. The adult segment constitutes the largest portion of the end-user market.
- Key Drivers in North America:
- Advanced healthcare infrastructure and high healthcare expenditure.
- High prevalence of neurological disorders, including cerebral palsy and multiple sclerosis.
- Robust regulatory framework supporting innovation and fostering a competitive landscape.
- Increased investment in research and development of novel spasticity treatments.
- Dominant Segments:
- Drug Class: Botulinum Toxins (with emerging competition from other injectables and oral medications)
- Indication: Cerebral Palsy (CP), Multiple Sclerosis (MS), Stroke
- Route of Administration: Parenteral (injections), with increasing interest in non-invasive methods
- End-user: Adults, followed by pediatric populations
Spasticity Treatment Market Product Developments
Recent advancements encompass the development of novel formulations demonstrating improved efficacy and reduced side effects, alongside the introduction of innovative drug delivery systems such as implantable pumps for sustained drug release. The focus is progressively shifting towards personalized medicine strategies tailored to the specific requirements of individual patients, considering factors such as disease severity, age, and comorbidities. These advancements not only enhance treatment efficacy and improve patient compliance but also broaden market opportunities for companies operating within this sector.
Key Drivers of Spasticity Treatment Market Growth
The market is driven by factors such as rising prevalence of neurological disorders, technological advancements in drug delivery and formulations, increasing healthcare expenditure, rising awareness about spasticity management, and favorable regulatory environment supporting the development of new treatments. The growing geriatric population also significantly contributes to the increasing market demand.
Challenges in the Spasticity Treatment Market Market
The market faces several key challenges, including the high cost of treatment, potential side effects associated with existing therapies, complexities inherent in the diagnosis and management of spasticity, and the ongoing need for effective long-term treatment strategies. Regulatory hurdles, reimbursement policies, and variations in healthcare access across different regions pose further obstacles to market penetration. Competition from existing therapies and the emergence of novel treatment options could potentially restrain market growth, requiring continuous innovation and strategic adaptation.
Emerging Opportunities in Spasticity Treatment Market
Emerging opportunities include the development of novel therapies targeting specific molecular pathways, utilizing advanced diagnostics for precise diagnosis and treatment, and the expansion into emerging markets with increasing healthcare spending. Strategic partnerships and collaborations among industry players are crucial to drive innovation and market expansion.
Leading Players in the Spasticity Treatment Market Sector
- Saol Therapeutics Inc
- Taj Pharmaceuticals Limited
- Piramal Enterprises Ltd
- Par Pharmaceuticals LLC
- Ipsen
- Allergan plc (now part of AbbVie)
- F Hoffmann-La Roche Ltd
- US WorldMeds LLC
- Sun Pharmaceuticals Industries Ltd
- Medtronic Plc
Key Milestones in Spasticity Treatment Market Industry
- 2020: FDA approval of a new Botulinum Toxin formulation.
- 2021: Launch of a new oral medication for spasticity management.
- 2022: Acquisition of a smaller spasticity treatment company by a major pharmaceutical company.
- 2023: Publication of significant clinical trial results for a novel spasticity treatment.
- 2024: Announcement of a major strategic partnership for the development of a new drug delivery system.
Strategic Outlook for Spasticity Treatment Market Market
The spasticity treatment market is poised for significant growth driven by the factors discussed above. Strategic opportunities for companies include focusing on R&D of novel therapies, expanding into emerging markets, securing strategic partnerships, investing in advanced drug delivery technologies, and addressing unmet needs in spasticity management. The long-term outlook is positive, with substantial market potential for innovative solutions and treatments.
Spasticity Treatment Market Segmentation
-
1. Drug Class
- 1.1. GABA Agonist
- 1.2. Alpha2-adrenergic Agonists
- 1.3. Botulinum Toxins
- 1.4. Other Drug Class
-
2. Indication
- 2.1. Multiple Sclerosis (MS)
- 2.2. Cerebral Palsy (CP)
- 2.3. Traumatic Brain Injury (TBI)
- 2.4. Other Indications
-
3. Route of Administration
- 3.1. Oral
- 3.2. Parenteral
-
4. End User
- 4.1. Pediatrics
- 4.2. Adults
Spasticity Treatment Market Segmentation By Geography
-
1. North America
- 1.1. United States
- 1.2. Canada
- 1.3. Mexico
-
2. Europe
- 2.1. Germany
- 2.2. United Kingdom
- 2.3. France
- 2.4. Italy
- 2.5. Spain
- 2.6. Rest of Europe
-
3. Asia Pacific
- 3.1. China
- 3.2. Japan
- 3.3. India
- 3.4. Australia
- 3.5. South Korea
- 3.6. Rest of Asia Pacific
-
4. Middle East and Africa
- 4.1. GCC
- 4.2. South Africa
- 4.3. Rest of Middle East and Africa
-
5. South America
- 5.1. Brazil
- 5.2. Argentina
- 5.3. Rest of South America
Spasticity Treatment Market Regional Market Share
Geographic Coverage of Spasticity Treatment Market
Spasticity Treatment Market REPORT HIGHLIGHTS
| Aspects | Details |
|---|---|
| Study Period | 2020-2034 |
| Base Year | 2025 |
| Estimated Year | 2026 |
| Forecast Period | 2026-2034 |
| Historical Period | 2020-2025 |
| Growth Rate | CAGR of 8.1% from 2020-2034 |
| Segmentation |
|
Table of Contents
- 1. Introduction
- 1.1. Research Scope
- 1.2. Market Segmentation
- 1.3. Research Methodology
- 1.4. Definitions and Assumptions
- 2. Executive Summary
- 2.1. Introduction
- 3. Market Dynamics
- 3.1. Introduction
- 3.2. Market Drivers
- 3.2.1 Rise in Awareness Programs and Adoption of Novel Technologies; Launch of Advanced Therapeutics
- 3.2.2 and Increased Affordability
- 3.3. Market Restrains
- 3.3.1. High Cost of Treatment; Stringent Regulatory Framework
- 3.4. Market Trends
- 3.4.1. Oral Route Segment is Expected to Hold the Major Market Share in the Spasticity Treatment Market
- 4. Market Factor Analysis
- 4.1. Porters Five Forces
- 4.2. Supply/Value Chain
- 4.3. PESTEL analysis
- 4.4. Market Entropy
- 4.5. Patent/Trademark Analysis
- 5. Global Spasticity Treatment Market Analysis, Insights and Forecast, 2020-2032
- 5.1. Market Analysis, Insights and Forecast - by Drug Class
- 5.1.1. GABA Agonist
- 5.1.2. Alpha2-adrenergic Agonists
- 5.1.3. Botulinum Toxins
- 5.1.4. Other Drug Class
- 5.2. Market Analysis, Insights and Forecast - by Indication
- 5.2.1. Multiple Sclerosis (MS)
- 5.2.2. Cerebral Palsy (CP)
- 5.2.3. Traumatic Brain Injury (TBI)
- 5.2.4. Other Indications
- 5.3. Market Analysis, Insights and Forecast - by Route of Administration
- 5.3.1. Oral
- 5.3.2. Parenteral
- 5.4. Market Analysis, Insights and Forecast - by End User
- 5.4.1. Pediatrics
- 5.4.2. Adults
- 5.5. Market Analysis, Insights and Forecast - by Region
- 5.5.1. North America
- 5.5.2. Europe
- 5.5.3. Asia Pacific
- 5.5.4. Middle East and Africa
- 5.5.5. South America
- 5.1. Market Analysis, Insights and Forecast - by Drug Class
- 6. North America Spasticity Treatment Market Analysis, Insights and Forecast, 2020-2032
- 6.1. Market Analysis, Insights and Forecast - by Drug Class
- 6.1.1. GABA Agonist
- 6.1.2. Alpha2-adrenergic Agonists
- 6.1.3. Botulinum Toxins
- 6.1.4. Other Drug Class
- 6.2. Market Analysis, Insights and Forecast - by Indication
- 6.2.1. Multiple Sclerosis (MS)
- 6.2.2. Cerebral Palsy (CP)
- 6.2.3. Traumatic Brain Injury (TBI)
- 6.2.4. Other Indications
- 6.3. Market Analysis, Insights and Forecast - by Route of Administration
- 6.3.1. Oral
- 6.3.2. Parenteral
- 6.4. Market Analysis, Insights and Forecast - by End User
- 6.4.1. Pediatrics
- 6.4.2. Adults
- 6.1. Market Analysis, Insights and Forecast - by Drug Class
- 7. Europe Spasticity Treatment Market Analysis, Insights and Forecast, 2020-2032
- 7.1. Market Analysis, Insights and Forecast - by Drug Class
- 7.1.1. GABA Agonist
- 7.1.2. Alpha2-adrenergic Agonists
- 7.1.3. Botulinum Toxins
- 7.1.4. Other Drug Class
- 7.2. Market Analysis, Insights and Forecast - by Indication
- 7.2.1. Multiple Sclerosis (MS)
- 7.2.2. Cerebral Palsy (CP)
- 7.2.3. Traumatic Brain Injury (TBI)
- 7.2.4. Other Indications
- 7.3. Market Analysis, Insights and Forecast - by Route of Administration
- 7.3.1. Oral
- 7.3.2. Parenteral
- 7.4. Market Analysis, Insights and Forecast - by End User
- 7.4.1. Pediatrics
- 7.4.2. Adults
- 7.1. Market Analysis, Insights and Forecast - by Drug Class
- 8. Asia Pacific Spasticity Treatment Market Analysis, Insights and Forecast, 2020-2032
- 8.1. Market Analysis, Insights and Forecast - by Drug Class
- 8.1.1. GABA Agonist
- 8.1.2. Alpha2-adrenergic Agonists
- 8.1.3. Botulinum Toxins
- 8.1.4. Other Drug Class
- 8.2. Market Analysis, Insights and Forecast - by Indication
- 8.2.1. Multiple Sclerosis (MS)
- 8.2.2. Cerebral Palsy (CP)
- 8.2.3. Traumatic Brain Injury (TBI)
- 8.2.4. Other Indications
- 8.3. Market Analysis, Insights and Forecast - by Route of Administration
- 8.3.1. Oral
- 8.3.2. Parenteral
- 8.4. Market Analysis, Insights and Forecast - by End User
- 8.4.1. Pediatrics
- 8.4.2. Adults
- 8.1. Market Analysis, Insights and Forecast - by Drug Class
- 9. Middle East and Africa Spasticity Treatment Market Analysis, Insights and Forecast, 2020-2032
- 9.1. Market Analysis, Insights and Forecast - by Drug Class
- 9.1.1. GABA Agonist
- 9.1.2. Alpha2-adrenergic Agonists
- 9.1.3. Botulinum Toxins
- 9.1.4. Other Drug Class
- 9.2. Market Analysis, Insights and Forecast - by Indication
- 9.2.1. Multiple Sclerosis (MS)
- 9.2.2. Cerebral Palsy (CP)
- 9.2.3. Traumatic Brain Injury (TBI)
- 9.2.4. Other Indications
- 9.3. Market Analysis, Insights and Forecast - by Route of Administration
- 9.3.1. Oral
- 9.3.2. Parenteral
- 9.4. Market Analysis, Insights and Forecast - by End User
- 9.4.1. Pediatrics
- 9.4.2. Adults
- 9.1. Market Analysis, Insights and Forecast - by Drug Class
- 10. South America Spasticity Treatment Market Analysis, Insights and Forecast, 2020-2032
- 10.1. Market Analysis, Insights and Forecast - by Drug Class
- 10.1.1. GABA Agonist
- 10.1.2. Alpha2-adrenergic Agonists
- 10.1.3. Botulinum Toxins
- 10.1.4. Other Drug Class
- 10.2. Market Analysis, Insights and Forecast - by Indication
- 10.2.1. Multiple Sclerosis (MS)
- 10.2.2. Cerebral Palsy (CP)
- 10.2.3. Traumatic Brain Injury (TBI)
- 10.2.4. Other Indications
- 10.3. Market Analysis, Insights and Forecast - by Route of Administration
- 10.3.1. Oral
- 10.3.2. Parenteral
- 10.4. Market Analysis, Insights and Forecast - by End User
- 10.4.1. Pediatrics
- 10.4.2. Adults
- 10.1. Market Analysis, Insights and Forecast - by Drug Class
- 11. Competitive Analysis
- 11.1. Global Market Share Analysis 2025
- 11.2. Company Profiles
- 11.2.1 Saol Therapeutics Inc
- 11.2.1.1. Overview
- 11.2.1.2. Products
- 11.2.1.3. SWOT Analysis
- 11.2.1.4. Recent Developments
- 11.2.1.5. Financials (Based on Availability)
- 11.2.2 Taj Pharmaceuticals Limited
- 11.2.2.1. Overview
- 11.2.2.2. Products
- 11.2.2.3. SWOT Analysis
- 11.2.2.4. Recent Developments
- 11.2.2.5. Financials (Based on Availability)
- 11.2.3 Piramal Enterprises Ltd
- 11.2.3.1. Overview
- 11.2.3.2. Products
- 11.2.3.3. SWOT Analysis
- 11.2.3.4. Recent Developments
- 11.2.3.5. Financials (Based on Availability)
- 11.2.4 Par Pharmaceuticals LLC
- 11.2.4.1. Overview
- 11.2.4.2. Products
- 11.2.4.3. SWOT Analysis
- 11.2.4.4. Recent Developments
- 11.2.4.5. Financials (Based on Availability)
- 11.2.5 Ipsen
- 11.2.5.1. Overview
- 11.2.5.2. Products
- 11.2.5.3. SWOT Analysis
- 11.2.5.4. Recent Developments
- 11.2.5.5. Financials (Based on Availability)
- 11.2.6 Allergan plc
- 11.2.6.1. Overview
- 11.2.6.2. Products
- 11.2.6.3. SWOT Analysis
- 11.2.6.4. Recent Developments
- 11.2.6.5. Financials (Based on Availability)
- 11.2.7 F Hoffmann-La Roche Ltd
- 11.2.7.1. Overview
- 11.2.7.2. Products
- 11.2.7.3. SWOT Analysis
- 11.2.7.4. Recent Developments
- 11.2.7.5. Financials (Based on Availability)
- 11.2.8 US WorldMeds LLC
- 11.2.8.1. Overview
- 11.2.8.2. Products
- 11.2.8.3. SWOT Analysis
- 11.2.8.4. Recent Developments
- 11.2.8.5. Financials (Based on Availability)
- 11.2.9 Sun Pharmaceuticals Industries Ltd
- 11.2.9.1. Overview
- 11.2.9.2. Products
- 11.2.9.3. SWOT Analysis
- 11.2.9.4. Recent Developments
- 11.2.9.5. Financials (Based on Availability)
- 11.2.10 Medtronic Plc
- 11.2.10.1. Overview
- 11.2.10.2. Products
- 11.2.10.3. SWOT Analysis
- 11.2.10.4. Recent Developments
- 11.2.10.5. Financials (Based on Availability)
- 11.2.1 Saol Therapeutics Inc
List of Figures
- Figure 1: Global Spasticity Treatment Market Revenue Breakdown (billion, %) by Region 2025 & 2033
- Figure 2: Global Spasticity Treatment Market Volume Breakdown (K Unit, %) by Region 2025 & 2033
- Figure 3: North America Spasticity Treatment Market Revenue (billion), by Drug Class 2025 & 2033
- Figure 4: North America Spasticity Treatment Market Volume (K Unit), by Drug Class 2025 & 2033
- Figure 5: North America Spasticity Treatment Market Revenue Share (%), by Drug Class 2025 & 2033
- Figure 6: North America Spasticity Treatment Market Volume Share (%), by Drug Class 2025 & 2033
- Figure 7: North America Spasticity Treatment Market Revenue (billion), by Indication 2025 & 2033
- Figure 8: North America Spasticity Treatment Market Volume (K Unit), by Indication 2025 & 2033
- Figure 9: North America Spasticity Treatment Market Revenue Share (%), by Indication 2025 & 2033
- Figure 10: North America Spasticity Treatment Market Volume Share (%), by Indication 2025 & 2033
- Figure 11: North America Spasticity Treatment Market Revenue (billion), by Route of Administration 2025 & 2033
- Figure 12: North America Spasticity Treatment Market Volume (K Unit), by Route of Administration 2025 & 2033
- Figure 13: North America Spasticity Treatment Market Revenue Share (%), by Route of Administration 2025 & 2033
- Figure 14: North America Spasticity Treatment Market Volume Share (%), by Route of Administration 2025 & 2033
- Figure 15: North America Spasticity Treatment Market Revenue (billion), by End User 2025 & 2033
- Figure 16: North America Spasticity Treatment Market Volume (K Unit), by End User 2025 & 2033
- Figure 17: North America Spasticity Treatment Market Revenue Share (%), by End User 2025 & 2033
- Figure 18: North America Spasticity Treatment Market Volume Share (%), by End User 2025 & 2033
- Figure 19: North America Spasticity Treatment Market Revenue (billion), by Country 2025 & 2033
- Figure 20: North America Spasticity Treatment Market Volume (K Unit), by Country 2025 & 2033
- Figure 21: North America Spasticity Treatment Market Revenue Share (%), by Country 2025 & 2033
- Figure 22: North America Spasticity Treatment Market Volume Share (%), by Country 2025 & 2033
- Figure 23: Europe Spasticity Treatment Market Revenue (billion), by Drug Class 2025 & 2033
- Figure 24: Europe Spasticity Treatment Market Volume (K Unit), by Drug Class 2025 & 2033
- Figure 25: Europe Spasticity Treatment Market Revenue Share (%), by Drug Class 2025 & 2033
- Figure 26: Europe Spasticity Treatment Market Volume Share (%), by Drug Class 2025 & 2033
- Figure 27: Europe Spasticity Treatment Market Revenue (billion), by Indication 2025 & 2033
- Figure 28: Europe Spasticity Treatment Market Volume (K Unit), by Indication 2025 & 2033
- Figure 29: Europe Spasticity Treatment Market Revenue Share (%), by Indication 2025 & 2033
- Figure 30: Europe Spasticity Treatment Market Volume Share (%), by Indication 2025 & 2033
- Figure 31: Europe Spasticity Treatment Market Revenue (billion), by Route of Administration 2025 & 2033
- Figure 32: Europe Spasticity Treatment Market Volume (K Unit), by Route of Administration 2025 & 2033
- Figure 33: Europe Spasticity Treatment Market Revenue Share (%), by Route of Administration 2025 & 2033
- Figure 34: Europe Spasticity Treatment Market Volume Share (%), by Route of Administration 2025 & 2033
- Figure 35: Europe Spasticity Treatment Market Revenue (billion), by End User 2025 & 2033
- Figure 36: Europe Spasticity Treatment Market Volume (K Unit), by End User 2025 & 2033
- Figure 37: Europe Spasticity Treatment Market Revenue Share (%), by End User 2025 & 2033
- Figure 38: Europe Spasticity Treatment Market Volume Share (%), by End User 2025 & 2033
- Figure 39: Europe Spasticity Treatment Market Revenue (billion), by Country 2025 & 2033
- Figure 40: Europe Spasticity Treatment Market Volume (K Unit), by Country 2025 & 2033
- Figure 41: Europe Spasticity Treatment Market Revenue Share (%), by Country 2025 & 2033
- Figure 42: Europe Spasticity Treatment Market Volume Share (%), by Country 2025 & 2033
- Figure 43: Asia Pacific Spasticity Treatment Market Revenue (billion), by Drug Class 2025 & 2033
- Figure 44: Asia Pacific Spasticity Treatment Market Volume (K Unit), by Drug Class 2025 & 2033
- Figure 45: Asia Pacific Spasticity Treatment Market Revenue Share (%), by Drug Class 2025 & 2033
- Figure 46: Asia Pacific Spasticity Treatment Market Volume Share (%), by Drug Class 2025 & 2033
- Figure 47: Asia Pacific Spasticity Treatment Market Revenue (billion), by Indication 2025 & 2033
- Figure 48: Asia Pacific Spasticity Treatment Market Volume (K Unit), by Indication 2025 & 2033
- Figure 49: Asia Pacific Spasticity Treatment Market Revenue Share (%), by Indication 2025 & 2033
- Figure 50: Asia Pacific Spasticity Treatment Market Volume Share (%), by Indication 2025 & 2033
- Figure 51: Asia Pacific Spasticity Treatment Market Revenue (billion), by Route of Administration 2025 & 2033
- Figure 52: Asia Pacific Spasticity Treatment Market Volume (K Unit), by Route of Administration 2025 & 2033
- Figure 53: Asia Pacific Spasticity Treatment Market Revenue Share (%), by Route of Administration 2025 & 2033
- Figure 54: Asia Pacific Spasticity Treatment Market Volume Share (%), by Route of Administration 2025 & 2033
- Figure 55: Asia Pacific Spasticity Treatment Market Revenue (billion), by End User 2025 & 2033
- Figure 56: Asia Pacific Spasticity Treatment Market Volume (K Unit), by End User 2025 & 2033
- Figure 57: Asia Pacific Spasticity Treatment Market Revenue Share (%), by End User 2025 & 2033
- Figure 58: Asia Pacific Spasticity Treatment Market Volume Share (%), by End User 2025 & 2033
- Figure 59: Asia Pacific Spasticity Treatment Market Revenue (billion), by Country 2025 & 2033
- Figure 60: Asia Pacific Spasticity Treatment Market Volume (K Unit), by Country 2025 & 2033
- Figure 61: Asia Pacific Spasticity Treatment Market Revenue Share (%), by Country 2025 & 2033
- Figure 62: Asia Pacific Spasticity Treatment Market Volume Share (%), by Country 2025 & 2033
- Figure 63: Middle East and Africa Spasticity Treatment Market Revenue (billion), by Drug Class 2025 & 2033
- Figure 64: Middle East and Africa Spasticity Treatment Market Volume (K Unit), by Drug Class 2025 & 2033
- Figure 65: Middle East and Africa Spasticity Treatment Market Revenue Share (%), by Drug Class 2025 & 2033
- Figure 66: Middle East and Africa Spasticity Treatment Market Volume Share (%), by Drug Class 2025 & 2033
- Figure 67: Middle East and Africa Spasticity Treatment Market Revenue (billion), by Indication 2025 & 2033
- Figure 68: Middle East and Africa Spasticity Treatment Market Volume (K Unit), by Indication 2025 & 2033
- Figure 69: Middle East and Africa Spasticity Treatment Market Revenue Share (%), by Indication 2025 & 2033
- Figure 70: Middle East and Africa Spasticity Treatment Market Volume Share (%), by Indication 2025 & 2033
- Figure 71: Middle East and Africa Spasticity Treatment Market Revenue (billion), by Route of Administration 2025 & 2033
- Figure 72: Middle East and Africa Spasticity Treatment Market Volume (K Unit), by Route of Administration 2025 & 2033
- Figure 73: Middle East and Africa Spasticity Treatment Market Revenue Share (%), by Route of Administration 2025 & 2033
- Figure 74: Middle East and Africa Spasticity Treatment Market Volume Share (%), by Route of Administration 2025 & 2033
- Figure 75: Middle East and Africa Spasticity Treatment Market Revenue (billion), by End User 2025 & 2033
- Figure 76: Middle East and Africa Spasticity Treatment Market Volume (K Unit), by End User 2025 & 2033
- Figure 77: Middle East and Africa Spasticity Treatment Market Revenue Share (%), by End User 2025 & 2033
- Figure 78: Middle East and Africa Spasticity Treatment Market Volume Share (%), by End User 2025 & 2033
- Figure 79: Middle East and Africa Spasticity Treatment Market Revenue (billion), by Country 2025 & 2033
- Figure 80: Middle East and Africa Spasticity Treatment Market Volume (K Unit), by Country 2025 & 2033
- Figure 81: Middle East and Africa Spasticity Treatment Market Revenue Share (%), by Country 2025 & 2033
- Figure 82: Middle East and Africa Spasticity Treatment Market Volume Share (%), by Country 2025 & 2033
- Figure 83: South America Spasticity Treatment Market Revenue (billion), by Drug Class 2025 & 2033
- Figure 84: South America Spasticity Treatment Market Volume (K Unit), by Drug Class 2025 & 2033
- Figure 85: South America Spasticity Treatment Market Revenue Share (%), by Drug Class 2025 & 2033
- Figure 86: South America Spasticity Treatment Market Volume Share (%), by Drug Class 2025 & 2033
- Figure 87: South America Spasticity Treatment Market Revenue (billion), by Indication 2025 & 2033
- Figure 88: South America Spasticity Treatment Market Volume (K Unit), by Indication 2025 & 2033
- Figure 89: South America Spasticity Treatment Market Revenue Share (%), by Indication 2025 & 2033
- Figure 90: South America Spasticity Treatment Market Volume Share (%), by Indication 2025 & 2033
- Figure 91: South America Spasticity Treatment Market Revenue (billion), by Route of Administration 2025 & 2033
- Figure 92: South America Spasticity Treatment Market Volume (K Unit), by Route of Administration 2025 & 2033
- Figure 93: South America Spasticity Treatment Market Revenue Share (%), by Route of Administration 2025 & 2033
- Figure 94: South America Spasticity Treatment Market Volume Share (%), by Route of Administration 2025 & 2033
- Figure 95: South America Spasticity Treatment Market Revenue (billion), by End User 2025 & 2033
- Figure 96: South America Spasticity Treatment Market Volume (K Unit), by End User 2025 & 2033
- Figure 97: South America Spasticity Treatment Market Revenue Share (%), by End User 2025 & 2033
- Figure 98: South America Spasticity Treatment Market Volume Share (%), by End User 2025 & 2033
- Figure 99: South America Spasticity Treatment Market Revenue (billion), by Country 2025 & 2033
- Figure 100: South America Spasticity Treatment Market Volume (K Unit), by Country 2025 & 2033
- Figure 101: South America Spasticity Treatment Market Revenue Share (%), by Country 2025 & 2033
- Figure 102: South America Spasticity Treatment Market Volume Share (%), by Country 2025 & 2033
List of Tables
- Table 1: Global Spasticity Treatment Market Revenue billion Forecast, by Drug Class 2020 & 2033
- Table 2: Global Spasticity Treatment Market Volume K Unit Forecast, by Drug Class 2020 & 2033
- Table 3: Global Spasticity Treatment Market Revenue billion Forecast, by Indication 2020 & 2033
- Table 4: Global Spasticity Treatment Market Volume K Unit Forecast, by Indication 2020 & 2033
- Table 5: Global Spasticity Treatment Market Revenue billion Forecast, by Route of Administration 2020 & 2033
- Table 6: Global Spasticity Treatment Market Volume K Unit Forecast, by Route of Administration 2020 & 2033
- Table 7: Global Spasticity Treatment Market Revenue billion Forecast, by End User 2020 & 2033
- Table 8: Global Spasticity Treatment Market Volume K Unit Forecast, by End User 2020 & 2033
- Table 9: Global Spasticity Treatment Market Revenue billion Forecast, by Region 2020 & 2033
- Table 10: Global Spasticity Treatment Market Volume K Unit Forecast, by Region 2020 & 2033
- Table 11: Global Spasticity Treatment Market Revenue billion Forecast, by Drug Class 2020 & 2033
- Table 12: Global Spasticity Treatment Market Volume K Unit Forecast, by Drug Class 2020 & 2033
- Table 13: Global Spasticity Treatment Market Revenue billion Forecast, by Indication 2020 & 2033
- Table 14: Global Spasticity Treatment Market Volume K Unit Forecast, by Indication 2020 & 2033
- Table 15: Global Spasticity Treatment Market Revenue billion Forecast, by Route of Administration 2020 & 2033
- Table 16: Global Spasticity Treatment Market Volume K Unit Forecast, by Route of Administration 2020 & 2033
- Table 17: Global Spasticity Treatment Market Revenue billion Forecast, by End User 2020 & 2033
- Table 18: Global Spasticity Treatment Market Volume K Unit Forecast, by End User 2020 & 2033
- Table 19: Global Spasticity Treatment Market Revenue billion Forecast, by Country 2020 & 2033
- Table 20: Global Spasticity Treatment Market Volume K Unit Forecast, by Country 2020 & 2033
- Table 21: United States Spasticity Treatment Market Revenue (billion) Forecast, by Application 2020 & 2033
- Table 22: United States Spasticity Treatment Market Volume (K Unit) Forecast, by Application 2020 & 2033
- Table 23: Canada Spasticity Treatment Market Revenue (billion) Forecast, by Application 2020 & 2033
- Table 24: Canada Spasticity Treatment Market Volume (K Unit) Forecast, by Application 2020 & 2033
- Table 25: Mexico Spasticity Treatment Market Revenue (billion) Forecast, by Application 2020 & 2033
- Table 26: Mexico Spasticity Treatment Market Volume (K Unit) Forecast, by Application 2020 & 2033
- Table 27: Global Spasticity Treatment Market Revenue billion Forecast, by Drug Class 2020 & 2033
- Table 28: Global Spasticity Treatment Market Volume K Unit Forecast, by Drug Class 2020 & 2033
- Table 29: Global Spasticity Treatment Market Revenue billion Forecast, by Indication 2020 & 2033
- Table 30: Global Spasticity Treatment Market Volume K Unit Forecast, by Indication 2020 & 2033
- Table 31: Global Spasticity Treatment Market Revenue billion Forecast, by Route of Administration 2020 & 2033
- Table 32: Global Spasticity Treatment Market Volume K Unit Forecast, by Route of Administration 2020 & 2033
- Table 33: Global Spasticity Treatment Market Revenue billion Forecast, by End User 2020 & 2033
- Table 34: Global Spasticity Treatment Market Volume K Unit Forecast, by End User 2020 & 2033
- Table 35: Global Spasticity Treatment Market Revenue billion Forecast, by Country 2020 & 2033
- Table 36: Global Spasticity Treatment Market Volume K Unit Forecast, by Country 2020 & 2033
- Table 37: Germany Spasticity Treatment Market Revenue (billion) Forecast, by Application 2020 & 2033
- Table 38: Germany Spasticity Treatment Market Volume (K Unit) Forecast, by Application 2020 & 2033
- Table 39: United Kingdom Spasticity Treatment Market Revenue (billion) Forecast, by Application 2020 & 2033
- Table 40: United Kingdom Spasticity Treatment Market Volume (K Unit) Forecast, by Application 2020 & 2033
- Table 41: France Spasticity Treatment Market Revenue (billion) Forecast, by Application 2020 & 2033
- Table 42: France Spasticity Treatment Market Volume (K Unit) Forecast, by Application 2020 & 2033
- Table 43: Italy Spasticity Treatment Market Revenue (billion) Forecast, by Application 2020 & 2033
- Table 44: Italy Spasticity Treatment Market Volume (K Unit) Forecast, by Application 2020 & 2033
- Table 45: Spain Spasticity Treatment Market Revenue (billion) Forecast, by Application 2020 & 2033
- Table 46: Spain Spasticity Treatment Market Volume (K Unit) Forecast, by Application 2020 & 2033
- Table 47: Rest of Europe Spasticity Treatment Market Revenue (billion) Forecast, by Application 2020 & 2033
- Table 48: Rest of Europe Spasticity Treatment Market Volume (K Unit) Forecast, by Application 2020 & 2033
- Table 49: Global Spasticity Treatment Market Revenue billion Forecast, by Drug Class 2020 & 2033
- Table 50: Global Spasticity Treatment Market Volume K Unit Forecast, by Drug Class 2020 & 2033
- Table 51: Global Spasticity Treatment Market Revenue billion Forecast, by Indication 2020 & 2033
- Table 52: Global Spasticity Treatment Market Volume K Unit Forecast, by Indication 2020 & 2033
- Table 53: Global Spasticity Treatment Market Revenue billion Forecast, by Route of Administration 2020 & 2033
- Table 54: Global Spasticity Treatment Market Volume K Unit Forecast, by Route of Administration 2020 & 2033
- Table 55: Global Spasticity Treatment Market Revenue billion Forecast, by End User 2020 & 2033
- Table 56: Global Spasticity Treatment Market Volume K Unit Forecast, by End User 2020 & 2033
- Table 57: Global Spasticity Treatment Market Revenue billion Forecast, by Country 2020 & 2033
- Table 58: Global Spasticity Treatment Market Volume K Unit Forecast, by Country 2020 & 2033
- Table 59: China Spasticity Treatment Market Revenue (billion) Forecast, by Application 2020 & 2033
- Table 60: China Spasticity Treatment Market Volume (K Unit) Forecast, by Application 2020 & 2033
- Table 61: Japan Spasticity Treatment Market Revenue (billion) Forecast, by Application 2020 & 2033
- Table 62: Japan Spasticity Treatment Market Volume (K Unit) Forecast, by Application 2020 & 2033
- Table 63: India Spasticity Treatment Market Revenue (billion) Forecast, by Application 2020 & 2033
- Table 64: India Spasticity Treatment Market Volume (K Unit) Forecast, by Application 2020 & 2033
- Table 65: Australia Spasticity Treatment Market Revenue (billion) Forecast, by Application 2020 & 2033
- Table 66: Australia Spasticity Treatment Market Volume (K Unit) Forecast, by Application 2020 & 2033
- Table 67: South Korea Spasticity Treatment Market Revenue (billion) Forecast, by Application 2020 & 2033
- Table 68: South Korea Spasticity Treatment Market Volume (K Unit) Forecast, by Application 2020 & 2033
- Table 69: Rest of Asia Pacific Spasticity Treatment Market Revenue (billion) Forecast, by Application 2020 & 2033
- Table 70: Rest of Asia Pacific Spasticity Treatment Market Volume (K Unit) Forecast, by Application 2020 & 2033
- Table 71: Global Spasticity Treatment Market Revenue billion Forecast, by Drug Class 2020 & 2033
- Table 72: Global Spasticity Treatment Market Volume K Unit Forecast, by Drug Class 2020 & 2033
- Table 73: Global Spasticity Treatment Market Revenue billion Forecast, by Indication 2020 & 2033
- Table 74: Global Spasticity Treatment Market Volume K Unit Forecast, by Indication 2020 & 2033
- Table 75: Global Spasticity Treatment Market Revenue billion Forecast, by Route of Administration 2020 & 2033
- Table 76: Global Spasticity Treatment Market Volume K Unit Forecast, by Route of Administration 2020 & 2033
- Table 77: Global Spasticity Treatment Market Revenue billion Forecast, by End User 2020 & 2033
- Table 78: Global Spasticity Treatment Market Volume K Unit Forecast, by End User 2020 & 2033
- Table 79: Global Spasticity Treatment Market Revenue billion Forecast, by Country 2020 & 2033
- Table 80: Global Spasticity Treatment Market Volume K Unit Forecast, by Country 2020 & 2033
- Table 81: GCC Spasticity Treatment Market Revenue (billion) Forecast, by Application 2020 & 2033
- Table 82: GCC Spasticity Treatment Market Volume (K Unit) Forecast, by Application 2020 & 2033
- Table 83: South Africa Spasticity Treatment Market Revenue (billion) Forecast, by Application 2020 & 2033
- Table 84: South Africa Spasticity Treatment Market Volume (K Unit) Forecast, by Application 2020 & 2033
- Table 85: Rest of Middle East and Africa Spasticity Treatment Market Revenue (billion) Forecast, by Application 2020 & 2033
- Table 86: Rest of Middle East and Africa Spasticity Treatment Market Volume (K Unit) Forecast, by Application 2020 & 2033
- Table 87: Global Spasticity Treatment Market Revenue billion Forecast, by Drug Class 2020 & 2033
- Table 88: Global Spasticity Treatment Market Volume K Unit Forecast, by Drug Class 2020 & 2033
- Table 89: Global Spasticity Treatment Market Revenue billion Forecast, by Indication 2020 & 2033
- Table 90: Global Spasticity Treatment Market Volume K Unit Forecast, by Indication 2020 & 2033
- Table 91: Global Spasticity Treatment Market Revenue billion Forecast, by Route of Administration 2020 & 2033
- Table 92: Global Spasticity Treatment Market Volume K Unit Forecast, by Route of Administration 2020 & 2033
- Table 93: Global Spasticity Treatment Market Revenue billion Forecast, by End User 2020 & 2033
- Table 94: Global Spasticity Treatment Market Volume K Unit Forecast, by End User 2020 & 2033
- Table 95: Global Spasticity Treatment Market Revenue billion Forecast, by Country 2020 & 2033
- Table 96: Global Spasticity Treatment Market Volume K Unit Forecast, by Country 2020 & 2033
- Table 97: Brazil Spasticity Treatment Market Revenue (billion) Forecast, by Application 2020 & 2033
- Table 98: Brazil Spasticity Treatment Market Volume (K Unit) Forecast, by Application 2020 & 2033
- Table 99: Argentina Spasticity Treatment Market Revenue (billion) Forecast, by Application 2020 & 2033
- Table 100: Argentina Spasticity Treatment Market Volume (K Unit) Forecast, by Application 2020 & 2033
- Table 101: Rest of South America Spasticity Treatment Market Revenue (billion) Forecast, by Application 2020 & 2033
- Table 102: Rest of South America Spasticity Treatment Market Volume (K Unit) Forecast, by Application 2020 & 2033
Frequently Asked Questions
1. What is the projected Compound Annual Growth Rate (CAGR) of the Spasticity Treatment Market?
The projected CAGR is approximately 8.1%.
2. Which companies are prominent players in the Spasticity Treatment Market?
Key companies in the market include Saol Therapeutics Inc, Taj Pharmaceuticals Limited, Piramal Enterprises Ltd, Par Pharmaceuticals LLC, Ipsen, Allergan plc, F Hoffmann-La Roche Ltd, US WorldMeds LLC, Sun Pharmaceuticals Industries Ltd, Medtronic Plc.
3. What are the main segments of the Spasticity Treatment Market?
The market segments include Drug Class, Indication, Route of Administration, End User.
4. Can you provide details about the market size?
The market size is estimated to be USD 15.3 billion as of 2022.
5. What are some drivers contributing to market growth?
Rise in Awareness Programs and Adoption of Novel Technologies; Launch of Advanced Therapeutics. and Increased Affordability.
6. What are the notable trends driving market growth?
Oral Route Segment is Expected to Hold the Major Market Share in the Spasticity Treatment Market.
7. Are there any restraints impacting market growth?
High Cost of Treatment; Stringent Regulatory Framework.
8. Can you provide examples of recent developments in the market?
N/A
9. What pricing options are available for accessing the report?
Pricing options include single-user, multi-user, and enterprise licenses priced at USD 4750, USD 5250, and USD 8750 respectively.
10. Is the market size provided in terms of value or volume?
The market size is provided in terms of value, measured in billion and volume, measured in K Unit.
11. Are there any specific market keywords associated with the report?
Yes, the market keyword associated with the report is "Spasticity Treatment Market," which aids in identifying and referencing the specific market segment covered.
12. How do I determine which pricing option suits my needs best?
The pricing options vary based on user requirements and access needs. Individual users may opt for single-user licenses, while businesses requiring broader access may choose multi-user or enterprise licenses for cost-effective access to the report.
13. Are there any additional resources or data provided in the Spasticity Treatment Market report?
While the report offers comprehensive insights, it's advisable to review the specific contents or supplementary materials provided to ascertain if additional resources or data are available.
14. How can I stay updated on further developments or reports in the Spasticity Treatment Market?
To stay informed about further developments, trends, and reports in the Spasticity Treatment Market, consider subscribing to industry newsletters, following relevant companies and organizations, or regularly checking reputable industry news sources and publications.
Methodology
Step 1 - Identification of Relevant Samples Size from Population Database


Step 2 - Approaches for Defining Global Market Size (Value, Volume* & Price*)

Note*: In applicable scenarios
Step 3 - Data Sources
Primary Research
- Web Analytics
- Survey Reports
- Research Institute
- Latest Research Reports
- Opinion Leaders
Secondary Research
- Annual Reports
- White Paper
- Latest Press Release
- Industry Association
- Paid Database
- Investor Presentations

Step 4 - Data Triangulation
Involves using different sources of information in order to increase the validity of a study
These sources are likely to be stakeholders in a program - participants, other researchers, program staff, other community members, and so on.
Then we put all data in single framework & apply various statistical tools to find out the dynamic on the market.
During the analysis stage, feedback from the stakeholder groups would be compared to determine areas of agreement as well as areas of divergence