

Key Insights
The global sedatives market is poised for significant expansion, projected to reach $12.65 billion by 2025, exhibiting a robust compound annual growth rate (CAGR) of 10.31% throughout the forecast period of 2025-2033. This substantial growth is primarily fueled by a confluence of escalating healthcare demands and advancements in medical procedures requiring sedation. The increasing prevalence of chronic diseases, the growing elderly population, and the rising number of surgical interventions, both elective and emergency, are key drivers propelling market expansion. Furthermore, the expanding healthcare infrastructure in emerging economies, coupled with greater access to advanced medical treatments, is creating new avenues for market penetration. The market is also benefiting from the development of novel sedative formulations with improved safety profiles and efficacy, catering to a wider range of patient needs and clinical applications.
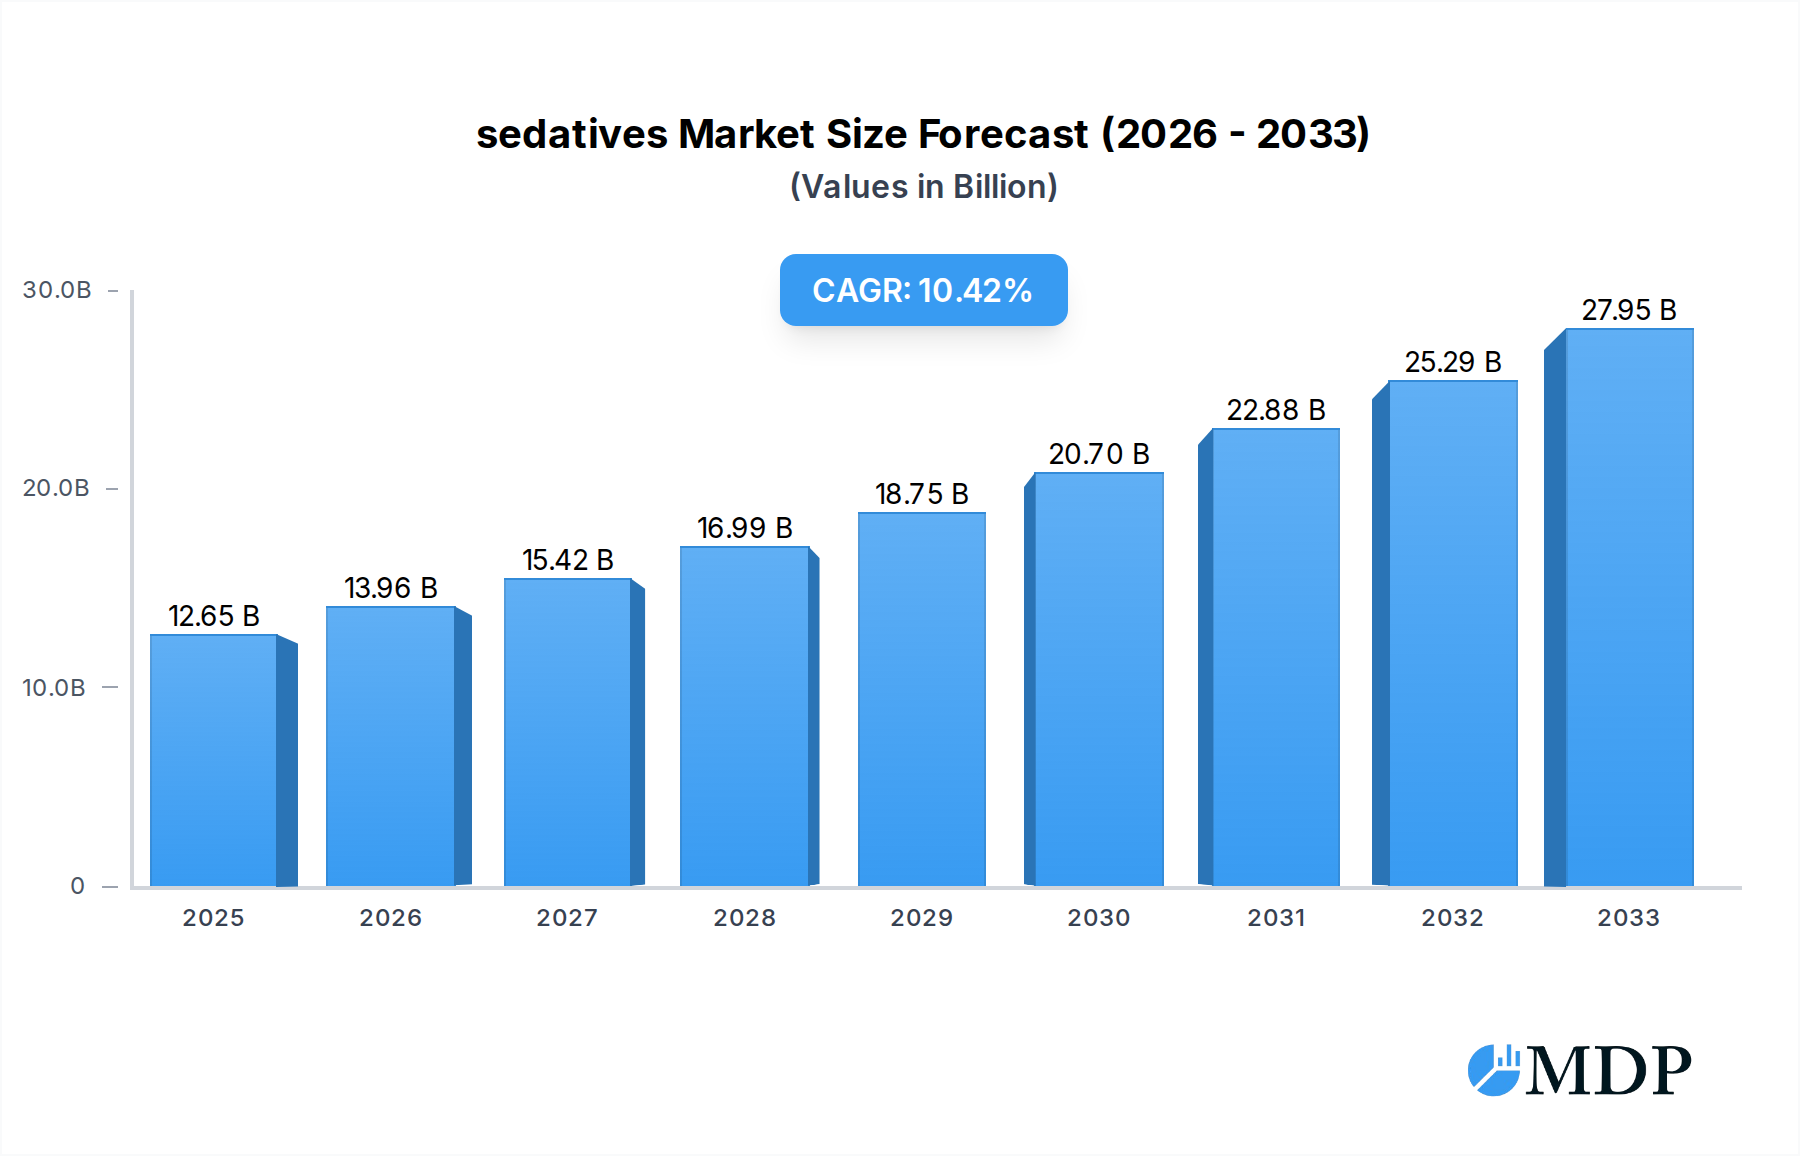
sedatives Market Size (In Billion)
The sedatives market encompasses a diverse range of applications, predominantly within hospitals and clinics, addressing needs from routine procedures to intensive care. Key product types include suppositories, capsules, solutions, and injectables, each serving distinct therapeutic purposes and administration routes. Industry trends point towards a greater emphasis on patient-centric care, driving the demand for sedatives that offer better control over sedation levels and faster recovery times. While the market demonstrates strong growth potential, certain restraints such as stringent regulatory approvals for new drug formulations and concerns regarding the potential for abuse or dependence can pose challenges. However, ongoing research and development efforts focused on non-addictive and more targeted sedative agents are expected to mitigate these concerns and further foster market growth in the coming years. The competitive landscape features major global players, indicating a dynamic and evolving market environment.

sedatives Company Market Share
Global Sedatives Market Analysis and Forecast: Trends, Drivers, and Opportunities (2019-2033)
Report Description:
Unlock comprehensive insights into the dynamic global sedatives market with this in-depth report, covering the study period of 2019–2033. Analyzing market concentration, innovation drivers, regulatory frameworks, product substitutes, end-user trends, and M&A activities, this report provides actionable intelligence for industry stakeholders. Featuring key metrics such as market share, M&A deal counts, CAGR, market penetration, and detailed segment analysis across applications (Hospital, Clinic) and types (Suppository, Capsule, Solution, Injectable), this report offers a strategic roadmap for navigating the evolving sedatives landscape. With a focus on growth drivers, technological disruptions, consumer preferences, and competitive dynamics, the report details leading markets and segments, product developments, key growth drivers, market challenges, emerging opportunities, leading players (Abbott, Cobalt Laboratories, Sands Pharm, Sanofi, Hospira, Takeda, Fresenius Kabi, Pfizer, Mylan, Novartis, Baxter), key milestones, and a strategic outlook for the sedatives market. The base year for analysis is 2025, with an estimated year of 2025 and a forecast period extending from 2025–2033, built upon historical data from 2019–2024. This report is designed for immediate use without further modification, offering a complete and actionable overview of the sedatives industry.
sedatives Market Dynamics & Concentration
The global sedatives market exhibits a moderate to high concentration, with a few dominant players controlling a significant portion of the market share, estimated at over 70% in the base year of 2025. Innovation is a key driver, fueled by ongoing research and development into novel formulations and delivery methods aimed at enhancing efficacy and minimizing side effects. Regulatory frameworks, particularly stringent approvals from bodies like the FDA and EMA, play a crucial role in shaping market entry and product differentiation. Product substitutes, such as alternative pain management therapies and non-pharmacological interventions, pose a competitive challenge, requiring sedatives manufacturers to continuously innovate and highlight their unique value propositions. End-user trends are shifting towards patient-centric approaches, demanding sedatives with improved safety profiles and faster recovery times. Mergers and acquisitions (M&A) activities, with an estimated xx billion worth of deals in the historical period (2019-2024) and xx billion in the forecast period (2025-2033), are expected to continue as companies seek to expand their product portfolios, gain market access, and achieve economies of scale. The number of M&A deals is projected to be xx in the historical period and xx in the forecast period, underscoring the strategic importance of consolidation.
- Market Share: Dominant players hold over 70% market share in 2025.
- Innovation Drivers: New formulations, improved delivery systems, reduced side effects.
- Regulatory Frameworks: FDA, EMA approvals; stringent market access.
- Product Substitutes: Alternative pain management, non-pharmacological methods.
- End-User Trends: Patient-centricity, enhanced safety, faster recovery.
- M&A Activities: xx billion in historical deals (2019-2024), xx billion projected in forecast (2025-2033).
- M&A Deal Counts: xx deals in historical period, xx deals in forecast period.
sedatives Industry Trends & Analysis
The global sedatives market is projected for robust growth, driven by an escalating prevalence of sleep disorders, anxiety, and pain management needs across diverse patient populations. The Compound Annual Growth Rate (CAGR) for the period 2025–2033 is estimated at an impressive xx%, signaling substantial market expansion. Market penetration is expected to rise as awareness regarding mental health and pain management increases, coupled with a growing demand for effective pharmacological interventions. Technological disruptions are a significant force, with advancements in drug delivery systems such as extended-release formulations and non-invasive methods promising improved patient compliance and therapeutic outcomes. Precision medicine approaches, tailoring sedative selection based on individual patient genetics and physiological responses, are also gaining traction, promising enhanced efficacy and reduced adverse events.
Consumer preferences are evolving, with patients increasingly seeking sedatives that offer rapid onset of action, minimal lingering grogginess, and a favorable safety profile. This shift is compelling manufacturers to invest in research and development focused on next-generation sedatives with improved pharmacokinetic and pharmacodynamic properties. Competitive dynamics within the industry are intensifying, characterized by strategic collaborations, product line expansions, and a strong emphasis on intellectual property protection. Key players are actively engaged in developing novel chemical entities and exploring combination therapies to address unmet clinical needs. The market is witnessing a growing demand for sedatives in emergency medicine and critical care settings, further augmenting growth prospects. Furthermore, the increasing affordability and accessibility of healthcare services in emerging economies are poised to unlock significant untapped potential for sedatives manufacturers, driving market penetration and volume sales. The ongoing digital transformation in healthcare, including telehealth and remote patient monitoring, also presents opportunities for improved patient management and adherence to sedative therapies.
Leading Markets & Segments in sedatives
The Hospital segment is expected to dominate the global sedatives market in terms of revenue and volume, driven by the critical role of sedatives in surgical procedures, intensive care units (ICUs), and emergency medical services. The need for controlled sedation in these settings, coupled with the availability of advanced medical infrastructure and skilled healthcare professionals, solidifies the hospital's leading position. Economic policies favoring increased healthcare spending and infrastructure development in major regions like North America and Europe are further bolstering the hospital segment's dominance. The Clinic segment, while smaller, is also experiencing significant growth, fueled by the increasing outpatient procedures and the rising demand for sedatives in managing chronic pain and anxiety disorders outside of a hospital setting.
- Dominant Application Segment: Hospital
- Key Drivers:
- High volume of surgical procedures requiring anesthesia and sedation.
- Essential use in Intensive Care Units (ICUs) for patient management.
- Application in emergency medicine for rapid intervention.
- Availability of advanced medical technology and skilled professionals.
- Favorable reimbursement policies for inpatient procedures.
- Key Drivers:
- Dominant Type Segment: Injectable
- Key Drivers:
- Rapid onset of action and precise dosage control crucial for immediate therapeutic effects.
- Preferred route for administration in hospital and critical care settings.
- Versatility in different formulations for various medical scenarios.
- Advancements in intravenous (IV) infusion technology.
- Key Drivers:
- Emerging Segments:
- The Solution and Capsule segments are projected for steady growth, catering to outpatient and home-based care needs for chronic conditions.
- Suppository forms, while niche, will continue to serve specific patient populations requiring alternative administration routes.
The North America region is anticipated to lead the market due to its advanced healthcare infrastructure, high disposable incomes, and strong emphasis on research and development. The United States, in particular, is a key market, characterized by a large patient pool with sleep disorders, anxiety, and chronic pain conditions. Favorable regulatory pathways and significant investment in pharmaceutical R&D further contribute to its dominance. Europe follows closely, with countries like Germany, the UK, and France exhibiting substantial demand driven by aging populations and increasing awareness of mental health issues. Asia Pacific presents a significant growth opportunity, driven by a burgeoning middle class, improving healthcare access, and a growing burden of lifestyle-related diseases.
sedatives Product Developments
Product development in the sedatives market is characterized by a strong focus on enhancing efficacy and safety profiles. Innovations include the development of novel non-benzodiazepine sedatives with reduced addiction potential and fewer withdrawal symptoms, as well as extended-release formulations that provide sustained sedation and minimize dose frequency. Targeted delivery systems, aiming to deliver sedatives directly to specific receptors or tissues, are also under investigation to optimize therapeutic outcomes and minimize systemic side effects. Competitive advantages are being built through superior pharmacokinetic properties, improved patient tolerability, and the development of reversal agents for quicker patient recovery. Technological advancements are enabling the creation of more precise and personalized sedative treatments, addressing the growing demand for patient-centric care.
Key Drivers of sedatives Growth
Several key factors are driving the growth of the sedatives market. The escalating global burden of sleep disorders, anxiety, and depression necessitates effective pharmacological interventions. Advancements in medical technology and surgical procedures continue to increase the demand for sedatives in both inpatient and outpatient settings. Furthermore, an aging population, more prone to various medical conditions requiring sedation, is a significant demographic driver. Growing awareness and de-stigmatization of mental health issues are also leading to increased prescriptions for anxiety-related sedatives. Economic development in emerging markets is improving access to healthcare and pharmaceuticals, further expanding the market reach.
- Increasing prevalence of sleep disorders and mental health conditions.
- Growth in surgical procedures and critical care demands.
- Aging global population requiring medical interventions.
- Rising healthcare expenditure and improved access in emerging economies.
- Technological advancements in drug formulation and delivery.
Challenges in the sedatives Market
Despite the positive growth trajectory, the sedatives market faces several challenges. Stringent regulatory hurdles and the potential for abuse and addiction associated with certain sedative classes can lead to restricted access and increased oversight. Supply chain disruptions, particularly concerning raw materials and manufacturing processes, can impact product availability and cost. Intense competition from both established players and emerging generics can lead to price erosion. Additionally, the increasing demand for non-pharmacological alternatives and the growing focus on patient safety and minimizing opioid use present a continuous need for sedatives to demonstrate superior efficacy and safety.
- Regulatory scrutiny and concerns over abuse potential.
- Supply chain vulnerabilities and raw material availability.
- Intensifying price competition and generic erosion.
- Growing preference for non-pharmacological treatment options.
- Risk of adverse drug reactions and side effects.
Emerging Opportunities in sedatives
The sedatives market is ripe with emerging opportunities. Technological breakthroughs in artificial intelligence (AI) and machine learning are enabling faster drug discovery and development of novel sedative compounds with improved safety profiles. Strategic partnerships and collaborations between pharmaceutical companies and research institutions can accelerate innovation and expand market reach. The growing demand for personalized medicine presents an opportunity to develop tailored sedative treatments based on genetic profiling and individual patient needs. Expansion into untapped emerging markets, coupled with the development of cost-effective formulations, can unlock significant growth potential. Furthermore, the increasing integration of digital health solutions can enhance patient monitoring and adherence to sedative therapies, leading to better therapeutic outcomes.
Leading Players in the sedatives Sector
- Abbott
- Cobalt Laboratories
- Sands Pharm
- Sanofi
- Hospira
- Takeda
- Fresenius Kabi
- Pfizer
- Mylan
- Novartis
- Baxter
Key Milestones in sedatives Industry
- 2019: Launch of a new non-benzodiazepine sedative with improved safety profile.
- 2020: Major pharmaceutical company acquires a biotech firm specializing in novel anesthetic agents.
- 2021: FDA approves a novel extended-release formulation for chronic pain management.
- 2022: Significant investment in R&D for sedatives with reduced addiction potential.
- 2023: Strategic alliance formed to develop combination therapies for complex anxiety disorders.
- 2024: Emergence of AI-driven platforms for identifying new sedative candidates.
- 2025: Projected increase in market penetration due to rising mental health awareness.
- 2026: Expected introduction of patient-specific sedative dosage recommendations.
- 2027-2033: Continued advancements in drug delivery systems and a growing focus on sustainable manufacturing practices.
Strategic Outlook for sedatives Market
The strategic outlook for the sedatives market is characterized by sustained growth, driven by innovation and expanding therapeutic applications. Companies are expected to focus on developing next-generation sedatives with enhanced safety, efficacy, and reduced potential for abuse. Investment in research and development of targeted therapies and personalized treatment approaches will be crucial. Expansion into emerging markets and strategic partnerships will be key growth accelerators. The increasing demand for sedatives in various medical settings, coupled with advancements in drug delivery and digital health integration, presents a promising future for the global sedatives industry. Emphasis on regulatory compliance and addressing societal concerns regarding addiction will remain paramount for long-term success.
sedatives Segmentation
-
1. Application
- 1.1. Hospital
- 1.2. Clinic
-
2. Types
- 2.1. Suppository
- 2.2. Capsule
- 2.3. Solution
- 2.4. Injectable
sedatives Segmentation By Geography
-
1. North America
- 1.1. United States
- 1.2. Canada
- 1.3. Mexico
-
2. South America
- 2.1. Brazil
- 2.2. Argentina
- 2.3. Rest of South America
-
3. Europe
- 3.1. United Kingdom
- 3.2. Germany
- 3.3. France
- 3.4. Italy
- 3.5. Spain
- 3.6. Russia
- 3.7. Benelux
- 3.8. Nordics
- 3.9. Rest of Europe
-
4. Middle East & Africa
- 4.1. Turkey
- 4.2. Israel
- 4.3. GCC
- 4.4. North Africa
- 4.5. South Africa
- 4.6. Rest of Middle East & Africa
-
5. Asia Pacific
- 5.1. China
- 5.2. India
- 5.3. Japan
- 5.4. South Korea
- 5.5. ASEAN
- 5.6. Oceania
- 5.7. Rest of Asia Pacific
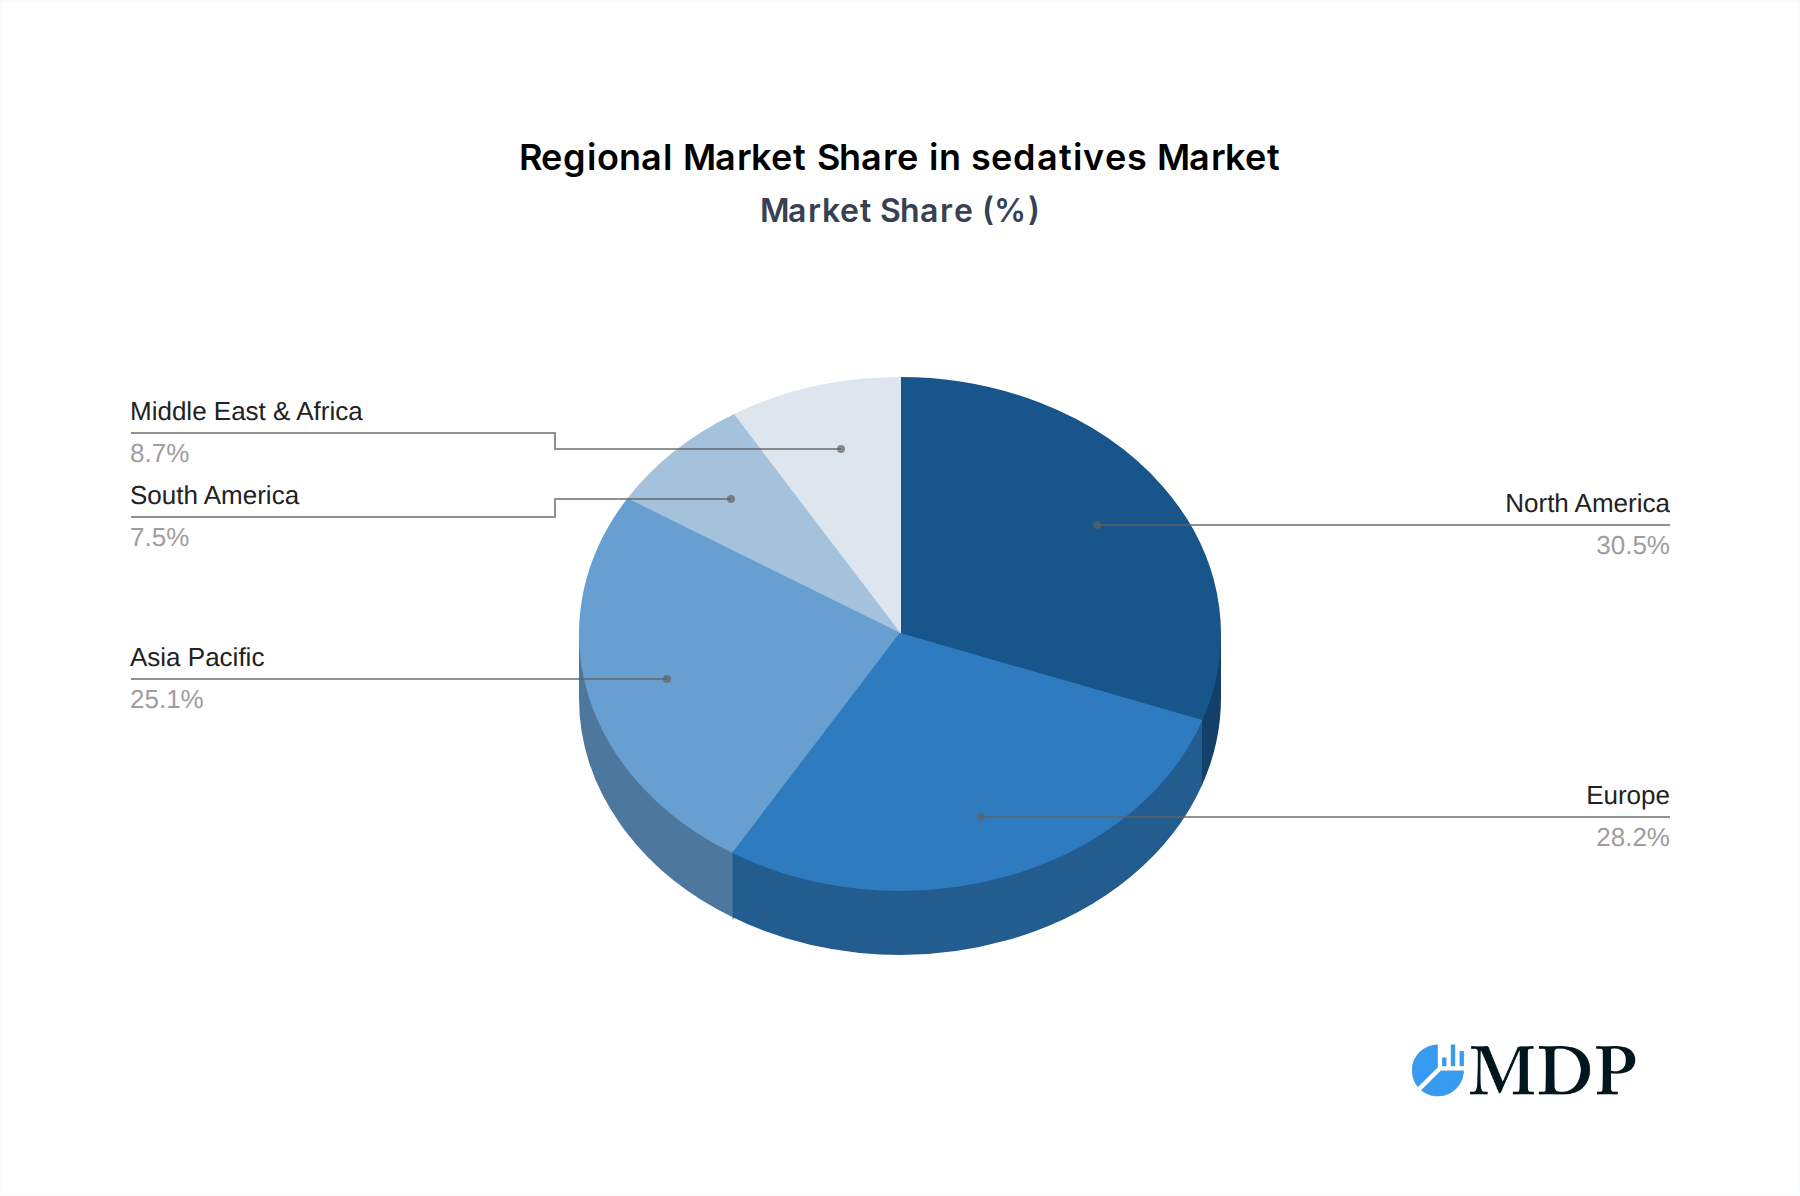
sedatives Regional Market Share
Geographic Coverage of sedatives
sedatives REPORT HIGHLIGHTS
| Aspects | Details |
|---|---|
| Study Period | 2020-2034 |
| Base Year | 2025 |
| Estimated Year | 2026 |
| Forecast Period | 2026-2034 |
| Historical Period | 2020-2025 |
| Growth Rate | CAGR of 10.31% from 2020-2034 |
| Segmentation |
|
Table of Contents
- 1. Introduction
- 1.1. Research Scope
- 1.2. Market Segmentation
- 1.3. Research Methodology
- 1.4. Definitions and Assumptions
- 2. Executive Summary
- 2.1. Introduction
- 3. Market Dynamics
- 3.1. Introduction
- 3.2. Market Drivers
- 3.3. Market Restrains
- 3.4. Market Trends
- 4. Market Factor Analysis
- 4.1. Porters Five Forces
- 4.2. Supply/Value Chain
- 4.3. PESTEL analysis
- 4.4. Market Entropy
- 4.5. Patent/Trademark Analysis
- 5. Global sedatives Analysis, Insights and Forecast, 2020-2032
- 5.1. Market Analysis, Insights and Forecast - by Application
- 5.1.1. Hospital
- 5.1.2. Clinic
- 5.2. Market Analysis, Insights and Forecast - by Types
- 5.2.1. Suppository
- 5.2.2. Capsule
- 5.2.3. Solution
- 5.2.4. Injectable
- 5.3. Market Analysis, Insights and Forecast - by Region
- 5.3.1. North America
- 5.3.2. South America
- 5.3.3. Europe
- 5.3.4. Middle East & Africa
- 5.3.5. Asia Pacific
- 5.1. Market Analysis, Insights and Forecast - by Application
- 6. North America sedatives Analysis, Insights and Forecast, 2020-2032
- 6.1. Market Analysis, Insights and Forecast - by Application
- 6.1.1. Hospital
- 6.1.2. Clinic
- 6.2. Market Analysis, Insights and Forecast - by Types
- 6.2.1. Suppository
- 6.2.2. Capsule
- 6.2.3. Solution
- 6.2.4. Injectable
- 6.1. Market Analysis, Insights and Forecast - by Application
- 7. South America sedatives Analysis, Insights and Forecast, 2020-2032
- 7.1. Market Analysis, Insights and Forecast - by Application
- 7.1.1. Hospital
- 7.1.2. Clinic
- 7.2. Market Analysis, Insights and Forecast - by Types
- 7.2.1. Suppository
- 7.2.2. Capsule
- 7.2.3. Solution
- 7.2.4. Injectable
- 7.1. Market Analysis, Insights and Forecast - by Application
- 8. Europe sedatives Analysis, Insights and Forecast, 2020-2032
- 8.1. Market Analysis, Insights and Forecast - by Application
- 8.1.1. Hospital
- 8.1.2. Clinic
- 8.2. Market Analysis, Insights and Forecast - by Types
- 8.2.1. Suppository
- 8.2.2. Capsule
- 8.2.3. Solution
- 8.2.4. Injectable
- 8.1. Market Analysis, Insights and Forecast - by Application
- 9. Middle East & Africa sedatives Analysis, Insights and Forecast, 2020-2032
- 9.1. Market Analysis, Insights and Forecast - by Application
- 9.1.1. Hospital
- 9.1.2. Clinic
- 9.2. Market Analysis, Insights and Forecast - by Types
- 9.2.1. Suppository
- 9.2.2. Capsule
- 9.2.3. Solution
- 9.2.4. Injectable
- 9.1. Market Analysis, Insights and Forecast - by Application
- 10. Asia Pacific sedatives Analysis, Insights and Forecast, 2020-2032
- 10.1. Market Analysis, Insights and Forecast - by Application
- 10.1.1. Hospital
- 10.1.2. Clinic
- 10.2. Market Analysis, Insights and Forecast - by Types
- 10.2.1. Suppository
- 10.2.2. Capsule
- 10.2.3. Solution
- 10.2.4. Injectable
- 10.1. Market Analysis, Insights and Forecast - by Application
- 11. Competitive Analysis
- 11.1. Global Market Share Analysis 2025
- 11.2. Company Profiles
- 11.2.1 Abbott
- 11.2.1.1. Overview
- 11.2.1.2. Products
- 11.2.1.3. SWOT Analysis
- 11.2.1.4. Recent Developments
- 11.2.1.5. Financials (Based on Availability)
- 11.2.2 Cobalt Laboratories
- 11.2.2.1. Overview
- 11.2.2.2. Products
- 11.2.2.3. SWOT Analysis
- 11.2.2.4. Recent Developments
- 11.2.2.5. Financials (Based on Availability)
- 11.2.3 Sands Pharm
- 11.2.3.1. Overview
- 11.2.3.2. Products
- 11.2.3.3. SWOT Analysis
- 11.2.3.4. Recent Developments
- 11.2.3.5. Financials (Based on Availability)
- 11.2.4 Sanofi
- 11.2.4.1. Overview
- 11.2.4.2. Products
- 11.2.4.3. SWOT Analysis
- 11.2.4.4. Recent Developments
- 11.2.4.5. Financials (Based on Availability)
- 11.2.5 Hospira
- 11.2.5.1. Overview
- 11.2.5.2. Products
- 11.2.5.3. SWOT Analysis
- 11.2.5.4. Recent Developments
- 11.2.5.5. Financials (Based on Availability)
- 11.2.6 Takeda
- 11.2.6.1. Overview
- 11.2.6.2. Products
- 11.2.6.3. SWOT Analysis
- 11.2.6.4. Recent Developments
- 11.2.6.5. Financials (Based on Availability)
- 11.2.7 Fresenius Kabi
- 11.2.7.1. Overview
- 11.2.7.2. Products
- 11.2.7.3. SWOT Analysis
- 11.2.7.4. Recent Developments
- 11.2.7.5. Financials (Based on Availability)
- 11.2.8 Pfizer
- 11.2.8.1. Overview
- 11.2.8.2. Products
- 11.2.8.3. SWOT Analysis
- 11.2.8.4. Recent Developments
- 11.2.8.5. Financials (Based on Availability)
- 11.2.9 Mylan
- 11.2.9.1. Overview
- 11.2.9.2. Products
- 11.2.9.3. SWOT Analysis
- 11.2.9.4. Recent Developments
- 11.2.9.5. Financials (Based on Availability)
- 11.2.10 Novartis
- 11.2.10.1. Overview
- 11.2.10.2. Products
- 11.2.10.3. SWOT Analysis
- 11.2.10.4. Recent Developments
- 11.2.10.5. Financials (Based on Availability)
- 11.2.11 Baxter
- 11.2.11.1. Overview
- 11.2.11.2. Products
- 11.2.11.3. SWOT Analysis
- 11.2.11.4. Recent Developments
- 11.2.11.5. Financials (Based on Availability)
- 11.2.1 Abbott
List of Figures
- Figure 1: Global sedatives Revenue Breakdown (billion, %) by Region 2025 & 2033
- Figure 2: Global sedatives Volume Breakdown (K, %) by Region 2025 & 2033
- Figure 3: North America sedatives Revenue (billion), by Application 2025 & 2033
- Figure 4: North America sedatives Volume (K), by Application 2025 & 2033
- Figure 5: North America sedatives Revenue Share (%), by Application 2025 & 2033
- Figure 6: North America sedatives Volume Share (%), by Application 2025 & 2033
- Figure 7: North America sedatives Revenue (billion), by Types 2025 & 2033
- Figure 8: North America sedatives Volume (K), by Types 2025 & 2033
- Figure 9: North America sedatives Revenue Share (%), by Types 2025 & 2033
- Figure 10: North America sedatives Volume Share (%), by Types 2025 & 2033
- Figure 11: North America sedatives Revenue (billion), by Country 2025 & 2033
- Figure 12: North America sedatives Volume (K), by Country 2025 & 2033
- Figure 13: North America sedatives Revenue Share (%), by Country 2025 & 2033
- Figure 14: North America sedatives Volume Share (%), by Country 2025 & 2033
- Figure 15: South America sedatives Revenue (billion), by Application 2025 & 2033
- Figure 16: South America sedatives Volume (K), by Application 2025 & 2033
- Figure 17: South America sedatives Revenue Share (%), by Application 2025 & 2033
- Figure 18: South America sedatives Volume Share (%), by Application 2025 & 2033
- Figure 19: South America sedatives Revenue (billion), by Types 2025 & 2033
- Figure 20: South America sedatives Volume (K), by Types 2025 & 2033
- Figure 21: South America sedatives Revenue Share (%), by Types 2025 & 2033
- Figure 22: South America sedatives Volume Share (%), by Types 2025 & 2033
- Figure 23: South America sedatives Revenue (billion), by Country 2025 & 2033
- Figure 24: South America sedatives Volume (K), by Country 2025 & 2033
- Figure 25: South America sedatives Revenue Share (%), by Country 2025 & 2033
- Figure 26: South America sedatives Volume Share (%), by Country 2025 & 2033
- Figure 27: Europe sedatives Revenue (billion), by Application 2025 & 2033
- Figure 28: Europe sedatives Volume (K), by Application 2025 & 2033
- Figure 29: Europe sedatives Revenue Share (%), by Application 2025 & 2033
- Figure 30: Europe sedatives Volume Share (%), by Application 2025 & 2033
- Figure 31: Europe sedatives Revenue (billion), by Types 2025 & 2033
- Figure 32: Europe sedatives Volume (K), by Types 2025 & 2033
- Figure 33: Europe sedatives Revenue Share (%), by Types 2025 & 2033
- Figure 34: Europe sedatives Volume Share (%), by Types 2025 & 2033
- Figure 35: Europe sedatives Revenue (billion), by Country 2025 & 2033
- Figure 36: Europe sedatives Volume (K), by Country 2025 & 2033
- Figure 37: Europe sedatives Revenue Share (%), by Country 2025 & 2033
- Figure 38: Europe sedatives Volume Share (%), by Country 2025 & 2033
- Figure 39: Middle East & Africa sedatives Revenue (billion), by Application 2025 & 2033
- Figure 40: Middle East & Africa sedatives Volume (K), by Application 2025 & 2033
- Figure 41: Middle East & Africa sedatives Revenue Share (%), by Application 2025 & 2033
- Figure 42: Middle East & Africa sedatives Volume Share (%), by Application 2025 & 2033
- Figure 43: Middle East & Africa sedatives Revenue (billion), by Types 2025 & 2033
- Figure 44: Middle East & Africa sedatives Volume (K), by Types 2025 & 2033
- Figure 45: Middle East & Africa sedatives Revenue Share (%), by Types 2025 & 2033
- Figure 46: Middle East & Africa sedatives Volume Share (%), by Types 2025 & 2033
- Figure 47: Middle East & Africa sedatives Revenue (billion), by Country 2025 & 2033
- Figure 48: Middle East & Africa sedatives Volume (K), by Country 2025 & 2033
- Figure 49: Middle East & Africa sedatives Revenue Share (%), by Country 2025 & 2033
- Figure 50: Middle East & Africa sedatives Volume Share (%), by Country 2025 & 2033
- Figure 51: Asia Pacific sedatives Revenue (billion), by Application 2025 & 2033
- Figure 52: Asia Pacific sedatives Volume (K), by Application 2025 & 2033
- Figure 53: Asia Pacific sedatives Revenue Share (%), by Application 2025 & 2033
- Figure 54: Asia Pacific sedatives Volume Share (%), by Application 2025 & 2033
- Figure 55: Asia Pacific sedatives Revenue (billion), by Types 2025 & 2033
- Figure 56: Asia Pacific sedatives Volume (K), by Types 2025 & 2033
- Figure 57: Asia Pacific sedatives Revenue Share (%), by Types 2025 & 2033
- Figure 58: Asia Pacific sedatives Volume Share (%), by Types 2025 & 2033
- Figure 59: Asia Pacific sedatives Revenue (billion), by Country 2025 & 2033
- Figure 60: Asia Pacific sedatives Volume (K), by Country 2025 & 2033
- Figure 61: Asia Pacific sedatives Revenue Share (%), by Country 2025 & 2033
- Figure 62: Asia Pacific sedatives Volume Share (%), by Country 2025 & 2033
List of Tables
- Table 1: Global sedatives Revenue billion Forecast, by Application 2020 & 2033
- Table 2: Global sedatives Volume K Forecast, by Application 2020 & 2033
- Table 3: Global sedatives Revenue billion Forecast, by Types 2020 & 2033
- Table 4: Global sedatives Volume K Forecast, by Types 2020 & 2033
- Table 5: Global sedatives Revenue billion Forecast, by Region 2020 & 2033
- Table 6: Global sedatives Volume K Forecast, by Region 2020 & 2033
- Table 7: Global sedatives Revenue billion Forecast, by Application 2020 & 2033
- Table 8: Global sedatives Volume K Forecast, by Application 2020 & 2033
- Table 9: Global sedatives Revenue billion Forecast, by Types 2020 & 2033
- Table 10: Global sedatives Volume K Forecast, by Types 2020 & 2033
- Table 11: Global sedatives Revenue billion Forecast, by Country 2020 & 2033
- Table 12: Global sedatives Volume K Forecast, by Country 2020 & 2033
- Table 13: United States sedatives Revenue (billion) Forecast, by Application 2020 & 2033
- Table 14: United States sedatives Volume (K) Forecast, by Application 2020 & 2033
- Table 15: Canada sedatives Revenue (billion) Forecast, by Application 2020 & 2033
- Table 16: Canada sedatives Volume (K) Forecast, by Application 2020 & 2033
- Table 17: Mexico sedatives Revenue (billion) Forecast, by Application 2020 & 2033
- Table 18: Mexico sedatives Volume (K) Forecast, by Application 2020 & 2033
- Table 19: Global sedatives Revenue billion Forecast, by Application 2020 & 2033
- Table 20: Global sedatives Volume K Forecast, by Application 2020 & 2033
- Table 21: Global sedatives Revenue billion Forecast, by Types 2020 & 2033
- Table 22: Global sedatives Volume K Forecast, by Types 2020 & 2033
- Table 23: Global sedatives Revenue billion Forecast, by Country 2020 & 2033
- Table 24: Global sedatives Volume K Forecast, by Country 2020 & 2033
- Table 25: Brazil sedatives Revenue (billion) Forecast, by Application 2020 & 2033
- Table 26: Brazil sedatives Volume (K) Forecast, by Application 2020 & 2033
- Table 27: Argentina sedatives Revenue (billion) Forecast, by Application 2020 & 2033
- Table 28: Argentina sedatives Volume (K) Forecast, by Application 2020 & 2033
- Table 29: Rest of South America sedatives Revenue (billion) Forecast, by Application 2020 & 2033
- Table 30: Rest of South America sedatives Volume (K) Forecast, by Application 2020 & 2033
- Table 31: Global sedatives Revenue billion Forecast, by Application 2020 & 2033
- Table 32: Global sedatives Volume K Forecast, by Application 2020 & 2033
- Table 33: Global sedatives Revenue billion Forecast, by Types 2020 & 2033
- Table 34: Global sedatives Volume K Forecast, by Types 2020 & 2033
- Table 35: Global sedatives Revenue billion Forecast, by Country 2020 & 2033
- Table 36: Global sedatives Volume K Forecast, by Country 2020 & 2033
- Table 37: United Kingdom sedatives Revenue (billion) Forecast, by Application 2020 & 2033
- Table 38: United Kingdom sedatives Volume (K) Forecast, by Application 2020 & 2033
- Table 39: Germany sedatives Revenue (billion) Forecast, by Application 2020 & 2033
- Table 40: Germany sedatives Volume (K) Forecast, by Application 2020 & 2033
- Table 41: France sedatives Revenue (billion) Forecast, by Application 2020 & 2033
- Table 42: France sedatives Volume (K) Forecast, by Application 2020 & 2033
- Table 43: Italy sedatives Revenue (billion) Forecast, by Application 2020 & 2033
- Table 44: Italy sedatives Volume (K) Forecast, by Application 2020 & 2033
- Table 45: Spain sedatives Revenue (billion) Forecast, by Application 2020 & 2033
- Table 46: Spain sedatives Volume (K) Forecast, by Application 2020 & 2033
- Table 47: Russia sedatives Revenue (billion) Forecast, by Application 2020 & 2033
- Table 48: Russia sedatives Volume (K) Forecast, by Application 2020 & 2033
- Table 49: Benelux sedatives Revenue (billion) Forecast, by Application 2020 & 2033
- Table 50: Benelux sedatives Volume (K) Forecast, by Application 2020 & 2033
- Table 51: Nordics sedatives Revenue (billion) Forecast, by Application 2020 & 2033
- Table 52: Nordics sedatives Volume (K) Forecast, by Application 2020 & 2033
- Table 53: Rest of Europe sedatives Revenue (billion) Forecast, by Application 2020 & 2033
- Table 54: Rest of Europe sedatives Volume (K) Forecast, by Application 2020 & 2033
- Table 55: Global sedatives Revenue billion Forecast, by Application 2020 & 2033
- Table 56: Global sedatives Volume K Forecast, by Application 2020 & 2033
- Table 57: Global sedatives Revenue billion Forecast, by Types 2020 & 2033
- Table 58: Global sedatives Volume K Forecast, by Types 2020 & 2033
- Table 59: Global sedatives Revenue billion Forecast, by Country 2020 & 2033
- Table 60: Global sedatives Volume K Forecast, by Country 2020 & 2033
- Table 61: Turkey sedatives Revenue (billion) Forecast, by Application 2020 & 2033
- Table 62: Turkey sedatives Volume (K) Forecast, by Application 2020 & 2033
- Table 63: Israel sedatives Revenue (billion) Forecast, by Application 2020 & 2033
- Table 64: Israel sedatives Volume (K) Forecast, by Application 2020 & 2033
- Table 65: GCC sedatives Revenue (billion) Forecast, by Application 2020 & 2033
- Table 66: GCC sedatives Volume (K) Forecast, by Application 2020 & 2033
- Table 67: North Africa sedatives Revenue (billion) Forecast, by Application 2020 & 2033
- Table 68: North Africa sedatives Volume (K) Forecast, by Application 2020 & 2033
- Table 69: South Africa sedatives Revenue (billion) Forecast, by Application 2020 & 2033
- Table 70: South Africa sedatives Volume (K) Forecast, by Application 2020 & 2033
- Table 71: Rest of Middle East & Africa sedatives Revenue (billion) Forecast, by Application 2020 & 2033
- Table 72: Rest of Middle East & Africa sedatives Volume (K) Forecast, by Application 2020 & 2033
- Table 73: Global sedatives Revenue billion Forecast, by Application 2020 & 2033
- Table 74: Global sedatives Volume K Forecast, by Application 2020 & 2033
- Table 75: Global sedatives Revenue billion Forecast, by Types 2020 & 2033
- Table 76: Global sedatives Volume K Forecast, by Types 2020 & 2033
- Table 77: Global sedatives Revenue billion Forecast, by Country 2020 & 2033
- Table 78: Global sedatives Volume K Forecast, by Country 2020 & 2033
- Table 79: China sedatives Revenue (billion) Forecast, by Application 2020 & 2033
- Table 80: China sedatives Volume (K) Forecast, by Application 2020 & 2033
- Table 81: India sedatives Revenue (billion) Forecast, by Application 2020 & 2033
- Table 82: India sedatives Volume (K) Forecast, by Application 2020 & 2033
- Table 83: Japan sedatives Revenue (billion) Forecast, by Application 2020 & 2033
- Table 84: Japan sedatives Volume (K) Forecast, by Application 2020 & 2033
- Table 85: South Korea sedatives Revenue (billion) Forecast, by Application 2020 & 2033
- Table 86: South Korea sedatives Volume (K) Forecast, by Application 2020 & 2033
- Table 87: ASEAN sedatives Revenue (billion) Forecast, by Application 2020 & 2033
- Table 88: ASEAN sedatives Volume (K) Forecast, by Application 2020 & 2033
- Table 89: Oceania sedatives Revenue (billion) Forecast, by Application 2020 & 2033
- Table 90: Oceania sedatives Volume (K) Forecast, by Application 2020 & 2033
- Table 91: Rest of Asia Pacific sedatives Revenue (billion) Forecast, by Application 2020 & 2033
- Table 92: Rest of Asia Pacific sedatives Volume (K) Forecast, by Application 2020 & 2033
Frequently Asked Questions
1. What is the projected Compound Annual Growth Rate (CAGR) of the sedatives?
The projected CAGR is approximately 10.31%.
2. Which companies are prominent players in the sedatives?
Key companies in the market include Abbott, Cobalt Laboratories, Sands Pharm, Sanofi, Hospira, Takeda, Fresenius Kabi, Pfizer, Mylan, Novartis, Baxter.
3. What are the main segments of the sedatives?
The market segments include Application, Types.
4. Can you provide details about the market size?
The market size is estimated to be USD 12.65 billion as of 2022.
5. What are some drivers contributing to market growth?
N/A
6. What are the notable trends driving market growth?
N/A
7. Are there any restraints impacting market growth?
N/A
8. Can you provide examples of recent developments in the market?
N/A
9. What pricing options are available for accessing the report?
Pricing options include single-user, multi-user, and enterprise licenses priced at USD 4350.00, USD 6525.00, and USD 8700.00 respectively.
10. Is the market size provided in terms of value or volume?
The market size is provided in terms of value, measured in billion and volume, measured in K.
11. Are there any specific market keywords associated with the report?
Yes, the market keyword associated with the report is "sedatives," which aids in identifying and referencing the specific market segment covered.
12. How do I determine which pricing option suits my needs best?
The pricing options vary based on user requirements and access needs. Individual users may opt for single-user licenses, while businesses requiring broader access may choose multi-user or enterprise licenses for cost-effective access to the report.
13. Are there any additional resources or data provided in the sedatives report?
While the report offers comprehensive insights, it's advisable to review the specific contents or supplementary materials provided to ascertain if additional resources or data are available.
14. How can I stay updated on further developments or reports in the sedatives?
To stay informed about further developments, trends, and reports in the sedatives, consider subscribing to industry newsletters, following relevant companies and organizations, or regularly checking reputable industry news sources and publications.
Methodology
Step 1 - Identification of Relevant Samples Size from Population Database


Step 2 - Approaches for Defining Global Market Size (Value, Volume* & Price*)

Note*: In applicable scenarios
Step 3 - Data Sources
Primary Research
- Web Analytics
- Survey Reports
- Research Institute
- Latest Research Reports
- Opinion Leaders
Secondary Research
- Annual Reports
- White Paper
- Latest Press Release
- Industry Association
- Paid Database
- Investor Presentations

Step 4 - Data Triangulation
Involves using different sources of information in order to increase the validity of a study
These sources are likely to be stakeholders in a program - participants, other researchers, program staff, other community members, and so on.
Then we put all data in single framework & apply various statistical tools to find out the dynamic on the market.
During the analysis stage, feedback from the stakeholder groups would be compared to determine areas of agreement as well as areas of divergence