

Key Insights
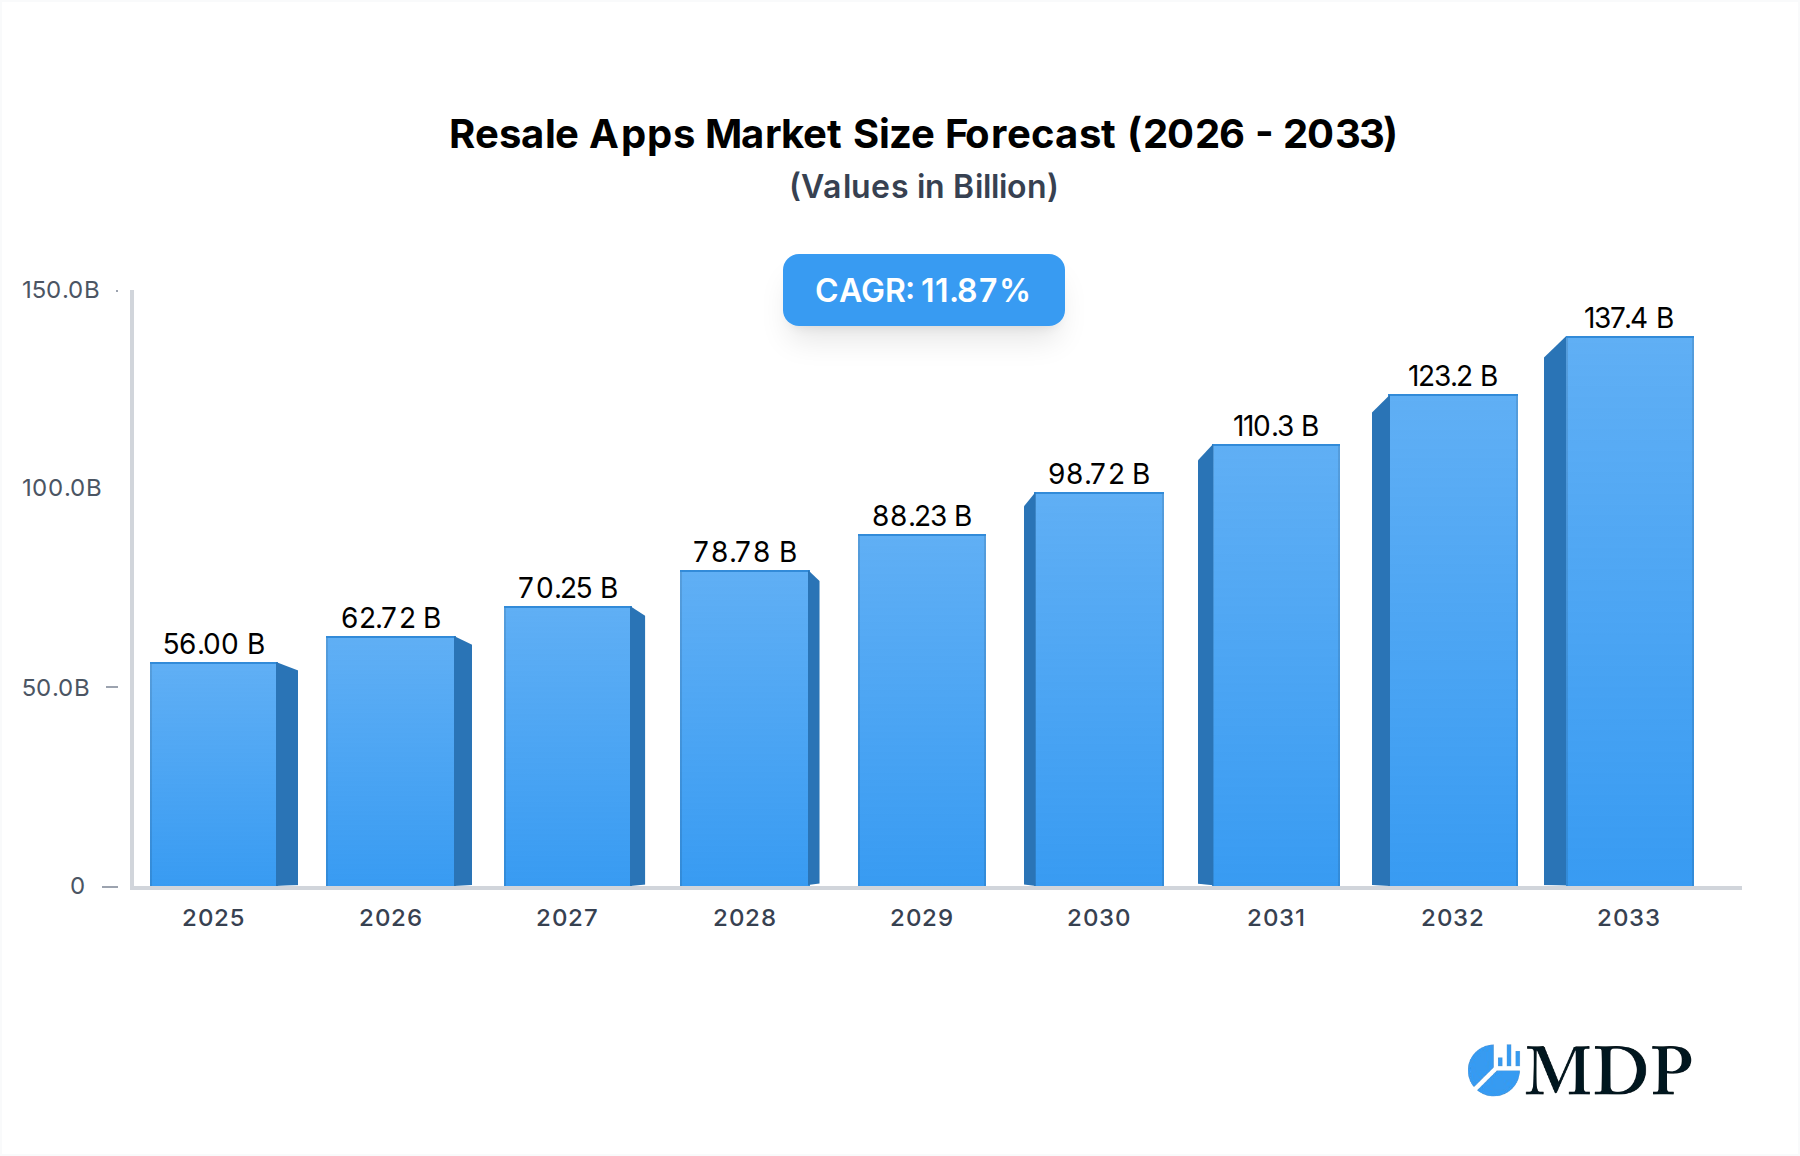
The global Resale Apps market is poised for robust expansion, projected to reach an estimated $56 billion in 2025. This significant valuation underscores the increasing consumer adoption of pre-owned goods, driven by a growing awareness of sustainability, cost-consciousness, and the desire for unique or vintage items. The market is expected to witness a Compound Annual Growth Rate (CAGR) of 12% from 2025 to 2033, indicating a sustained upward trajectory. Key drivers fueling this growth include the burgeoning circular economy movement, enhanced user experience offered by sophisticated app interfaces, and the increasing prevalence of smartphones, making transactions more accessible than ever. Furthermore, the convenience of peer-to-peer transactions, coupled with the ability to discover niche or out-of-stock items, continues to attract a broad user base, spanning both C2C and B2C segments. Major players like eBay, Facebook Marketplace, Poshmark, and Etsy are continuously innovating, offering advanced features like authentication services and personalized recommendations, which further stimulate market penetration and user engagement.

Resale Apps Market Size (In Billion)
The resale app landscape is characterized by dynamic trends, with a significant shift towards mobile-first platforms and specialized marketplaces catering to specific categories such as fashion (thredUP, Depop), electronics (Decluttr), and collectibles (Reverb). The increasing influence of social commerce, where platforms like Instagram and Facebook Marketplace integrate shopping functionalities, also plays a pivotal role in driving discovery and sales. While the market benefits from a vast array of established and emerging platforms, certain restraints, such as potential trust issues or the need for robust seller vetting processes, could temper hyper-growth in specific niches. However, these are actively being addressed through improved rating systems and dispute resolution mechanisms. Geographically, North America and Europe currently lead in market penetration due to high smartphone adoption and established e-commerce infrastructures. Nonetheless, the Asia Pacific region, with its rapidly growing digital economy and burgeoning middle class, presents substantial untapped potential for future growth. The ongoing evolution of digital payment systems and logistics further solidifies the positive outlook for the resale app market.
Resale Apps Company Market Share
Unlocking the Billion-Dollar Resale Apps Market: A Comprehensive Industry Analysis (2019-2033)
Dive deep into the booming resale apps market with this indispensable report. Covering the historical period from 2019-2024 and projecting growth through 2033, this analysis provides unparalleled insights for industry stakeholders. With a base year of 2025, we forecast a market projected to exceed one trillion dollars in valuation. This report leverages high-traffic keywords like "secondhand marketplace," "online resale," "circular economy apps," "pre-owned goods," "sustainable fashion," and "P2P selling" to ensure maximum search visibility. Understand the competitive landscape, technological innovations, and consumer trends shaping the future of pre-owned commerce.
Resale Apps Market Dynamics & Concentration
The resale apps market is experiencing dynamic shifts, characterized by moderate to high concentration, with a few dominant players commanding significant market share. Key innovation drivers include advancements in AI-powered authentication, personalized recommendation engines, and seamless payment integration. Regulatory frameworks are evolving, with a growing focus on consumer protection, data privacy, and the environmental impact of the circular economy. Product substitutes, while present in traditional brick-and-mortar thrift stores and peer-to-peer platforms, are increasingly challenged by the convenience and reach of dedicated resale applications. End-user trends lean towards sustainability, affordability, and unique item discovery, propelling the growth of platforms like eBay, Facebook Marketplace, Poshmark, Depop, thredUP, Etsy, Reverb, OfferUp, Vinted, Craigslist, Hewi, Gumtree, Instagram, ThredUp, Decluttr, Worthy, LetGo, Nextdoor, Tradesy, and Mercari. Mergers and acquisition (M&A) activities have been strategic, focusing on consolidating market share and acquiring innovative technologies. We estimate approximately 30 billion dollars in M&A deals over the historical period, with significant future consolidation anticipated. Market share is dynamically distributed, with top players holding an estimated 70% of the combined market.
Resale Apps Industry Trends & Analysis
The resale apps industry is witnessing robust growth, driven by a confluence of technological advancements, evolving consumer preferences, and a growing societal emphasis on sustainability. The market is projected to grow at a Compound Annual Growth Rate (CAGR) of 15% from 2025 to 2033, a testament to its resilience and adaptability. Market penetration is rapidly increasing, particularly among younger demographics who embrace the concept of a circular economy and are actively seeking budget-friendly and environmentally conscious shopping alternatives. Technological disruptions are a constant, with platforms continuously innovating to enhance user experience. Features like AI-driven pricing suggestions, sophisticated search filters, augmented reality try-ons, and secure payment gateways are becoming standard. Consumer preferences are increasingly shifting towards unique, vintage, and sustainable fashion and goods, with platforms like Depop and Poshmark leading the charge. The competitive dynamics are intense, characterized by platform differentiation, strategic partnerships, and aggressive user acquisition strategies. Companies like eBay, Facebook Marketplace, Poshmark, Depop, thredUP, Etsy, Reverb, OfferUp, Vinted, Craigslist, Hewi, Gumtree, Instagram, ThredUp, Decluttr, Worthy, LetGo, Nextdoor, Tradesy, and Mercari are constantly vying for market dominance. The increasing acceptance of secondhand goods as a viable alternative to new purchases, coupled with the growing awareness of the environmental footprint of fast fashion and disposable consumerism, are significant market growth drivers. The global online resale market is projected to reach an estimated 1.2 trillion dollars by 2033.
Leading Markets & Segments in Resale Apps
The C2C (Consumer-to-Consumer) segment continues to be the dominant force in the resale apps market, driven by its inherent peer-to-peer nature and the vast array of individual sellers offering unique items. This segment benefits from economic policies that encourage entrepreneurship and the utilization of personal assets. The Android platform holds a significant market share due to its widespread global adoption, making it accessible to a broader consumer base.
Dominant Region: North America
- Key Drivers: High disposable incomes, strong e-commerce infrastructure, early adoption of digital technologies, and a robust cultural appreciation for thrift and vintage items.
- Detailed Dominance Analysis: North America, particularly the United States, leads in terms of transaction volume and user engagement. Economic policies promoting small businesses and the gig economy have fostered a thriving C2C ecosystem. The widespread availability of high-speed internet and advanced mobile device penetration further bolsters the market.
Dominant Segment: C2C
- Key Drivers: Affordability, uniqueness of offerings, environmental consciousness, and the desire for pre-owned items.
- Detailed Dominance Analysis: C2C platforms like eBay, Poshmark, and Depop empower individuals to monetize their belongings, creating a vast inventory of diverse products. This model directly addresses the growing consumer demand for sustainable consumption and budget-friendly alternatives to new goods.
Dominant Platform Type: Android
- Key Drivers: Global market share, affordability of devices, and a wide range of supported applications.
- Detailed Dominance Analysis: The sheer volume of Android users worldwide translates into a larger potential customer base for resale apps. This accessibility ensures broad market reach for both buyers and sellers.
The B2C (Business-to-Consumer) segment is also experiencing substantial growth, with brands and retailers increasingly participating in the resale market to manage inventory, engage with eco-conscious consumers, and extend product lifecycles. The iOS platform, while smaller in global user numbers than Android, often demonstrates higher user spending power, contributing significantly to transaction values.
Resale Apps Product Developments
Product innovations in the resale apps market are relentlessly focused on enhancing user experience, security, and sustainability. AI-powered authentication for luxury goods, advanced visual search capabilities, personalized recommendation engines based on past behavior, and integrated shipping solutions are becoming standard features. Platforms are also investing in features that promote sustainability, such as carbon footprint calculators for transactions and options for eco-friendly packaging. Competitive advantages are being built through unique community features, curated collections, and seamless integration with social media for sharing and discovery. These developments cater to evolving consumer needs for convenience, trust, and conscious consumption.
Key Drivers of Resale Apps Growth
Several interconnected factors are fueling the exponential growth of the resale apps market. Technologically, the proliferation of smartphones, high-speed internet, and sophisticated mobile applications has made P2P selling and online thrifting more accessible than ever. Economically, rising inflation and a desire for value-conscious shopping are driving consumers towards affordable pre-owned options. Regulatory shifts, with increasing global focus on the circular economy and sustainability initiatives, are also creating a favorable environment. Furthermore, growing consumer awareness of the environmental impact of fast fashion and overconsumption is a powerful societal driver.
Challenges in the Resale Apps Market
Despite its rapid growth, the resale apps market faces notable challenges. Regulatory hurdles surrounding product authenticity and buyer protection can be complex and vary across regions. Supply chain issues, particularly in managing returns and ensuring efficient logistics for a decentralized seller base, can impact operational efficiency. Intense competitive pressures from both established giants and emerging niche platforms necessitate continuous innovation and aggressive marketing strategies. The potential for fraudulent activities and the need for robust trust-building mechanisms remain ongoing concerns, with an estimated 5 billion dollars lost annually due to counterfeit goods and scams.
Emerging Opportunities in Resale Apps
The future of the resale apps market is rife with emerging opportunities. Technological breakthroughs in AI for image recognition and fraud detection will further enhance trust and efficiency. Strategic partnerships with established brands looking to implement their own resale channels, or with logistics providers to optimize shipping, will create new revenue streams and expand market reach. Market expansion into developing economies, where the demand for affordable goods is high and the adoption of mobile technology is accelerating, presents a significant growth catalyst. The integration of resale into broader e-commerce ecosystems and the development of specialized resale niches (e.g., electronics, collectibles) will also drive long-term growth.
Leading Players in the Resale Apps Sector
- eBay
- Facebook Marketplace
- Poshmark
- Depop
- thredUP
- Etsy
- Reverb
- OfferUp
- Vinted
- Craigslist
- Hewi
- Gumtree
- ThredUp
- Decluttr
- Worthy
- LetGo
- Nextdoor
- Tradesy
- Mercari
Key Milestones in Resale Apps Industry
- 2019: Increased focus on sustainable fashion drives user adoption on platforms like Depop and Poshmark.
- 2020: COVID-19 pandemic accelerates adoption of online resale as consumers seek income and value.
- 2021: Major investments in AI and machine learning for authentication and personalization across leading platforms.
- 2022: Growing regulatory scrutiny on data privacy and consumer protection for P2P marketplaces.
- 2023: Rise of brand-led resale initiatives and partnerships, signaling a shift towards a more integrated circular economy.
- 2024 (Estimated): Expansion of international markets and diversification of product categories beyond fashion.
Strategic Outlook for Resale Apps Market
The strategic outlook for the resale apps market remains exceptionally positive, projected for continued growth at over 15% CAGR through 2033, reaching an estimated 1.2 trillion dollars. Growth accelerators will include further technological integration, such as blockchain for provenance tracking and advanced AI for enhanced customer experiences. Strategic partnerships with traditional retailers and brands seeking to embrace the circular economy will be crucial. Market expansion into underserved regions and the continued diversification of product offerings beyond apparel will also fuel growth. The increasing consumer demand for sustainable and affordable options positions resale apps as a cornerstone of future commerce.
Resale Apps Segmentation
-
1. Application
- 1.1. C2C
- 1.2. B2C
-
2. Types
- 2.1. Android
- 2.2. iOS
Resale Apps Segmentation By Geography
-
1. North America
- 1.1. United States
- 1.2. Canada
- 1.3. Mexico
-
2. South America
- 2.1. Brazil
- 2.2. Argentina
- 2.3. Rest of South America
-
3. Europe
- 3.1. United Kingdom
- 3.2. Germany
- 3.3. France
- 3.4. Italy
- 3.5. Spain
- 3.6. Russia
- 3.7. Benelux
- 3.8. Nordics
- 3.9. Rest of Europe
-
4. Middle East & Africa
- 4.1. Turkey
- 4.2. Israel
- 4.3. GCC
- 4.4. North Africa
- 4.5. South Africa
- 4.6. Rest of Middle East & Africa
-
5. Asia Pacific
- 5.1. China
- 5.2. India
- 5.3. Japan
- 5.4. South Korea
- 5.5. ASEAN
- 5.6. Oceania
- 5.7. Rest of Asia Pacific
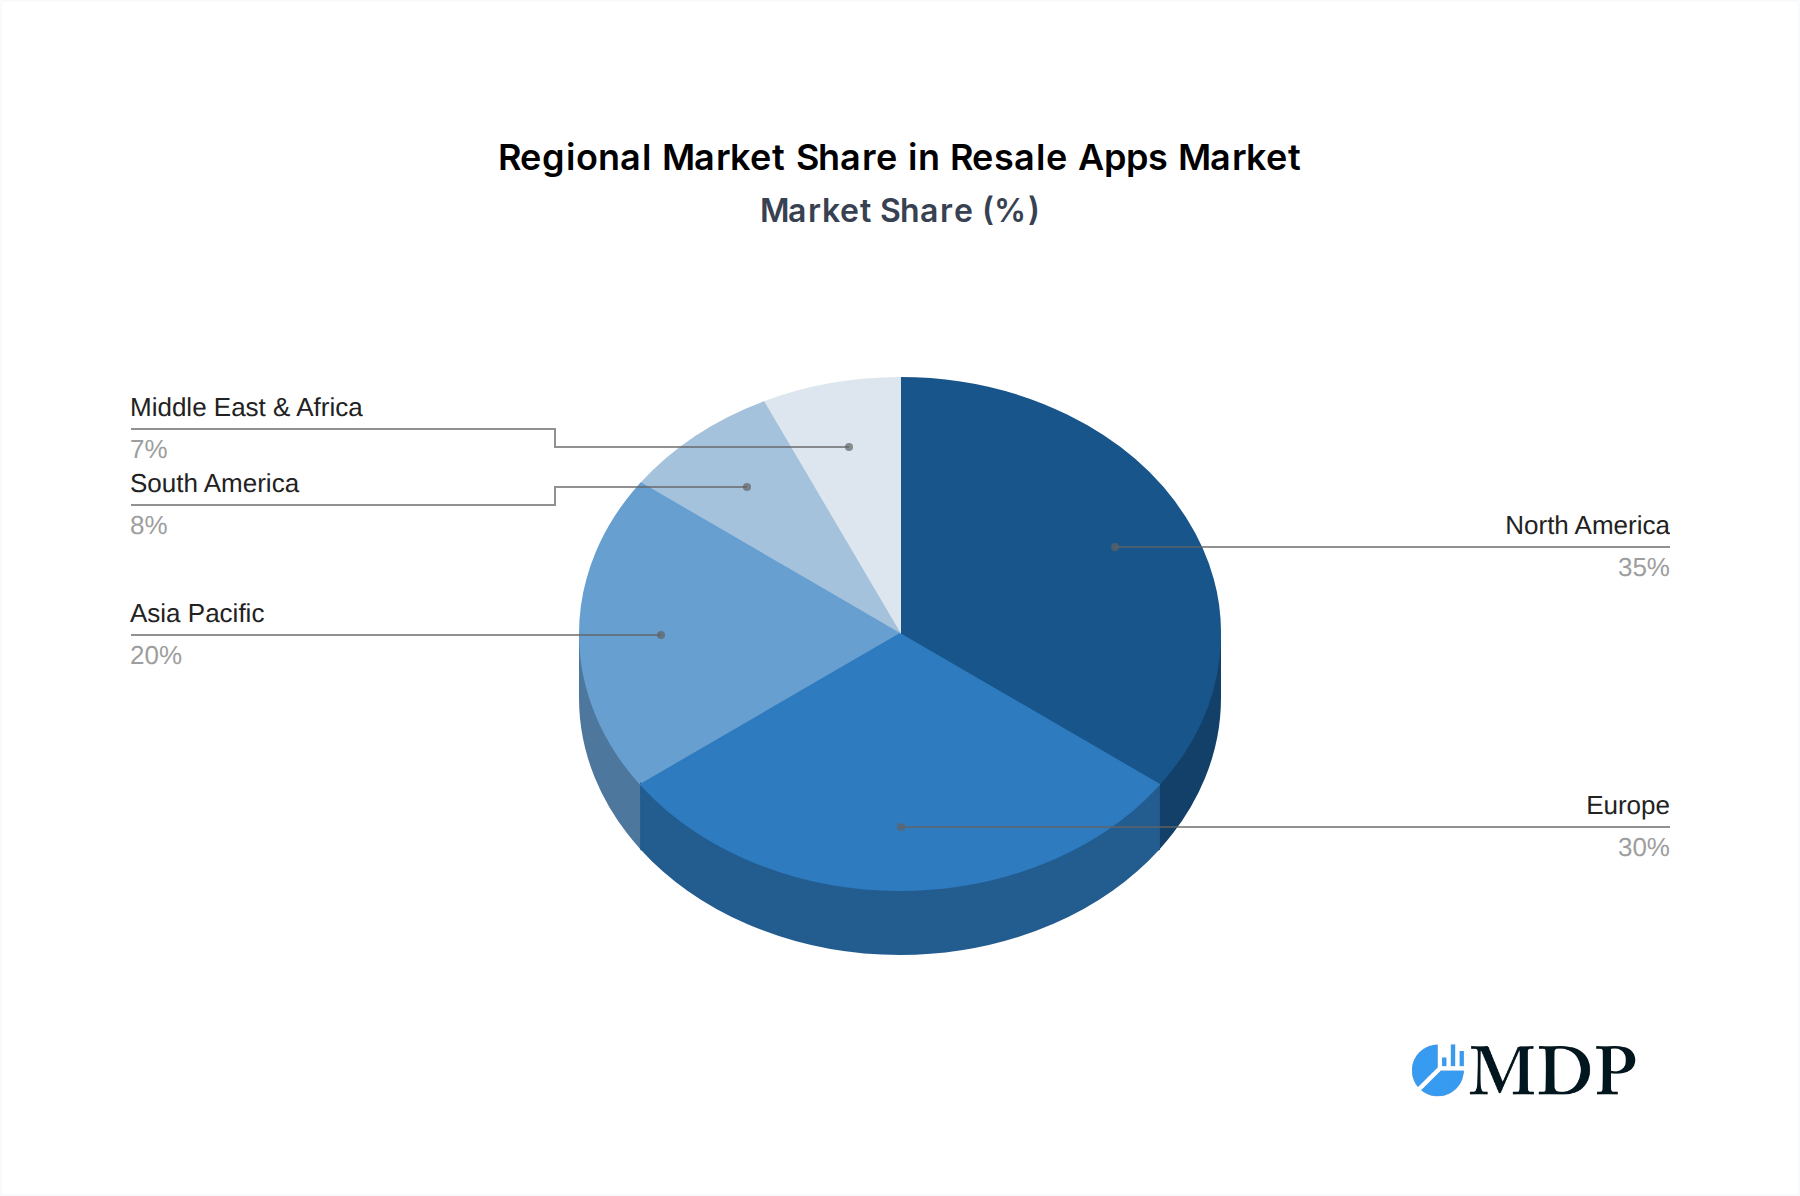
Resale Apps Regional Market Share
Geographic Coverage of Resale Apps
Resale Apps REPORT HIGHLIGHTS
| Aspects | Details |
|---|---|
| Study Period | 2020-2034 |
| Base Year | 2025 |
| Estimated Year | 2026 |
| Forecast Period | 2026-2034 |
| Historical Period | 2020-2025 |
| Growth Rate | CAGR of 12% from 2020-2034 |
| Segmentation |
|
Table of Contents
- 1. Introduction
- 1.1. Research Scope
- 1.2. Market Segmentation
- 1.3. Research Methodology
- 1.4. Definitions and Assumptions
- 2. Executive Summary
- 2.1. Introduction
- 3. Market Dynamics
- 3.1. Introduction
- 3.2. Market Drivers
- 3.3. Market Restrains
- 3.4. Market Trends
- 4. Market Factor Analysis
- 4.1. Porters Five Forces
- 4.2. Supply/Value Chain
- 4.3. PESTEL analysis
- 4.4. Market Entropy
- 4.5. Patent/Trademark Analysis
- 5. Global Resale Apps Analysis, Insights and Forecast, 2020-2032
- 5.1. Market Analysis, Insights and Forecast - by Application
- 5.1.1. C2C
- 5.1.2. B2C
- 5.2. Market Analysis, Insights and Forecast - by Types
- 5.2.1. Android
- 5.2.2. iOS
- 5.3. Market Analysis, Insights and Forecast - by Region
- 5.3.1. North America
- 5.3.2. South America
- 5.3.3. Europe
- 5.3.4. Middle East & Africa
- 5.3.5. Asia Pacific
- 5.1. Market Analysis, Insights and Forecast - by Application
- 6. North America Resale Apps Analysis, Insights and Forecast, 2020-2032
- 6.1. Market Analysis, Insights and Forecast - by Application
- 6.1.1. C2C
- 6.1.2. B2C
- 6.2. Market Analysis, Insights and Forecast - by Types
- 6.2.1. Android
- 6.2.2. iOS
- 6.1. Market Analysis, Insights and Forecast - by Application
- 7. South America Resale Apps Analysis, Insights and Forecast, 2020-2032
- 7.1. Market Analysis, Insights and Forecast - by Application
- 7.1.1. C2C
- 7.1.2. B2C
- 7.2. Market Analysis, Insights and Forecast - by Types
- 7.2.1. Android
- 7.2.2. iOS
- 7.1. Market Analysis, Insights and Forecast - by Application
- 8. Europe Resale Apps Analysis, Insights and Forecast, 2020-2032
- 8.1. Market Analysis, Insights and Forecast - by Application
- 8.1.1. C2C
- 8.1.2. B2C
- 8.2. Market Analysis, Insights and Forecast - by Types
- 8.2.1. Android
- 8.2.2. iOS
- 8.1. Market Analysis, Insights and Forecast - by Application
- 9. Middle East & Africa Resale Apps Analysis, Insights and Forecast, 2020-2032
- 9.1. Market Analysis, Insights and Forecast - by Application
- 9.1.1. C2C
- 9.1.2. B2C
- 9.2. Market Analysis, Insights and Forecast - by Types
- 9.2.1. Android
- 9.2.2. iOS
- 9.1. Market Analysis, Insights and Forecast - by Application
- 10. Asia Pacific Resale Apps Analysis, Insights and Forecast, 2020-2032
- 10.1. Market Analysis, Insights and Forecast - by Application
- 10.1.1. C2C
- 10.1.2. B2C
- 10.2. Market Analysis, Insights and Forecast - by Types
- 10.2.1. Android
- 10.2.2. iOS
- 10.1. Market Analysis, Insights and Forecast - by Application
- 11. Competitive Analysis
- 11.1. Global Market Share Analysis 2025
- 11.2. Company Profiles
- 11.2.1 eBay
- 11.2.1.1. Overview
- 11.2.1.2. Products
- 11.2.1.3. SWOT Analysis
- 11.2.1.4. Recent Developments
- 11.2.1.5. Financials (Based on Availability)
- 11.2.2 Facebook Marketplace
- 11.2.2.1. Overview
- 11.2.2.2. Products
- 11.2.2.3. SWOT Analysis
- 11.2.2.4. Recent Developments
- 11.2.2.5. Financials (Based on Availability)
- 11.2.3 Poshmark
- 11.2.3.1. Overview
- 11.2.3.2. Products
- 11.2.3.3. SWOT Analysis
- 11.2.3.4. Recent Developments
- 11.2.3.5. Financials (Based on Availability)
- 11.2.4 Depop
- 11.2.4.1. Overview
- 11.2.4.2. Products
- 11.2.4.3. SWOT Analysis
- 11.2.4.4. Recent Developments
- 11.2.4.5. Financials (Based on Availability)
- 11.2.5 thredUP
- 11.2.5.1. Overview
- 11.2.5.2. Products
- 11.2.5.3. SWOT Analysis
- 11.2.5.4. Recent Developments
- 11.2.5.5. Financials (Based on Availability)
- 11.2.6 Etsy
- 11.2.6.1. Overview
- 11.2.6.2. Products
- 11.2.6.3. SWOT Analysis
- 11.2.6.4. Recent Developments
- 11.2.6.5. Financials (Based on Availability)
- 11.2.7 Reverb
- 11.2.7.1. Overview
- 11.2.7.2. Products
- 11.2.7.3. SWOT Analysis
- 11.2.7.4. Recent Developments
- 11.2.7.5. Financials (Based on Availability)
- 11.2.8 OfferUp
- 11.2.8.1. Overview
- 11.2.8.2. Products
- 11.2.8.3. SWOT Analysis
- 11.2.8.4. Recent Developments
- 11.2.8.5. Financials (Based on Availability)
- 11.2.9 Vinted
- 11.2.9.1. Overview
- 11.2.9.2. Products
- 11.2.9.3. SWOT Analysis
- 11.2.9.4. Recent Developments
- 11.2.9.5. Financials (Based on Availability)
- 11.2.10 Craigslist
- 11.2.10.1. Overview
- 11.2.10.2. Products
- 11.2.10.3. SWOT Analysis
- 11.2.10.4. Recent Developments
- 11.2.10.5. Financials (Based on Availability)
- 11.2.11 Hewi
- 11.2.11.1. Overview
- 11.2.11.2. Products
- 11.2.11.3. SWOT Analysis
- 11.2.11.4. Recent Developments
- 11.2.11.5. Financials (Based on Availability)
- 11.2.12 Gumtree
- 11.2.12.1. Overview
- 11.2.12.2. Products
- 11.2.12.3. SWOT Analysis
- 11.2.12.4. Recent Developments
- 11.2.12.5. Financials (Based on Availability)
- 11.2.13 Instagram
- 11.2.13.1. Overview
- 11.2.13.2. Products
- 11.2.13.3. SWOT Analysis
- 11.2.13.4. Recent Developments
- 11.2.13.5. Financials (Based on Availability)
- 11.2.14 ThredUp
- 11.2.14.1. Overview
- 11.2.14.2. Products
- 11.2.14.3. SWOT Analysis
- 11.2.14.4. Recent Developments
- 11.2.14.5. Financials (Based on Availability)
- 11.2.15 Decluttr
- 11.2.15.1. Overview
- 11.2.15.2. Products
- 11.2.15.3. SWOT Analysis
- 11.2.15.4. Recent Developments
- 11.2.15.5. Financials (Based on Availability)
- 11.2.16 Worthy
- 11.2.16.1. Overview
- 11.2.16.2. Products
- 11.2.16.3. SWOT Analysis
- 11.2.16.4. Recent Developments
- 11.2.16.5. Financials (Based on Availability)
- 11.2.17 LetGo
- 11.2.17.1. Overview
- 11.2.17.2. Products
- 11.2.17.3. SWOT Analysis
- 11.2.17.4. Recent Developments
- 11.2.17.5. Financials (Based on Availability)
- 11.2.18 Nextdoor
- 11.2.18.1. Overview
- 11.2.18.2. Products
- 11.2.18.3. SWOT Analysis
- 11.2.18.4. Recent Developments
- 11.2.18.5. Financials (Based on Availability)
- 11.2.19 Tradesy
- 11.2.19.1. Overview
- 11.2.19.2. Products
- 11.2.19.3. SWOT Analysis
- 11.2.19.4. Recent Developments
- 11.2.19.5. Financials (Based on Availability)
- 11.2.20 Mercari
- 11.2.20.1. Overview
- 11.2.20.2. Products
- 11.2.20.3. SWOT Analysis
- 11.2.20.4. Recent Developments
- 11.2.20.5. Financials (Based on Availability)
- 11.2.1 eBay
List of Figures
- Figure 1: Global Resale Apps Revenue Breakdown (undefined, %) by Region 2025 & 2033
- Figure 2: North America Resale Apps Revenue (undefined), by Application 2025 & 2033
- Figure 3: North America Resale Apps Revenue Share (%), by Application 2025 & 2033
- Figure 4: North America Resale Apps Revenue (undefined), by Types 2025 & 2033
- Figure 5: North America Resale Apps Revenue Share (%), by Types 2025 & 2033
- Figure 6: North America Resale Apps Revenue (undefined), by Country 2025 & 2033
- Figure 7: North America Resale Apps Revenue Share (%), by Country 2025 & 2033
- Figure 8: South America Resale Apps Revenue (undefined), by Application 2025 & 2033
- Figure 9: South America Resale Apps Revenue Share (%), by Application 2025 & 2033
- Figure 10: South America Resale Apps Revenue (undefined), by Types 2025 & 2033
- Figure 11: South America Resale Apps Revenue Share (%), by Types 2025 & 2033
- Figure 12: South America Resale Apps Revenue (undefined), by Country 2025 & 2033
- Figure 13: South America Resale Apps Revenue Share (%), by Country 2025 & 2033
- Figure 14: Europe Resale Apps Revenue (undefined), by Application 2025 & 2033
- Figure 15: Europe Resale Apps Revenue Share (%), by Application 2025 & 2033
- Figure 16: Europe Resale Apps Revenue (undefined), by Types 2025 & 2033
- Figure 17: Europe Resale Apps Revenue Share (%), by Types 2025 & 2033
- Figure 18: Europe Resale Apps Revenue (undefined), by Country 2025 & 2033
- Figure 19: Europe Resale Apps Revenue Share (%), by Country 2025 & 2033
- Figure 20: Middle East & Africa Resale Apps Revenue (undefined), by Application 2025 & 2033
- Figure 21: Middle East & Africa Resale Apps Revenue Share (%), by Application 2025 & 2033
- Figure 22: Middle East & Africa Resale Apps Revenue (undefined), by Types 2025 & 2033
- Figure 23: Middle East & Africa Resale Apps Revenue Share (%), by Types 2025 & 2033
- Figure 24: Middle East & Africa Resale Apps Revenue (undefined), by Country 2025 & 2033
- Figure 25: Middle East & Africa Resale Apps Revenue Share (%), by Country 2025 & 2033
- Figure 26: Asia Pacific Resale Apps Revenue (undefined), by Application 2025 & 2033
- Figure 27: Asia Pacific Resale Apps Revenue Share (%), by Application 2025 & 2033
- Figure 28: Asia Pacific Resale Apps Revenue (undefined), by Types 2025 & 2033
- Figure 29: Asia Pacific Resale Apps Revenue Share (%), by Types 2025 & 2033
- Figure 30: Asia Pacific Resale Apps Revenue (undefined), by Country 2025 & 2033
- Figure 31: Asia Pacific Resale Apps Revenue Share (%), by Country 2025 & 2033
List of Tables
- Table 1: Global Resale Apps Revenue undefined Forecast, by Application 2020 & 2033
- Table 2: Global Resale Apps Revenue undefined Forecast, by Types 2020 & 2033
- Table 3: Global Resale Apps Revenue undefined Forecast, by Region 2020 & 2033
- Table 4: Global Resale Apps Revenue undefined Forecast, by Application 2020 & 2033
- Table 5: Global Resale Apps Revenue undefined Forecast, by Types 2020 & 2033
- Table 6: Global Resale Apps Revenue undefined Forecast, by Country 2020 & 2033
- Table 7: United States Resale Apps Revenue (undefined) Forecast, by Application 2020 & 2033
- Table 8: Canada Resale Apps Revenue (undefined) Forecast, by Application 2020 & 2033
- Table 9: Mexico Resale Apps Revenue (undefined) Forecast, by Application 2020 & 2033
- Table 10: Global Resale Apps Revenue undefined Forecast, by Application 2020 & 2033
- Table 11: Global Resale Apps Revenue undefined Forecast, by Types 2020 & 2033
- Table 12: Global Resale Apps Revenue undefined Forecast, by Country 2020 & 2033
- Table 13: Brazil Resale Apps Revenue (undefined) Forecast, by Application 2020 & 2033
- Table 14: Argentina Resale Apps Revenue (undefined) Forecast, by Application 2020 & 2033
- Table 15: Rest of South America Resale Apps Revenue (undefined) Forecast, by Application 2020 & 2033
- Table 16: Global Resale Apps Revenue undefined Forecast, by Application 2020 & 2033
- Table 17: Global Resale Apps Revenue undefined Forecast, by Types 2020 & 2033
- Table 18: Global Resale Apps Revenue undefined Forecast, by Country 2020 & 2033
- Table 19: United Kingdom Resale Apps Revenue (undefined) Forecast, by Application 2020 & 2033
- Table 20: Germany Resale Apps Revenue (undefined) Forecast, by Application 2020 & 2033
- Table 21: France Resale Apps Revenue (undefined) Forecast, by Application 2020 & 2033
- Table 22: Italy Resale Apps Revenue (undefined) Forecast, by Application 2020 & 2033
- Table 23: Spain Resale Apps Revenue (undefined) Forecast, by Application 2020 & 2033
- Table 24: Russia Resale Apps Revenue (undefined) Forecast, by Application 2020 & 2033
- Table 25: Benelux Resale Apps Revenue (undefined) Forecast, by Application 2020 & 2033
- Table 26: Nordics Resale Apps Revenue (undefined) Forecast, by Application 2020 & 2033
- Table 27: Rest of Europe Resale Apps Revenue (undefined) Forecast, by Application 2020 & 2033
- Table 28: Global Resale Apps Revenue undefined Forecast, by Application 2020 & 2033
- Table 29: Global Resale Apps Revenue undefined Forecast, by Types 2020 & 2033
- Table 30: Global Resale Apps Revenue undefined Forecast, by Country 2020 & 2033
- Table 31: Turkey Resale Apps Revenue (undefined) Forecast, by Application 2020 & 2033
- Table 32: Israel Resale Apps Revenue (undefined) Forecast, by Application 2020 & 2033
- Table 33: GCC Resale Apps Revenue (undefined) Forecast, by Application 2020 & 2033
- Table 34: North Africa Resale Apps Revenue (undefined) Forecast, by Application 2020 & 2033
- Table 35: South Africa Resale Apps Revenue (undefined) Forecast, by Application 2020 & 2033
- Table 36: Rest of Middle East & Africa Resale Apps Revenue (undefined) Forecast, by Application 2020 & 2033
- Table 37: Global Resale Apps Revenue undefined Forecast, by Application 2020 & 2033
- Table 38: Global Resale Apps Revenue undefined Forecast, by Types 2020 & 2033
- Table 39: Global Resale Apps Revenue undefined Forecast, by Country 2020 & 2033
- Table 40: China Resale Apps Revenue (undefined) Forecast, by Application 2020 & 2033
- Table 41: India Resale Apps Revenue (undefined) Forecast, by Application 2020 & 2033
- Table 42: Japan Resale Apps Revenue (undefined) Forecast, by Application 2020 & 2033
- Table 43: South Korea Resale Apps Revenue (undefined) Forecast, by Application 2020 & 2033
- Table 44: ASEAN Resale Apps Revenue (undefined) Forecast, by Application 2020 & 2033
- Table 45: Oceania Resale Apps Revenue (undefined) Forecast, by Application 2020 & 2033
- Table 46: Rest of Asia Pacific Resale Apps Revenue (undefined) Forecast, by Application 2020 & 2033
Frequently Asked Questions
1. What is the projected Compound Annual Growth Rate (CAGR) of the Resale Apps?
The projected CAGR is approximately 12%.
2. Which companies are prominent players in the Resale Apps?
Key companies in the market include eBay, Facebook Marketplace, Poshmark, Depop, thredUP, Etsy, Reverb, OfferUp, Vinted, Craigslist, Hewi, Gumtree, Instagram, ThredUp, Decluttr, Worthy, LetGo, Nextdoor, Tradesy, Mercari.
3. What are the main segments of the Resale Apps?
The market segments include Application, Types.
4. Can you provide details about the market size?
The market size is estimated to be USD XXX N/A as of 2022.
5. What are some drivers contributing to market growth?
N/A
6. What are the notable trends driving market growth?
N/A
7. Are there any restraints impacting market growth?
N/A
8. Can you provide examples of recent developments in the market?
N/A
9. What pricing options are available for accessing the report?
Pricing options include single-user, multi-user, and enterprise licenses priced at USD 3650.00, USD 5475.00, and USD 7300.00 respectively.
10. Is the market size provided in terms of value or volume?
The market size is provided in terms of value, measured in N/A.
11. Are there any specific market keywords associated with the report?
Yes, the market keyword associated with the report is "Resale Apps," which aids in identifying and referencing the specific market segment covered.
12. How do I determine which pricing option suits my needs best?
The pricing options vary based on user requirements and access needs. Individual users may opt for single-user licenses, while businesses requiring broader access may choose multi-user or enterprise licenses for cost-effective access to the report.
13. Are there any additional resources or data provided in the Resale Apps report?
While the report offers comprehensive insights, it's advisable to review the specific contents or supplementary materials provided to ascertain if additional resources or data are available.
14. How can I stay updated on further developments or reports in the Resale Apps?
To stay informed about further developments, trends, and reports in the Resale Apps, consider subscribing to industry newsletters, following relevant companies and organizations, or regularly checking reputable industry news sources and publications.
Methodology
Step 1 - Identification of Relevant Samples Size from Population Database


Step 2 - Approaches for Defining Global Market Size (Value, Volume* & Price*)

Note*: In applicable scenarios
Step 3 - Data Sources
Primary Research
- Web Analytics
- Survey Reports
- Research Institute
- Latest Research Reports
- Opinion Leaders
Secondary Research
- Annual Reports
- White Paper
- Latest Press Release
- Industry Association
- Paid Database
- Investor Presentations

Step 4 - Data Triangulation
Involves using different sources of information in order to increase the validity of a study
These sources are likely to be stakeholders in a program - participants, other researchers, program staff, other community members, and so on.
Then we put all data in single framework & apply various statistical tools to find out the dynamic on the market.
During the analysis stage, feedback from the stakeholder groups would be compared to determine areas of agreement as well as areas of divergence