

Key Insights
The Enterprise Augmented Reality (AR) Software market is poised for explosive growth, projected to reach 120.21 billion USD in 2025. This remarkable expansion is fueled by a CAGR of 29.7%, indicating a highly dynamic and rapidly adopting industry. Businesses across various sectors are increasingly leveraging AR solutions to enhance operational efficiency, improve training outcomes, and streamline complex workflows. The demand for immersive and interactive digital overlays on the real world is driven by a confluence of factors including the need for remote assistance, hands-free data access for field service technicians, and enhanced visualization for design and engineering processes. This surge in adoption is transforming how enterprises operate, from manufacturing floors and healthcare facilities to retail environments and educational institutions.
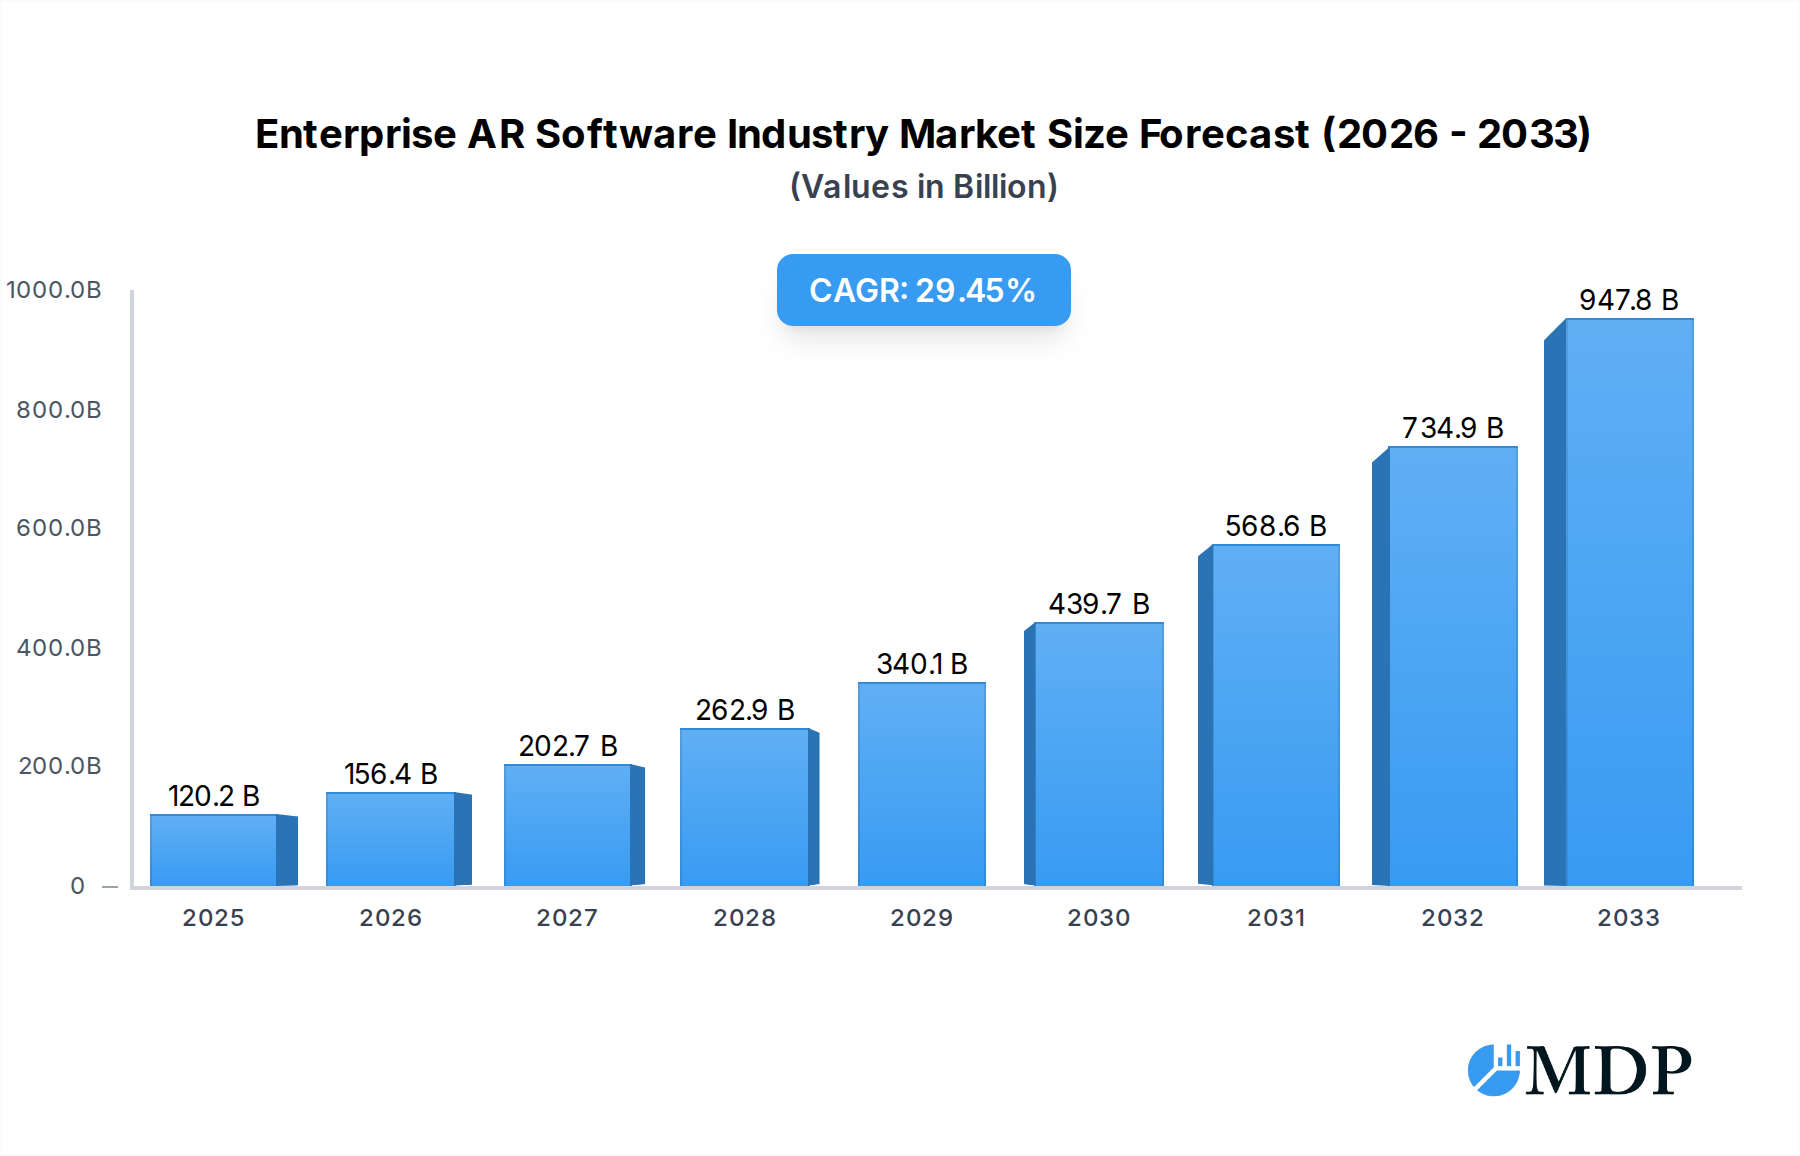
Enterprise AR Software Industry Market Size (In Billion)
The robust market growth is underpinned by several key drivers. Advancements in AR hardware, such as more sophisticated smart glasses and mobile devices, coupled with the development of intuitive and powerful AR software platforms, are making enterprise AR more accessible and cost-effective. Emerging trends like the integration of AI and machine learning with AR for intelligent guidance and predictive analytics are further accelerating adoption. While the market is experiencing unprecedented growth, potential restraints such as the initial investment in hardware and software integration, and the need for specialized training for employees, are being addressed through evolving business models and comprehensive support services. Key end-user verticals including Education, Healthcare, Retail, and Manufacturing are at the forefront of this AR revolution, with significant contributions also coming from other diverse industry segments. Prominent companies like Seiko Epson Corporation, Third Eye Gen Inc., Librestream, and Vuforia (PTC Inc.) are at the forefront of innovation, shaping the competitive landscape. Geographically, North America and Europe are leading the adoption, with Asia Pacific showing rapid growth potential.

Enterprise AR Software Industry Company Market Share
Unlocking the Future of Business: Enterprise AR Software Industry Market Analysis & Forecast 2019-2033
This comprehensive report delves deep into the dynamic Enterprise AR Software Industry, a rapidly evolving sector poised to redefine operational efficiency and customer engagement across diverse verticals. With an estimated market size projected to exceed tens of billions by 2033, this analysis provides critical insights for industry stakeholders, from technology providers to end-users. We explore the current landscape, identify key growth drivers, analyze emerging trends, and forecast the trajectory of this transformative market. This report is meticulously designed for immediate use, requiring no further modification, and incorporates high-traffic keywords such as Augmented Reality for Business, AR in Manufacturing, AR in Healthcare, AR for Retail, Industrial AR Solutions, and AR Software Platforms to ensure maximum search visibility.
Enterprise AR Software Industry Market Dynamics & Concentration
The Enterprise AR Software market exhibits a growing yet moderately concentrated landscape. Innovation remains a primary driver, fueled by advancements in AI, 5G connectivity, and cloud computing, enabling more sophisticated AR applications. Regulatory frameworks are still developing, with a focus on data privacy and interoperability standards. Product substitutes, while present in traditional digital tools, are increasingly being outpaced by the immersive and actionable insights offered by AR. End-user trends highlight a strong demand for solutions that enhance worker productivity, improve training efficacy, and streamline complex processes. Mergers and acquisitions (M&A) are on the rise as larger players seek to integrate cutting-edge AR capabilities and expand their market reach. We anticipate a substantial increase in M&A deal counts, contributing to market consolidation. Key metrics like market share are continuously shifting as new players emerge and established ones innovate. The market penetration of Enterprise AR solutions is projected to surge significantly over the forecast period.
Enterprise AR Software Industry Industry Trends & Analysis
The Enterprise AR Software industry is experiencing robust growth, driven by a convergence of technological advancements, evolving business needs, and increasing digital transformation initiatives. The Augmented Reality Software Market is projected to witness a compound annual growth rate (CAGR) of over 20% from the base year 2025 through 2033. This remarkable expansion is propelled by several key market growth drivers. Firstly, the increasing demand for remote assistance and guided workflows in sectors like manufacturing, field service, and healthcare is a significant catalyst. AR software allows experts to remotely guide on-site technicians, reducing travel costs and minimizing downtime. Secondly, the need for more effective and engaging training programs is driving adoption in education and corporate environments. Immersive AR experiences offer hands-on learning opportunities that surpass traditional methods. Thirdly, the quest for enhanced operational efficiency and reduced error rates in complex industrial processes is a major factor. AR overlays digital information onto the physical world, providing real-time data and instructions, thereby minimizing human error and boosting productivity.
Technological disruptions are continuously shaping the AR landscape. The proliferation of powerful mobile devices, the development of specialized AR headsets, and improvements in computer vision and spatial mapping technologies are making AR solutions more accessible and capable. The integration of artificial intelligence (AI) is further enhancing AR applications, enabling intelligent object recognition, predictive analytics, and more personalized user experiences. Consumer preferences, while historically focused on entertainment, are increasingly shifting towards practical, utility-driven AR applications in the enterprise setting. Businesses are recognizing the tangible ROI that AR can deliver. The competitive dynamics within the market are intensifying, with established software giants, hardware manufacturers, and specialized AR startups vying for market share. This competition fosters innovation and drives down costs, making AR solutions more attractive to a wider range of businesses. Market penetration for enterprise AR is still in its nascent stages, indicating substantial headroom for future growth.
Leading Markets & Segments in Enterprise AR Software Industry
The Manufacturing segment stands as the dominant region within the Enterprise AR Software Industry, driven by the imperative for Industry 4.0 integration and enhanced operational efficiency. This dominance is further solidified by the significant adoption of AR for worker guidance, remote maintenance, quality control, and assembly line optimization. The Automotive and Aerospace sub-sectors within manufacturing are particularly leading the charge, leveraging AR to streamline complex production processes and reduce assembly times.
- Manufacturing Dominance Drivers:
- Industry 4.0 Initiatives: AR is a cornerstone technology for smart factories, enabling data-driven decision-making and autonomous operations.
- Skilled Labor Shortages: AR-powered training and guidance solutions are crucial for upskilling existing workforces and onboarding new employees quickly and effectively.
- Cost Reduction: AR applications lead to significant savings through reduced errors, decreased downtime, and optimized resource utilization.
- Safety Improvements: Visualizing potential hazards and providing real-time safety instructions through AR enhances workplace safety.
The Healthcare sector is emerging as a strong contender, with AR applications in surgical planning, medical training, patient education, and remote diagnostics. The Retail segment is rapidly adopting AR for virtual try-on experiences, product visualization, and enhanced in-store navigation, aiming to improve customer engagement and reduce return rates. The Education segment is witnessing growing interest for interactive learning experiences and remote collaboration. The Other End-user Verticals, encompassing logistics, construction, energy, and defense, are also exploring and implementing AR solutions to address specific operational challenges. The United States continues to lead in market adoption due to early investment in AR technology, a strong technological infrastructure, and a mature enterprise market. However, regions like Europe and Asia-Pacific are exhibiting rapid growth rates, fueled by government initiatives promoting digital transformation and increasing enterprise investment.
Enterprise AR Software Industry Product Developments
Product developments in the Enterprise AR Software industry are characterized by a relentless pursuit of enhanced usability, integration capabilities, and specialized functionalities. Key innovations focus on improving real-time data overlay accuracy, gesture recognition, and voice command intuitiveness. Companies are developing platforms that seamlessly integrate with existing ERP, MES, and CRM systems, ensuring a fluid workflow. The competitive advantage lies in offering end-to-end solutions that address specific industry pain points, such as remote expert assistance for field technicians or interactive training modules for complex machinery. The trend towards more lightweight, untethered AR headsets and improved battery life is also a significant factor in product evolution, making AR more practical for prolonged use in various industrial settings.
Key Drivers of Enterprise AR Software Industry Growth
The growth of the Enterprise AR Software industry is propelled by several interconnected factors. Technologically, the maturation of AI, 5G networks, and advancements in computer vision are enabling more sophisticated and reliable AR experiences. Economically, the clear demonstration of ROI through increased productivity, reduced errors, and cost savings is a primary driver for enterprise adoption. Regulatory factors, while still evolving, are increasingly supporting digital transformation initiatives that often incorporate AR solutions. Specific examples include the push for Industry 4.0 in manufacturing, which necessitates technologies like AR for efficiency gains. The increasing availability of skilled AR developers and a growing understanding of AR's potential across various business functions are also significant growth accelerators.
Challenges in the Enterprise AR Software Industry Market
Despite its promising growth, the Enterprise AR Software industry faces several challenges. High initial implementation costs for hardware and software can be a barrier for small and medium-sized enterprises. The need for specialized IT infrastructure and integration with legacy systems can also present significant hurdles. While improving, the availability of skilled personnel to develop, deploy, and manage AR solutions remains a concern. Ensuring data security and privacy within AR applications is paramount and requires robust solutions. Furthermore, the development of standardized interoperability protocols across different AR platforms is crucial for widespread adoption and to avoid vendor lock-in. Quantifiable impacts include delayed project timelines and increased project complexity.
Emerging Opportunities in Enterprise AR Software Industry
Emerging opportunities in the Enterprise AR Software industry are vast and continue to expand. Technological breakthroughs in areas like spatial computing and haptic feedback promise even more immersive and intuitive AR experiences. Strategic partnerships between AR software providers, hardware manufacturers, and cloud service providers are crucial for creating comprehensive ecosystems that simplify adoption for businesses. Market expansion into untapped verticals and geographies, coupled with the development of industry-specific AR solutions, will unlock new revenue streams. The growing demand for AR in sustainable business practices, such as remote monitoring and reduced travel, also presents a significant opportunity.
Leading Players in the Enterprise AR Software Industry Sector
- Seiko Epson Corporation
- Third Eye Gen Inc
- Librestream
- RE'FLEKT GmbH
- XMReality
- Upskill
- Scope AR
- Fieldbit
- Atheer Inc
- Blippar Ltd
- Ubimax GmbH
- Vuforia (PTC Inc )
Key Milestones in Enterprise AR Software Industry Industry
- March 2023: Snap announced a new business unit, AR Enterprise Services (ARES), aiming to equip retailers with augmented reality shopping tools for at-home try-ons, focusing on improving conversions and reducing return rates. This includes professional services like product marketing and customer support, with their "Shopping Suite" targeting fashion, apparel, accessories, and home furnishings.
- July 2023: Atlas Copco acquired Extend3D GmbH, a developer of augmented reality worker guidance systems using laser and video projection for industrial customers. Extend3D's AR systems, including 3D video and laser projectors, support manufacturing processes within Industry 4.0, serving key clients in the automotive, large transportation, aerospace, and general industries.
Strategic Outlook for Enterprise AR Software Industry Market
The strategic outlook for the Enterprise AR Software Industry market is exceptionally positive, characterized by continuous innovation and expanding application landscapes. Growth will be accelerated by the increasing integration of AR with AI and IoT, creating intelligent and responsive operational environments. The development of more affordable and accessible AR hardware, coupled with the proliferation of cloud-based AR platforms, will democratize access for a broader range of businesses. Strategic opportunities lie in creating vertical-specific AR solutions that address unique industry challenges and in forging strategic alliances to build comprehensive end-to-end AR ecosystems. The long-term market potential is immense, driven by the ongoing digital transformation across all sectors.
Enterprise AR Software Industry Segmentation
-
1. Category
- 1.1. Education
- 1.2. Healthcare
- 1.3. Retail
- 1.4. Manufacturing
- 1.5. Other End-user Verticals
Enterprise AR Software Industry Segmentation By Geography
- 1. North America
- 2. Europe
- 3. Asia Pacific
- 4. Rest of the World
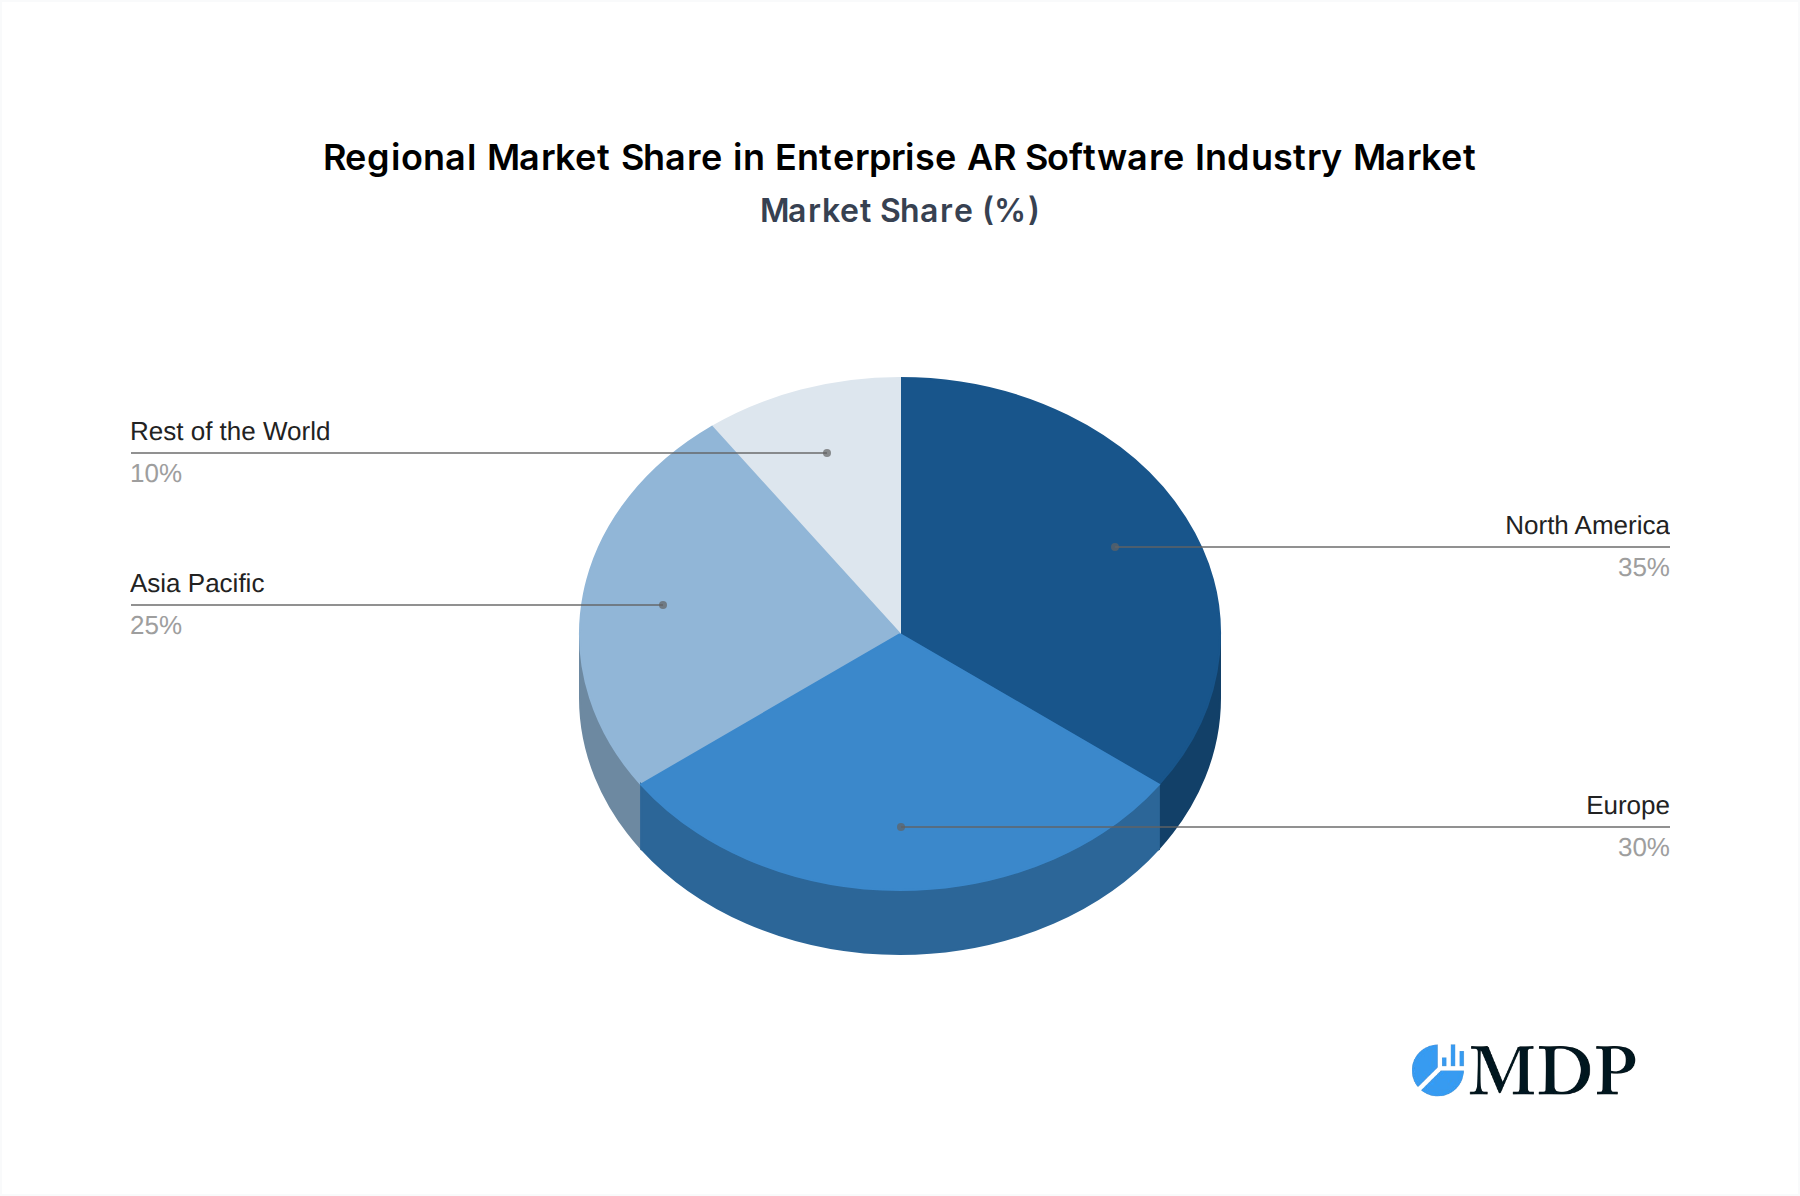
Enterprise AR Software Industry Regional Market Share
Geographic Coverage of Enterprise AR Software Industry
Enterprise AR Software Industry REPORT HIGHLIGHTS
| Aspects | Details |
|---|---|
| Study Period | 2020-2034 |
| Base Year | 2025 |
| Estimated Year | 2026 |
| Forecast Period | 2026-2034 |
| Historical Period | 2020-2025 |
| Growth Rate | CAGR of 29.7% from 2020-2034 |
| Segmentation |
|
Table of Contents
- 1. Introduction
- 1.1. Research Scope
- 1.2. Market Segmentation
- 1.3. Research Objective
- 1.4. Definitions and Assumptions
- 2. Executive Summary
- 2.1. Market Snapshot
- 3. Market Dynamics
- 3.1. Market Drivers
- 3.2. Market Restrains
- 3.3. Market Trends
- 3.4. Market Opportunities
- 4. Market Factor Analysis
- 4.1. Porters Five Forces
- 4.1.1. Bargaining Power of Suppliers
- 4.1.2. Bargaining Power of Buyers
- 4.1.3. Threat of New Entrants
- 4.1.4. Threat of Substitutes
- 4.1.5. Competitive Rivalry
- 4.2. PESTEL analysis
- 4.3. BCG Analysis
- 4.3.1. Stars (High Growth, High Market Share)
- 4.3.2. Cash Cows (Low Growth, High Market Share)
- 4.3.3. Question Mark (High Growth, Low Market Share)
- 4.3.4. Dogs (Low Growth, Low Market Share)
- 4.4. Ansoff Matrix Analysis
- 4.5. Supply Chain Analysis
- 4.6. Regulatory Landscape
- 4.7. Current Market Potential and Opportunity Assessment (TAM–SAM–SOM Framework)
- 4.8. MDP Analyst Note
- 4.1. Porters Five Forces
- 5. Market Analysis, Insights and Forecast 2021-2033
- 5.1. Market Analysis, Insights and Forecast - by Category
- 5.1.1. Education
- 5.1.2. Healthcare
- 5.1.3. Retail
- 5.1.4. Manufacturing
- 5.1.5. Other End-user Verticals
- 5.2. Market Analysis, Insights and Forecast - by Region
- 5.2.1. North America
- 5.2.2. Europe
- 5.2.3. Asia Pacific
- 5.2.4. Rest of the World
- 5.1. Market Analysis, Insights and Forecast - by Category
- 6. Global Enterprise AR Software Industry Analysis, Insights and Forecast, 2021-2033
- 6.1. Market Analysis, Insights and Forecast - by Category
- 6.1.1. Education
- 6.1.2. Healthcare
- 6.1.3. Retail
- 6.1.4. Manufacturing
- 6.1.5. Other End-user Verticals
- 6.1. Market Analysis, Insights and Forecast - by Category
- 7. North America Enterprise AR Software Industry Analysis, Insights and Forecast, 2020-2032
- 7.1. Market Analysis, Insights and Forecast - by Category
- 7.1.1. Education
- 7.1.2. Healthcare
- 7.1.3. Retail
- 7.1.4. Manufacturing
- 7.1.5. Other End-user Verticals
- 7.1. Market Analysis, Insights and Forecast - by Category
- 8. Europe Enterprise AR Software Industry Analysis, Insights and Forecast, 2020-2032
- 8.1. Market Analysis, Insights and Forecast - by Category
- 8.1.1. Education
- 8.1.2. Healthcare
- 8.1.3. Retail
- 8.1.4. Manufacturing
- 8.1.5. Other End-user Verticals
- 8.1. Market Analysis, Insights and Forecast - by Category
- 9. Asia Pacific Enterprise AR Software Industry Analysis, Insights and Forecast, 2020-2032
- 9.1. Market Analysis, Insights and Forecast - by Category
- 9.1.1. Education
- 9.1.2. Healthcare
- 9.1.3. Retail
- 9.1.4. Manufacturing
- 9.1.5. Other End-user Verticals
- 9.1. Market Analysis, Insights and Forecast - by Category
- 10. Rest of the World Enterprise AR Software Industry Analysis, Insights and Forecast, 2020-2032
- 10.1. Market Analysis, Insights and Forecast - by Category
- 10.1.1. Education
- 10.1.2. Healthcare
- 10.1.3. Retail
- 10.1.4. Manufacturing
- 10.1.5. Other End-user Verticals
- 10.1. Market Analysis, Insights and Forecast - by Category
- 11. Competitive Analysis
- 11.1. Company Profiles
- 11.1.1 Seiko Epson Corporation*List Not Exhaustive
- 11.1.1.1. Company Overview
- 11.1.1.2. Products
- 11.1.1.3. Company Financials
- 11.1.1.4. SWOT Analysis
- 11.1.2 Third Eye Gen Inc
- 11.1.2.1. Company Overview
- 11.1.2.2. Products
- 11.1.2.3. Company Financials
- 11.1.2.4. SWOT Analysis
- 11.1.3 Librestream
- 11.1.3.1. Company Overview
- 11.1.3.2. Products
- 11.1.3.3. Company Financials
- 11.1.3.4. SWOT Analysis
- 11.1.4 RE'FLEKT GmbH
- 11.1.4.1. Company Overview
- 11.1.4.2. Products
- 11.1.4.3. Company Financials
- 11.1.4.4. SWOT Analysis
- 11.1.5 XMReality
- 11.1.5.1. Company Overview
- 11.1.5.2. Products
- 11.1.5.3. Company Financials
- 11.1.5.4. SWOT Analysis
- 11.1.6 Upskill
- 11.1.6.1. Company Overview
- 11.1.6.2. Products
- 11.1.6.3. Company Financials
- 11.1.6.4. SWOT Analysis
- 11.1.7 Scope AR
- 11.1.7.1. Company Overview
- 11.1.7.2. Products
- 11.1.7.3. Company Financials
- 11.1.7.4. SWOT Analysis
- 11.1.8 Fieldbit
- 11.1.8.1. Company Overview
- 11.1.8.2. Products
- 11.1.8.3. Company Financials
- 11.1.8.4. SWOT Analysis
- 11.1.9 Atheer Inc
- 11.1.9.1. Company Overview
- 11.1.9.2. Products
- 11.1.9.3. Company Financials
- 11.1.9.4. SWOT Analysis
- 11.1.10 Blippar Ltd
- 11.1.10.1. Company Overview
- 11.1.10.2. Products
- 11.1.10.3. Company Financials
- 11.1.10.4. SWOT Analysis
- 11.1.11 Ubimax GmbH
- 11.1.11.1. Company Overview
- 11.1.11.2. Products
- 11.1.11.3. Company Financials
- 11.1.11.4. SWOT Analysis
- 11.1.12 Vuforia (PTC Inc )
- 11.1.12.1. Company Overview
- 11.1.12.2. Products
- 11.1.12.3. Company Financials
- 11.1.12.4. SWOT Analysis
- 11.1.1 Seiko Epson Corporation*List Not Exhaustive
- 11.2. Market Entropy
- 11.2.1 Company's Key Areas Served
- 11.2.2 Recent Developments
- 11.3. Company Market Share Analysis 2025
- 11.3.1 Top 5 Companies Market Share Analysis
- 11.3.2 Top 3 Companies Market Share Analysis
- 11.4. List of Potential Customers
- 12. Research Methodology
List of Figures
- Figure 1: Global Enterprise AR Software Industry Revenue Breakdown (billion, %) by Region 2025 & 2033
- Figure 2: North America Enterprise AR Software Industry Revenue (billion), by Category 2025 & 2033
- Figure 3: North America Enterprise AR Software Industry Revenue Share (%), by Category 2025 & 2033
- Figure 4: North America Enterprise AR Software Industry Revenue (billion), by Country 2025 & 2033
- Figure 5: North America Enterprise AR Software Industry Revenue Share (%), by Country 2025 & 2033
- Figure 6: Europe Enterprise AR Software Industry Revenue (billion), by Category 2025 & 2033
- Figure 7: Europe Enterprise AR Software Industry Revenue Share (%), by Category 2025 & 2033
- Figure 8: Europe Enterprise AR Software Industry Revenue (billion), by Country 2025 & 2033
- Figure 9: Europe Enterprise AR Software Industry Revenue Share (%), by Country 2025 & 2033
- Figure 10: Asia Pacific Enterprise AR Software Industry Revenue (billion), by Category 2025 & 2033
- Figure 11: Asia Pacific Enterprise AR Software Industry Revenue Share (%), by Category 2025 & 2033
- Figure 12: Asia Pacific Enterprise AR Software Industry Revenue (billion), by Country 2025 & 2033
- Figure 13: Asia Pacific Enterprise AR Software Industry Revenue Share (%), by Country 2025 & 2033
- Figure 14: Rest of the World Enterprise AR Software Industry Revenue (billion), by Category 2025 & 2033
- Figure 15: Rest of the World Enterprise AR Software Industry Revenue Share (%), by Category 2025 & 2033
- Figure 16: Rest of the World Enterprise AR Software Industry Revenue (billion), by Country 2025 & 2033
- Figure 17: Rest of the World Enterprise AR Software Industry Revenue Share (%), by Country 2025 & 2033
List of Tables
- Table 1: Global Enterprise AR Software Industry Revenue billion Forecast, by Category 2020 & 2033
- Table 2: Global Enterprise AR Software Industry Revenue billion Forecast, by Region 2020 & 2033
- Table 3: Global Enterprise AR Software Industry Revenue billion Forecast, by Category 2020 & 2033
- Table 4: Global Enterprise AR Software Industry Revenue billion Forecast, by Country 2020 & 2033
- Table 5: Global Enterprise AR Software Industry Revenue billion Forecast, by Category 2020 & 2033
- Table 6: Global Enterprise AR Software Industry Revenue billion Forecast, by Country 2020 & 2033
- Table 7: Global Enterprise AR Software Industry Revenue billion Forecast, by Category 2020 & 2033
- Table 8: Global Enterprise AR Software Industry Revenue billion Forecast, by Country 2020 & 2033
- Table 9: Global Enterprise AR Software Industry Revenue billion Forecast, by Category 2020 & 2033
- Table 10: Global Enterprise AR Software Industry Revenue billion Forecast, by Country 2020 & 2033
Frequently Asked Questions
1. What is the projected Compound Annual Growth Rate (CAGR) of the Enterprise AR Software Industry?
The projected CAGR is approximately 29.7%.
2. Which companies are prominent players in the Enterprise AR Software Industry?
Key companies in the market include Seiko Epson Corporation*List Not Exhaustive, Third Eye Gen Inc, Librestream, RE'FLEKT GmbH, XMReality, Upskill, Scope AR, Fieldbit, Atheer Inc, Blippar Ltd, Ubimax GmbH, Vuforia (PTC Inc ).
3. What are the main segments of the Enterprise AR Software Industry?
The market segments include Category.
4. Can you provide details about the market size?
The market size is estimated to be USD 120.21 billion as of 2022.
5. What are some drivers contributing to market growth?
Increased demand for 3D visualization software across various industries.; Increasing acceptance of AR across industry verticals.
6. What are the notable trends driving market growth?
Retail Segment would grow at a higher pace.
7. Are there any restraints impacting market growth?
Managing Regulatory and Compliance Needs Across the World.
8. Can you provide examples of recent developments in the market?
In March 2023, Snap announced a new business unit, AR Enterprise Services, that’ll equip retailers with tools so users can try on clothes, jewelry, and more from various brands from the comfort of home. The new ARES business aims to support retailers in improving conversions and reducing return rates with augmented reality shopping tools. To this end, ARES will provide its customers with professional services, including product marketing and customer support. In addition to tools included in its first solution, the “Shopping Suite” is oriented toward retailers across verticals like fashion, apparel, accessories, and home furnishings.
9. What pricing options are available for accessing the report?
Pricing options include single-user, multi-user, and enterprise licenses priced at USD 4750, USD 5250, and USD 8750 respectively.
10. Is the market size provided in terms of value or volume?
The market size is provided in terms of value, measured in billion.
11. Are there any specific market keywords associated with the report?
Yes, the market keyword associated with the report is "Enterprise AR Software Industry," which aids in identifying and referencing the specific market segment covered.
12. How do I determine which pricing option suits my needs best?
The pricing options vary based on user requirements and access needs. Individual users may opt for single-user licenses, while businesses requiring broader access may choose multi-user or enterprise licenses for cost-effective access to the report.
13. Are there any additional resources or data provided in the Enterprise AR Software Industry report?
While the report offers comprehensive insights, it's advisable to review the specific contents or supplementary materials provided to ascertain if additional resources or data are available.
14. How can I stay updated on further developments or reports in the Enterprise AR Software Industry?
To stay informed about further developments, trends, and reports in the Enterprise AR Software Industry, consider subscribing to industry newsletters, following relevant companies and organizations, or regularly checking reputable industry news sources and publications.
Methodology
Step 1 - Identification of Relevant Samples Size from Population Database


Step 2 - Approaches for Defining Global Market Size (Value, Volume* & Price*)

Note*: In applicable scenarios
Step 3 - Data Sources
Primary Research
- Web Analytics
- Survey Reports
- Research Institute
- Latest Research Reports
- Opinion Leaders
Secondary Research
- Annual Reports
- White Paper
- Latest Press Release
- Industry Association
- Paid Database
- Investor Presentations

Step 4 - Data Triangulation
Involves using different sources of information in order to increase the validity of a study
These sources are likely to be stakeholders in a program - participants, other researchers, program staff, other community members, and so on.
Then we put all data in single framework & apply various statistical tools to find out the dynamic on the market.
During the analysis stage, feedback from the stakeholder groups would be compared to determine areas of agreement as well as areas of divergence