

Key Insights
The Relapsing Multiple Sclerosis (RMS) Treatment market is poised for significant expansion, projected to reach $14.21 billion by 2025, with a robust compound annual growth rate (CAGR) of 8.4% during the forecast period of 2025-2033. This substantial growth is primarily propelled by increasing disease prevalence globally, advancements in therapeutic approaches offering improved efficacy and safety profiles, and a heightened awareness among patients and healthcare professionals regarding early diagnosis and management. The development of novel disease-modifying therapies (DMTs) that can effectively slow disease progression and reduce relapse rates is a key driver, coupled with a growing pipeline of innovative treatments targeting various pathways involved in MS pathophysiology. Furthermore, improved healthcare infrastructure and expanding access to specialized neurological care, particularly in emerging economies, are contributing to market accessibility and patient treatment rates. The market's trajectory is further supported by significant investments in research and development by leading pharmaceutical companies, fostering innovation and the introduction of next-generation treatments.
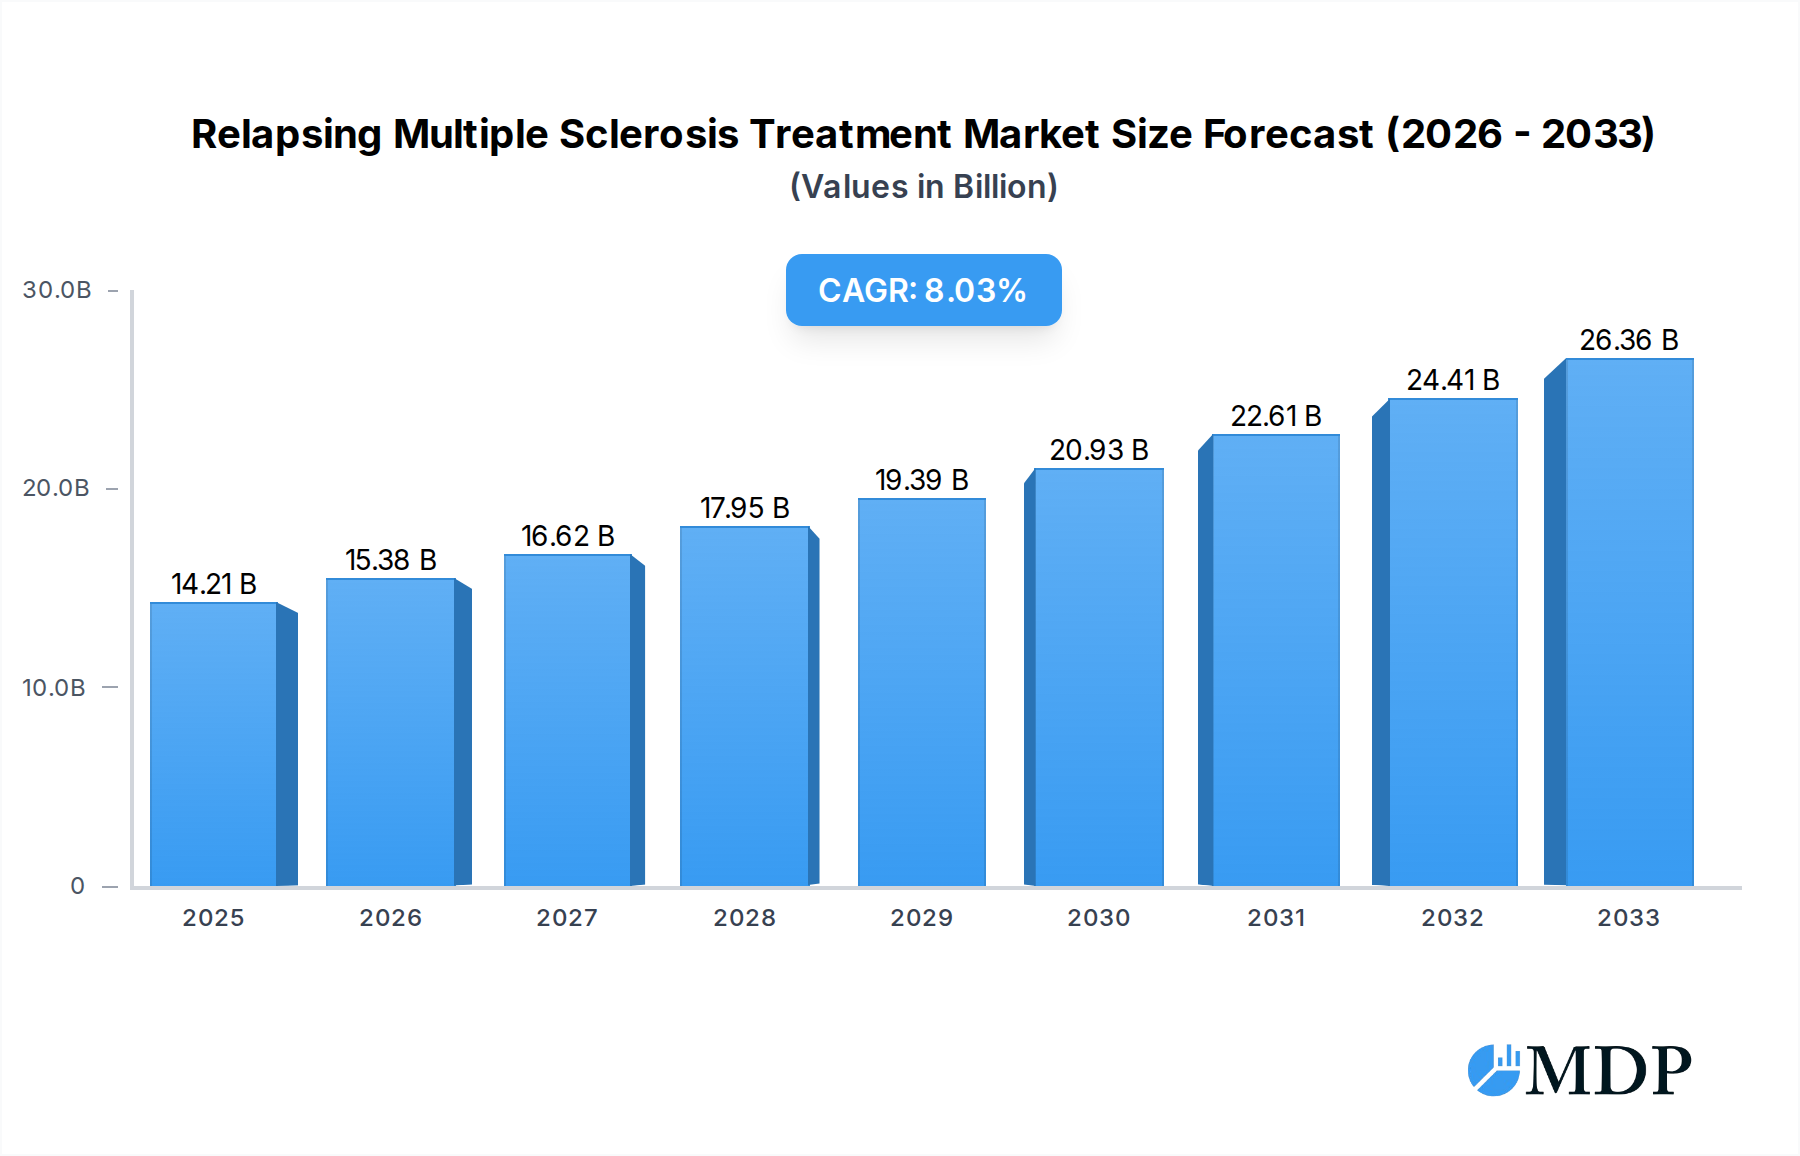
Relapsing Multiple Sclerosis Treatment Market Size (In Billion)
The RMS Treatment market is characterized by a diverse range of applications and therapeutic types. Hospital pharmacies and retail pharmacies represent the dominant distribution channels, reflecting the current healthcare delivery model for chronic condition management. However, the burgeoning online store segment signifies a growing shift towards digital health solutions and direct-to-consumer accessibility for certain treatments. Therapeutically, the market is segmented into immunomodulatory, immunosuppressive, and interferon-based treatments, with a growing segment of "Others" indicating the emergence of novel mechanisms of action. Key industry players such as Pfizer, Merck & Co., Teva Pharmaceutical, Sanofi, and Roche are actively engaged in the development and marketing of advanced RMS treatments, contributing to market competition and innovation. Geographic expansion is evident across North America, Europe, and Asia Pacific, with each region presenting unique growth opportunities driven by varying healthcare policies, patient demographics, and the adoption of new treatment modalities.

Relapsing Multiple Sclerosis Treatment Company Market Share
This in-depth report provides a panoramic view of the Relapsing Multiple Sclerosis (RMS) treatment market, offering critical insights for industry stakeholders. Covering the historical period from 2019 to 2024 and projecting growth through 2033, with a base year of 2025, this analysis delves into market dynamics, trends, leading segments, product innovations, growth drivers, challenges, and emerging opportunities. With an estimated market size of x billion in 2025 and a projected Compound Annual Growth Rate (CAGR) of x% during the forecast period, this report is an indispensable tool for understanding the evolving landscape of RMS treatment.
Relapsing Multiple Sclerosis Treatment Market Dynamics & Concentration
The Relapsing Multiple Sclerosis treatment market exhibits a moderate to high concentration, with key players like Biogen, Roche, and Novartis holding significant market shares. Innovation remains a primary driver, fueled by ongoing research into novel therapeutic targets and advanced drug delivery systems aimed at improving efficacy and patient adherence. Regulatory frameworks, particularly those managed by agencies like the FDA and EMA, play a crucial role in shaping market access and product approvals. The presence of product substitutes, including generic alternatives to older immunomodulatory drugs, exerts pricing pressure. End-user trends show a growing preference for injectable and oral therapies due to convenience and reduced side effects. Mergers and acquisitions (M&A) activities, with approximately x major deals recorded during the historical period, continue to consolidate the market and foster synergistic advancements. The market share for key companies is estimated to be: Pfizer – x%, Merck & Co – x%, Teva Pharmaceutical – x%, Sanofi – x%, Bayer – x%, Biogen – x%, Roche – x%, Novartis – x%, CinnaGen – x%, Mylan – x%, Bristol-Myers Squibb – x%, Janssen Pharmaceuticals – x%, Acorda Therapeutics – x%.
Relapsing Multiple Sclerosis Treatment Industry Trends & Analysis
The Relapsing Multiple Sclerosis treatment industry is experiencing robust growth, propelled by an increasing prevalence of the disease globally and a greater understanding of its underlying pathophysiology. Market growth drivers include significant investments in research and development, leading to the introduction of more effective and targeted therapies. Technological disruptions, such as the advancement of biosimilars and the exploration of gene therapies, are reshaping the treatment paradigm. Consumer preferences are evolving towards treatments that offer improved quality of life, reduced disease progression, and fewer side effects, leading to a demand for highly personalized therapeutic approaches. Competitive dynamics are intense, characterized by strategic collaborations, patent expiries, and the continuous launch of innovative drugs. The market penetration of disease-modifying therapies (DMTs) is projected to increase significantly, reaching an estimated x% by 2033. The market size, projected to reach x billion by 2025, is driven by factors such as improved diagnostic capabilities and a growing awareness among healthcare providers and patients regarding early intervention. The increasing adoption of biosimilars is also contributing to market expansion by making advanced treatments more accessible. Furthermore, the development of novel formulations and delivery methods is enhancing patient compliance, a critical factor in long-term RMS management. The integration of digital health tools for patient monitoring and management is also a burgeoning trend, promising to enhance treatment outcomes and streamline healthcare delivery.
Leading Markets & Segments in Relapsing Multiple Sclerosis Treatment
The Hospital Pharmacy segment is the dominant application in the Relapsing Multiple Sclerosis treatment market, accounting for an estimated x% of the total market value in 2025. This dominance is attributed to the complex nature of RMS management, often requiring specialized care, infusion therapies, and close monitoring typically provided in hospital settings. The Immunomodulatory type of treatment holds the largest market share, estimated at x% in 2025, due to its established efficacy and broad patient acceptance as a first-line therapy.
Key drivers for the dominance of Hospital Pharmacy include:
- Specialized Care Infrastructure: Hospitals offer the necessary infrastructure for administering complex DMTs, including intravenous infusions and monitoring for potential adverse effects.
- Diagnostic and Treatment Expertise: Neurological centers within hospitals provide specialized diagnostic services and multidisciplinary teams essential for comprehensive RMS management.
- Reimbursement Policies: Insurance coverage and reimbursement structures often favor hospital-administered treatments for high-cost therapies.
The United States represents the leading country in terms of market value and penetration, driven by a high incidence of MS, advanced healthcare infrastructure, and significant R&D investments. Economic policies supporting pharmaceutical innovation and robust healthcare spending contribute to this leadership.
The Immunosuppressive treatment segment is also witnessing substantial growth, driven by the development of newer agents with improved safety profiles and targeted mechanisms of action, capturing an estimated x% of the market in 2025. Interferons, while foundational, are gradually seeing their market share shift towards newer modalities, but still represent a significant segment at x%.
Relapsing Multiple Sclerosis Treatment Product Developments
Recent product developments in Relapsing Multiple Sclerosis treatment are focused on enhancing efficacy, improving safety profiles, and offering more convenient administration routes. Innovations include the introduction of oral DMTs, reducing the need for injections, and the development of biosimilars for existing biologics, increasing accessibility. Targeted therapies that modulate specific immune pathways are showing promising results in clinical trials, aiming to achieve greater disease control with fewer systemic side effects. These advancements are crucial for improving patient quality of life and managing disease progression more effectively, creating significant market fit for novel solutions.
Key Drivers of Relapsing Multiple Sclerosis Treatment Growth
The Relapsing Multiple Sclerosis treatment market is primarily driven by several key factors. Technological advancements in understanding the disease pathology have led to the development of targeted therapies, including novel oral and injectable disease-modifying therapies (DMTs). Increasing global prevalence and incidence rates of MS, coupled with improved diagnostic capabilities, contribute to a larger patient pool seeking treatment. Furthermore, favorable reimbursement policies and growing healthcare expenditure in developed and emerging economies facilitate access to advanced treatments. The growing emphasis on early intervention and personalized medicine also fuels the demand for a wider array of effective therapeutic options.
Challenges in the Relapsing Multiple Sclerosis Treatment Market
Despite promising growth, the Relapsing Multiple Sclerosis treatment market faces significant challenges. High treatment costs associated with novel therapies pose a barrier to accessibility for many patients and healthcare systems, estimated to increase overall healthcare burden by x%. Stringent regulatory approval processes can delay the market entry of innovative drugs. Complex supply chain logistics for biologic treatments and the increasing competition from biosimilars can impact pricing and market share for originator products. Furthermore, patient adherence issues, stemming from side effects or complex administration regimens, remain a persistent challenge that can limit treatment efficacy.
Emerging Opportunities in Relapsing Multiple Sclerosis Treatment
Emerging opportunities in the Relapsing Multiple Sclerosis treatment market are abundant, driven by unmet clinical needs and technological breakthroughs. The development of remyelination therapies and neuroprotective agents represents a significant frontier for disease modification beyond immunosuppression. Strategic partnerships between pharmaceutical companies and academic institutions are accelerating the discovery of novel therapeutic targets. The expansion of telemedicine and digital health solutions offers new avenues for remote patient monitoring and support, enhancing treatment adherence and physician oversight. Furthermore, the growing focus on precision medicine and the identification of specific biomarkers to guide treatment selection presents a substantial opportunity for personalized therapeutic strategies.
Leading Players in the Relapsing Multiple Sclerosis Treatment Sector
- Pfizer
- Merck & Co
- Teva Pharmaceutical
- Sanofi
- Bayer
- Biogen
- Roche
- Novartis
- CinnaGen
- Mylan
- Bristol-Myers Squibb
- Janssen Pharmaceuticals
- Acorda Therapeutics
Key Milestones in Relapsing Multiple Sclerosis Treatment Industry
- 2019/05: Approval of a new oral DMT, expanding treatment options.
- 2020/11: Major pharmaceutical company announces significant investment in RMS research.
- 2021/03: FDA approves a novel injectable therapy with improved efficacy data.
- 2022/07: Biogen acquires a biotech firm specializing in neurodegenerative diseases.
- 2023/01: Launch of the first biosimilar for a leading RMS treatment.
- 2024/08: Phase 3 clinical trial results for a potential remyelination therapy show promising outcomes.
Strategic Outlook for Relapsing Multiple Sclerosis Treatment Market
The strategic outlook for the Relapsing Multiple Sclerosis treatment market is overwhelmingly positive, driven by continuous innovation and increasing market penetration. The focus will remain on developing therapies that offer superior efficacy, improved safety profiles, and enhanced patient convenience. Strategic opportunities lie in the expansion of oral therapies, the advancement of personalized medicine through biomarker identification, and the exploration of neuroprotective and remyelination strategies. Partnerships for clinical development and market access, along with the leveraging of digital health technologies for patient management, will be crucial for sustained growth and capturing a larger share of the estimated x billion market by 2033.
Relapsing Multiple Sclerosis Treatment Segmentation
-
1. Application
- 1.1. Hospital Pharmacy
- 1.2. Retail Pharmacy
- 1.3. Online Stores
-
2. Types
- 2.1. Immunomodulatory
- 2.2. Immunosuppressive
- 2.3. Interferons
- 2.4. Others
Relapsing Multiple Sclerosis Treatment Segmentation By Geography
-
1. North America
- 1.1. United States
- 1.2. Canada
- 1.3. Mexico
-
2. South America
- 2.1. Brazil
- 2.2. Argentina
- 2.3. Rest of South America
-
3. Europe
- 3.1. United Kingdom
- 3.2. Germany
- 3.3. France
- 3.4. Italy
- 3.5. Spain
- 3.6. Russia
- 3.7. Benelux
- 3.8. Nordics
- 3.9. Rest of Europe
-
4. Middle East & Africa
- 4.1. Turkey
- 4.2. Israel
- 4.3. GCC
- 4.4. North Africa
- 4.5. South Africa
- 4.6. Rest of Middle East & Africa
-
5. Asia Pacific
- 5.1. China
- 5.2. India
- 5.3. Japan
- 5.4. South Korea
- 5.5. ASEAN
- 5.6. Oceania
- 5.7. Rest of Asia Pacific
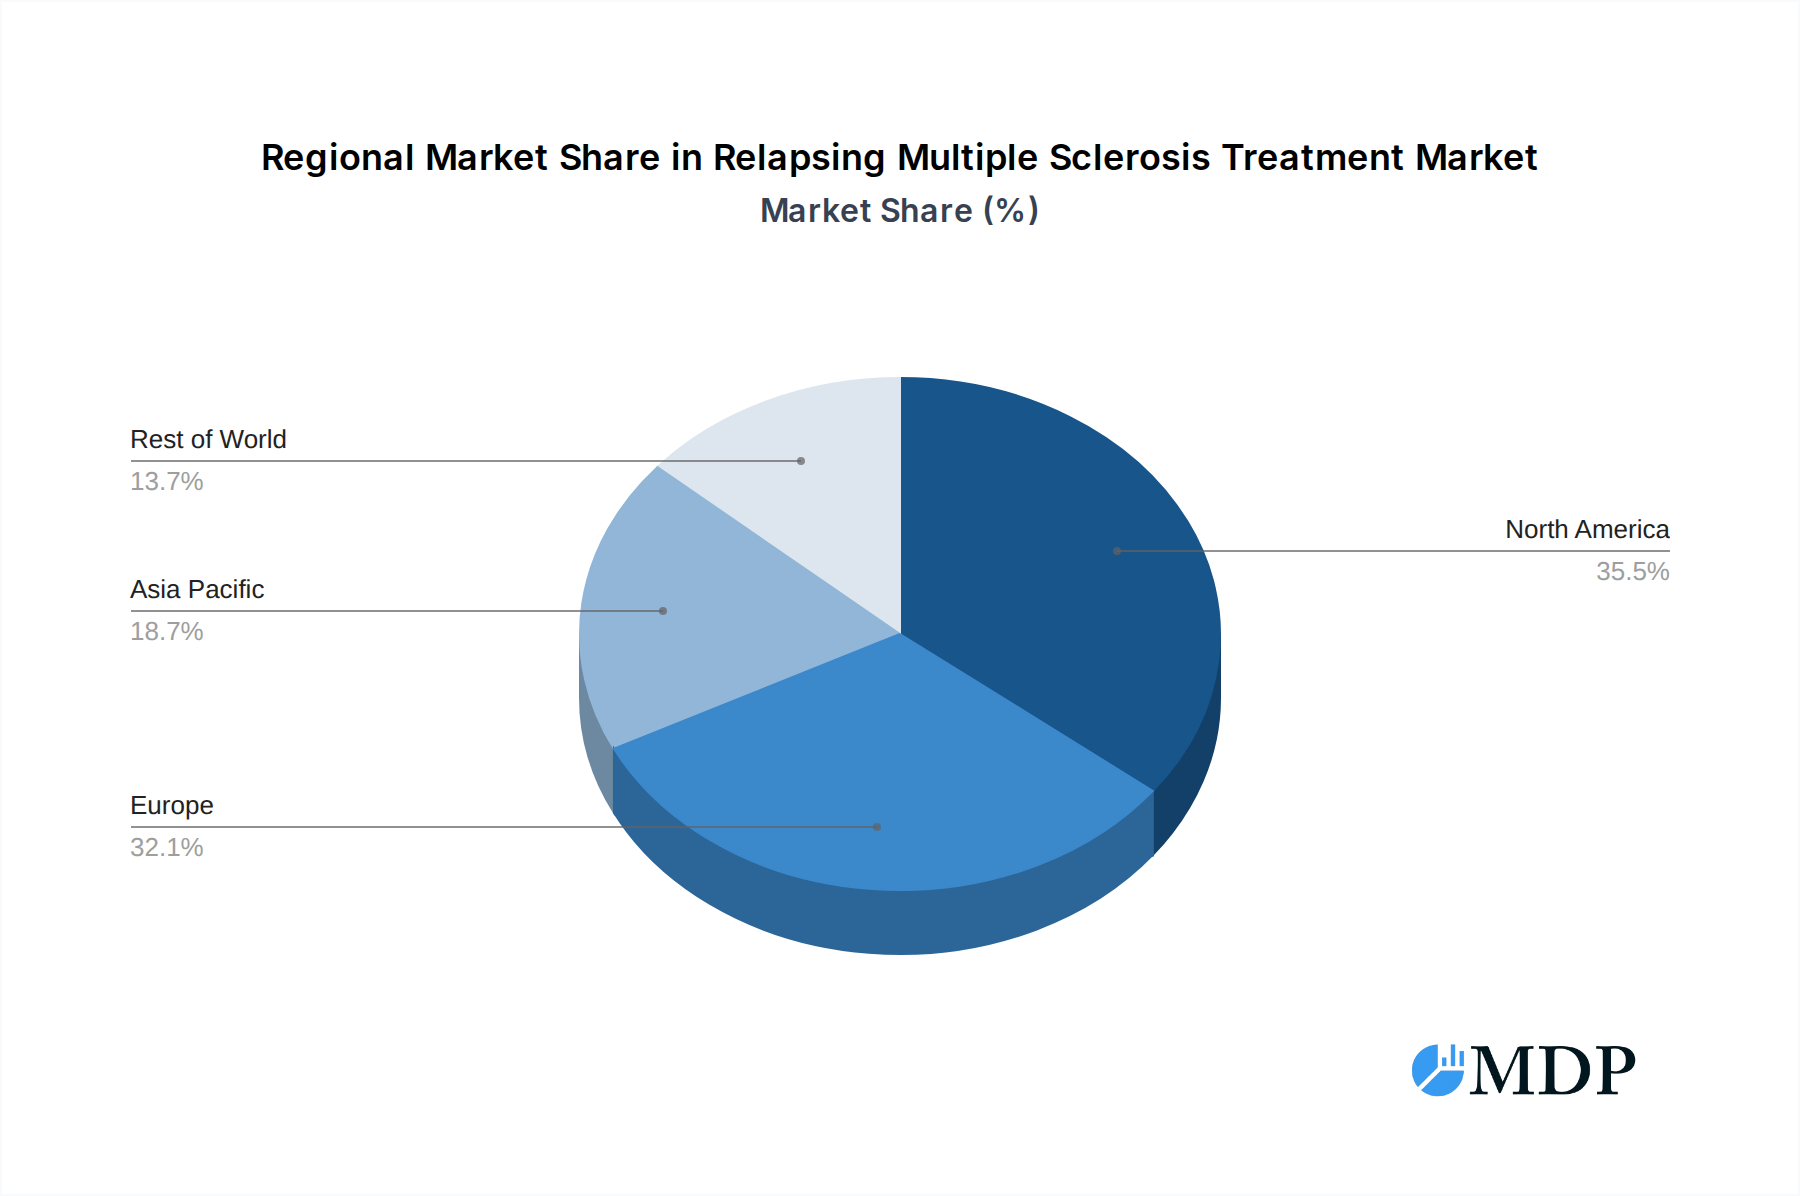
Relapsing Multiple Sclerosis Treatment Regional Market Share
Geographic Coverage of Relapsing Multiple Sclerosis Treatment
Relapsing Multiple Sclerosis Treatment REPORT HIGHLIGHTS
| Aspects | Details |
|---|---|
| Study Period | 2020-2034 |
| Base Year | 2025 |
| Estimated Year | 2026 |
| Forecast Period | 2026-2034 |
| Historical Period | 2020-2025 |
| Growth Rate | CAGR of 8.4% from 2020-2034 |
| Segmentation |
|
Table of Contents
- 1. Introduction
- 1.1. Research Scope
- 1.2. Market Segmentation
- 1.3. Research Methodology
- 1.4. Definitions and Assumptions
- 2. Executive Summary
- 2.1. Introduction
- 3. Market Dynamics
- 3.1. Introduction
- 3.2. Market Drivers
- 3.3. Market Restrains
- 3.4. Market Trends
- 4. Market Factor Analysis
- 4.1. Porters Five Forces
- 4.2. Supply/Value Chain
- 4.3. PESTEL analysis
- 4.4. Market Entropy
- 4.5. Patent/Trademark Analysis
- 5. Global Relapsing Multiple Sclerosis Treatment Analysis, Insights and Forecast, 2020-2032
- 5.1. Market Analysis, Insights and Forecast - by Application
- 5.1.1. Hospital Pharmacy
- 5.1.2. Retail Pharmacy
- 5.1.3. Online Stores
- 5.2. Market Analysis, Insights and Forecast - by Types
- 5.2.1. Immunomodulatory
- 5.2.2. Immunosuppressive
- 5.2.3. Interferons
- 5.2.4. Others
- 5.3. Market Analysis, Insights and Forecast - by Region
- 5.3.1. North America
- 5.3.2. South America
- 5.3.3. Europe
- 5.3.4. Middle East & Africa
- 5.3.5. Asia Pacific
- 5.1. Market Analysis, Insights and Forecast - by Application
- 6. North America Relapsing Multiple Sclerosis Treatment Analysis, Insights and Forecast, 2020-2032
- 6.1. Market Analysis, Insights and Forecast - by Application
- 6.1.1. Hospital Pharmacy
- 6.1.2. Retail Pharmacy
- 6.1.3. Online Stores
- 6.2. Market Analysis, Insights and Forecast - by Types
- 6.2.1. Immunomodulatory
- 6.2.2. Immunosuppressive
- 6.2.3. Interferons
- 6.2.4. Others
- 6.1. Market Analysis, Insights and Forecast - by Application
- 7. South America Relapsing Multiple Sclerosis Treatment Analysis, Insights and Forecast, 2020-2032
- 7.1. Market Analysis, Insights and Forecast - by Application
- 7.1.1. Hospital Pharmacy
- 7.1.2. Retail Pharmacy
- 7.1.3. Online Stores
- 7.2. Market Analysis, Insights and Forecast - by Types
- 7.2.1. Immunomodulatory
- 7.2.2. Immunosuppressive
- 7.2.3. Interferons
- 7.2.4. Others
- 7.1. Market Analysis, Insights and Forecast - by Application
- 8. Europe Relapsing Multiple Sclerosis Treatment Analysis, Insights and Forecast, 2020-2032
- 8.1. Market Analysis, Insights and Forecast - by Application
- 8.1.1. Hospital Pharmacy
- 8.1.2. Retail Pharmacy
- 8.1.3. Online Stores
- 8.2. Market Analysis, Insights and Forecast - by Types
- 8.2.1. Immunomodulatory
- 8.2.2. Immunosuppressive
- 8.2.3. Interferons
- 8.2.4. Others
- 8.1. Market Analysis, Insights and Forecast - by Application
- 9. Middle East & Africa Relapsing Multiple Sclerosis Treatment Analysis, Insights and Forecast, 2020-2032
- 9.1. Market Analysis, Insights and Forecast - by Application
- 9.1.1. Hospital Pharmacy
- 9.1.2. Retail Pharmacy
- 9.1.3. Online Stores
- 9.2. Market Analysis, Insights and Forecast - by Types
- 9.2.1. Immunomodulatory
- 9.2.2. Immunosuppressive
- 9.2.3. Interferons
- 9.2.4. Others
- 9.1. Market Analysis, Insights and Forecast - by Application
- 10. Asia Pacific Relapsing Multiple Sclerosis Treatment Analysis, Insights and Forecast, 2020-2032
- 10.1. Market Analysis, Insights and Forecast - by Application
- 10.1.1. Hospital Pharmacy
- 10.1.2. Retail Pharmacy
- 10.1.3. Online Stores
- 10.2. Market Analysis, Insights and Forecast - by Types
- 10.2.1. Immunomodulatory
- 10.2.2. Immunosuppressive
- 10.2.3. Interferons
- 10.2.4. Others
- 10.1. Market Analysis, Insights and Forecast - by Application
- 11. Competitive Analysis
- 11.1. Global Market Share Analysis 2025
- 11.2. Company Profiles
- 11.2.1 Pfizer
- 11.2.1.1. Overview
- 11.2.1.2. Products
- 11.2.1.3. SWOT Analysis
- 11.2.1.4. Recent Developments
- 11.2.1.5. Financials (Based on Availability)
- 11.2.2 Merck & Co
- 11.2.2.1. Overview
- 11.2.2.2. Products
- 11.2.2.3. SWOT Analysis
- 11.2.2.4. Recent Developments
- 11.2.2.5. Financials (Based on Availability)
- 11.2.3 Teva Pharmaceutical
- 11.2.3.1. Overview
- 11.2.3.2. Products
- 11.2.3.3. SWOT Analysis
- 11.2.3.4. Recent Developments
- 11.2.3.5. Financials (Based on Availability)
- 11.2.4 Sanofi
- 11.2.4.1. Overview
- 11.2.4.2. Products
- 11.2.4.3. SWOT Analysis
- 11.2.4.4. Recent Developments
- 11.2.4.5. Financials (Based on Availability)
- 11.2.5 Bayer
- 11.2.5.1. Overview
- 11.2.5.2. Products
- 11.2.5.3. SWOT Analysis
- 11.2.5.4. Recent Developments
- 11.2.5.5. Financials (Based on Availability)
- 11.2.6 Biogen
- 11.2.6.1. Overview
- 11.2.6.2. Products
- 11.2.6.3. SWOT Analysis
- 11.2.6.4. Recent Developments
- 11.2.6.5. Financials (Based on Availability)
- 11.2.7 Roche
- 11.2.7.1. Overview
- 11.2.7.2. Products
- 11.2.7.3. SWOT Analysis
- 11.2.7.4. Recent Developments
- 11.2.7.5. Financials (Based on Availability)
- 11.2.8 Novartis
- 11.2.8.1. Overview
- 11.2.8.2. Products
- 11.2.8.3. SWOT Analysis
- 11.2.8.4. Recent Developments
- 11.2.8.5. Financials (Based on Availability)
- 11.2.9 CinnaGen
- 11.2.9.1. Overview
- 11.2.9.2. Products
- 11.2.9.3. SWOT Analysis
- 11.2.9.4. Recent Developments
- 11.2.9.5. Financials (Based on Availability)
- 11.2.10 Mylan
- 11.2.10.1. Overview
- 11.2.10.2. Products
- 11.2.10.3. SWOT Analysis
- 11.2.10.4. Recent Developments
- 11.2.10.5. Financials (Based on Availability)
- 11.2.11 Bristol-Myers Squibb
- 11.2.11.1. Overview
- 11.2.11.2. Products
- 11.2.11.3. SWOT Analysis
- 11.2.11.4. Recent Developments
- 11.2.11.5. Financials (Based on Availability)
- 11.2.12 Janssen Pharmaceuticals
- 11.2.12.1. Overview
- 11.2.12.2. Products
- 11.2.12.3. SWOT Analysis
- 11.2.12.4. Recent Developments
- 11.2.12.5. Financials (Based on Availability)
- 11.2.13 Acorda Therapeutics
- 11.2.13.1. Overview
- 11.2.13.2. Products
- 11.2.13.3. SWOT Analysis
- 11.2.13.4. Recent Developments
- 11.2.13.5. Financials (Based on Availability)
- 11.2.1 Pfizer
List of Figures
- Figure 1: Global Relapsing Multiple Sclerosis Treatment Revenue Breakdown (billion, %) by Region 2025 & 2033
- Figure 2: North America Relapsing Multiple Sclerosis Treatment Revenue (billion), by Application 2025 & 2033
- Figure 3: North America Relapsing Multiple Sclerosis Treatment Revenue Share (%), by Application 2025 & 2033
- Figure 4: North America Relapsing Multiple Sclerosis Treatment Revenue (billion), by Types 2025 & 2033
- Figure 5: North America Relapsing Multiple Sclerosis Treatment Revenue Share (%), by Types 2025 & 2033
- Figure 6: North America Relapsing Multiple Sclerosis Treatment Revenue (billion), by Country 2025 & 2033
- Figure 7: North America Relapsing Multiple Sclerosis Treatment Revenue Share (%), by Country 2025 & 2033
- Figure 8: South America Relapsing Multiple Sclerosis Treatment Revenue (billion), by Application 2025 & 2033
- Figure 9: South America Relapsing Multiple Sclerosis Treatment Revenue Share (%), by Application 2025 & 2033
- Figure 10: South America Relapsing Multiple Sclerosis Treatment Revenue (billion), by Types 2025 & 2033
- Figure 11: South America Relapsing Multiple Sclerosis Treatment Revenue Share (%), by Types 2025 & 2033
- Figure 12: South America Relapsing Multiple Sclerosis Treatment Revenue (billion), by Country 2025 & 2033
- Figure 13: South America Relapsing Multiple Sclerosis Treatment Revenue Share (%), by Country 2025 & 2033
- Figure 14: Europe Relapsing Multiple Sclerosis Treatment Revenue (billion), by Application 2025 & 2033
- Figure 15: Europe Relapsing Multiple Sclerosis Treatment Revenue Share (%), by Application 2025 & 2033
- Figure 16: Europe Relapsing Multiple Sclerosis Treatment Revenue (billion), by Types 2025 & 2033
- Figure 17: Europe Relapsing Multiple Sclerosis Treatment Revenue Share (%), by Types 2025 & 2033
- Figure 18: Europe Relapsing Multiple Sclerosis Treatment Revenue (billion), by Country 2025 & 2033
- Figure 19: Europe Relapsing Multiple Sclerosis Treatment Revenue Share (%), by Country 2025 & 2033
- Figure 20: Middle East & Africa Relapsing Multiple Sclerosis Treatment Revenue (billion), by Application 2025 & 2033
- Figure 21: Middle East & Africa Relapsing Multiple Sclerosis Treatment Revenue Share (%), by Application 2025 & 2033
- Figure 22: Middle East & Africa Relapsing Multiple Sclerosis Treatment Revenue (billion), by Types 2025 & 2033
- Figure 23: Middle East & Africa Relapsing Multiple Sclerosis Treatment Revenue Share (%), by Types 2025 & 2033
- Figure 24: Middle East & Africa Relapsing Multiple Sclerosis Treatment Revenue (billion), by Country 2025 & 2033
- Figure 25: Middle East & Africa Relapsing Multiple Sclerosis Treatment Revenue Share (%), by Country 2025 & 2033
- Figure 26: Asia Pacific Relapsing Multiple Sclerosis Treatment Revenue (billion), by Application 2025 & 2033
- Figure 27: Asia Pacific Relapsing Multiple Sclerosis Treatment Revenue Share (%), by Application 2025 & 2033
- Figure 28: Asia Pacific Relapsing Multiple Sclerosis Treatment Revenue (billion), by Types 2025 & 2033
- Figure 29: Asia Pacific Relapsing Multiple Sclerosis Treatment Revenue Share (%), by Types 2025 & 2033
- Figure 30: Asia Pacific Relapsing Multiple Sclerosis Treatment Revenue (billion), by Country 2025 & 2033
- Figure 31: Asia Pacific Relapsing Multiple Sclerosis Treatment Revenue Share (%), by Country 2025 & 2033
List of Tables
- Table 1: Global Relapsing Multiple Sclerosis Treatment Revenue billion Forecast, by Application 2020 & 2033
- Table 2: Global Relapsing Multiple Sclerosis Treatment Revenue billion Forecast, by Types 2020 & 2033
- Table 3: Global Relapsing Multiple Sclerosis Treatment Revenue billion Forecast, by Region 2020 & 2033
- Table 4: Global Relapsing Multiple Sclerosis Treatment Revenue billion Forecast, by Application 2020 & 2033
- Table 5: Global Relapsing Multiple Sclerosis Treatment Revenue billion Forecast, by Types 2020 & 2033
- Table 6: Global Relapsing Multiple Sclerosis Treatment Revenue billion Forecast, by Country 2020 & 2033
- Table 7: United States Relapsing Multiple Sclerosis Treatment Revenue (billion) Forecast, by Application 2020 & 2033
- Table 8: Canada Relapsing Multiple Sclerosis Treatment Revenue (billion) Forecast, by Application 2020 & 2033
- Table 9: Mexico Relapsing Multiple Sclerosis Treatment Revenue (billion) Forecast, by Application 2020 & 2033
- Table 10: Global Relapsing Multiple Sclerosis Treatment Revenue billion Forecast, by Application 2020 & 2033
- Table 11: Global Relapsing Multiple Sclerosis Treatment Revenue billion Forecast, by Types 2020 & 2033
- Table 12: Global Relapsing Multiple Sclerosis Treatment Revenue billion Forecast, by Country 2020 & 2033
- Table 13: Brazil Relapsing Multiple Sclerosis Treatment Revenue (billion) Forecast, by Application 2020 & 2033
- Table 14: Argentina Relapsing Multiple Sclerosis Treatment Revenue (billion) Forecast, by Application 2020 & 2033
- Table 15: Rest of South America Relapsing Multiple Sclerosis Treatment Revenue (billion) Forecast, by Application 2020 & 2033
- Table 16: Global Relapsing Multiple Sclerosis Treatment Revenue billion Forecast, by Application 2020 & 2033
- Table 17: Global Relapsing Multiple Sclerosis Treatment Revenue billion Forecast, by Types 2020 & 2033
- Table 18: Global Relapsing Multiple Sclerosis Treatment Revenue billion Forecast, by Country 2020 & 2033
- Table 19: United Kingdom Relapsing Multiple Sclerosis Treatment Revenue (billion) Forecast, by Application 2020 & 2033
- Table 20: Germany Relapsing Multiple Sclerosis Treatment Revenue (billion) Forecast, by Application 2020 & 2033
- Table 21: France Relapsing Multiple Sclerosis Treatment Revenue (billion) Forecast, by Application 2020 & 2033
- Table 22: Italy Relapsing Multiple Sclerosis Treatment Revenue (billion) Forecast, by Application 2020 & 2033
- Table 23: Spain Relapsing Multiple Sclerosis Treatment Revenue (billion) Forecast, by Application 2020 & 2033
- Table 24: Russia Relapsing Multiple Sclerosis Treatment Revenue (billion) Forecast, by Application 2020 & 2033
- Table 25: Benelux Relapsing Multiple Sclerosis Treatment Revenue (billion) Forecast, by Application 2020 & 2033
- Table 26: Nordics Relapsing Multiple Sclerosis Treatment Revenue (billion) Forecast, by Application 2020 & 2033
- Table 27: Rest of Europe Relapsing Multiple Sclerosis Treatment Revenue (billion) Forecast, by Application 2020 & 2033
- Table 28: Global Relapsing Multiple Sclerosis Treatment Revenue billion Forecast, by Application 2020 & 2033
- Table 29: Global Relapsing Multiple Sclerosis Treatment Revenue billion Forecast, by Types 2020 & 2033
- Table 30: Global Relapsing Multiple Sclerosis Treatment Revenue billion Forecast, by Country 2020 & 2033
- Table 31: Turkey Relapsing Multiple Sclerosis Treatment Revenue (billion) Forecast, by Application 2020 & 2033
- Table 32: Israel Relapsing Multiple Sclerosis Treatment Revenue (billion) Forecast, by Application 2020 & 2033
- Table 33: GCC Relapsing Multiple Sclerosis Treatment Revenue (billion) Forecast, by Application 2020 & 2033
- Table 34: North Africa Relapsing Multiple Sclerosis Treatment Revenue (billion) Forecast, by Application 2020 & 2033
- Table 35: South Africa Relapsing Multiple Sclerosis Treatment Revenue (billion) Forecast, by Application 2020 & 2033
- Table 36: Rest of Middle East & Africa Relapsing Multiple Sclerosis Treatment Revenue (billion) Forecast, by Application 2020 & 2033
- Table 37: Global Relapsing Multiple Sclerosis Treatment Revenue billion Forecast, by Application 2020 & 2033
- Table 38: Global Relapsing Multiple Sclerosis Treatment Revenue billion Forecast, by Types 2020 & 2033
- Table 39: Global Relapsing Multiple Sclerosis Treatment Revenue billion Forecast, by Country 2020 & 2033
- Table 40: China Relapsing Multiple Sclerosis Treatment Revenue (billion) Forecast, by Application 2020 & 2033
- Table 41: India Relapsing Multiple Sclerosis Treatment Revenue (billion) Forecast, by Application 2020 & 2033
- Table 42: Japan Relapsing Multiple Sclerosis Treatment Revenue (billion) Forecast, by Application 2020 & 2033
- Table 43: South Korea Relapsing Multiple Sclerosis Treatment Revenue (billion) Forecast, by Application 2020 & 2033
- Table 44: ASEAN Relapsing Multiple Sclerosis Treatment Revenue (billion) Forecast, by Application 2020 & 2033
- Table 45: Oceania Relapsing Multiple Sclerosis Treatment Revenue (billion) Forecast, by Application 2020 & 2033
- Table 46: Rest of Asia Pacific Relapsing Multiple Sclerosis Treatment Revenue (billion) Forecast, by Application 2020 & 2033
Frequently Asked Questions
1. What is the projected Compound Annual Growth Rate (CAGR) of the Relapsing Multiple Sclerosis Treatment?
The projected CAGR is approximately 8.4%.
2. Which companies are prominent players in the Relapsing Multiple Sclerosis Treatment?
Key companies in the market include Pfizer, Merck & Co, Teva Pharmaceutical, Sanofi, Bayer, Biogen, Roche, Novartis, CinnaGen, Mylan, Bristol-Myers Squibb, Janssen Pharmaceuticals, Acorda Therapeutics.
3. What are the main segments of the Relapsing Multiple Sclerosis Treatment?
The market segments include Application, Types.
4. Can you provide details about the market size?
The market size is estimated to be USD 14.21 billion as of 2022.
5. What are some drivers contributing to market growth?
N/A
6. What are the notable trends driving market growth?
N/A
7. Are there any restraints impacting market growth?
N/A
8. Can you provide examples of recent developments in the market?
N/A
9. What pricing options are available for accessing the report?
Pricing options include single-user, multi-user, and enterprise licenses priced at USD 5600.00, USD 8400.00, and USD 11200.00 respectively.
10. Is the market size provided in terms of value or volume?
The market size is provided in terms of value, measured in billion.
11. Are there any specific market keywords associated with the report?
Yes, the market keyword associated with the report is "Relapsing Multiple Sclerosis Treatment," which aids in identifying and referencing the specific market segment covered.
12. How do I determine which pricing option suits my needs best?
The pricing options vary based on user requirements and access needs. Individual users may opt for single-user licenses, while businesses requiring broader access may choose multi-user or enterprise licenses for cost-effective access to the report.
13. Are there any additional resources or data provided in the Relapsing Multiple Sclerosis Treatment report?
While the report offers comprehensive insights, it's advisable to review the specific contents or supplementary materials provided to ascertain if additional resources or data are available.
14. How can I stay updated on further developments or reports in the Relapsing Multiple Sclerosis Treatment?
To stay informed about further developments, trends, and reports in the Relapsing Multiple Sclerosis Treatment, consider subscribing to industry newsletters, following relevant companies and organizations, or regularly checking reputable industry news sources and publications.
Methodology
Step 1 - Identification of Relevant Samples Size from Population Database


Step 2 - Approaches for Defining Global Market Size (Value, Volume* & Price*)

Note*: In applicable scenarios
Step 3 - Data Sources
Primary Research
- Web Analytics
- Survey Reports
- Research Institute
- Latest Research Reports
- Opinion Leaders
Secondary Research
- Annual Reports
- White Paper
- Latest Press Release
- Industry Association
- Paid Database
- Investor Presentations

Step 4 - Data Triangulation
Involves using different sources of information in order to increase the validity of a study
These sources are likely to be stakeholders in a program - participants, other researchers, program staff, other community members, and so on.
Then we put all data in single framework & apply various statistical tools to find out the dynamic on the market.
During the analysis stage, feedback from the stakeholder groups would be compared to determine areas of agreement as well as areas of divergence