

Key Insights
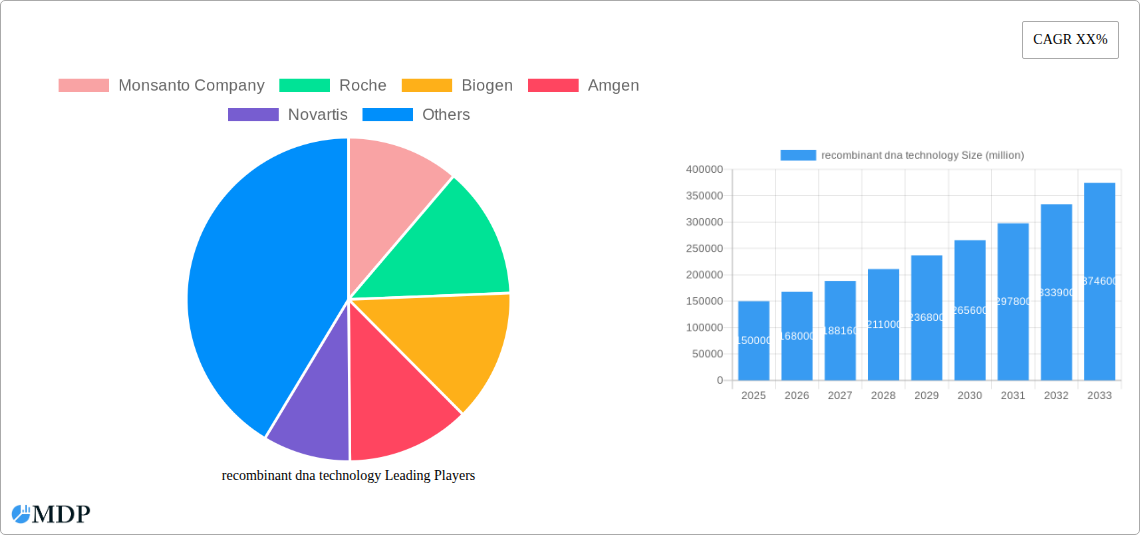
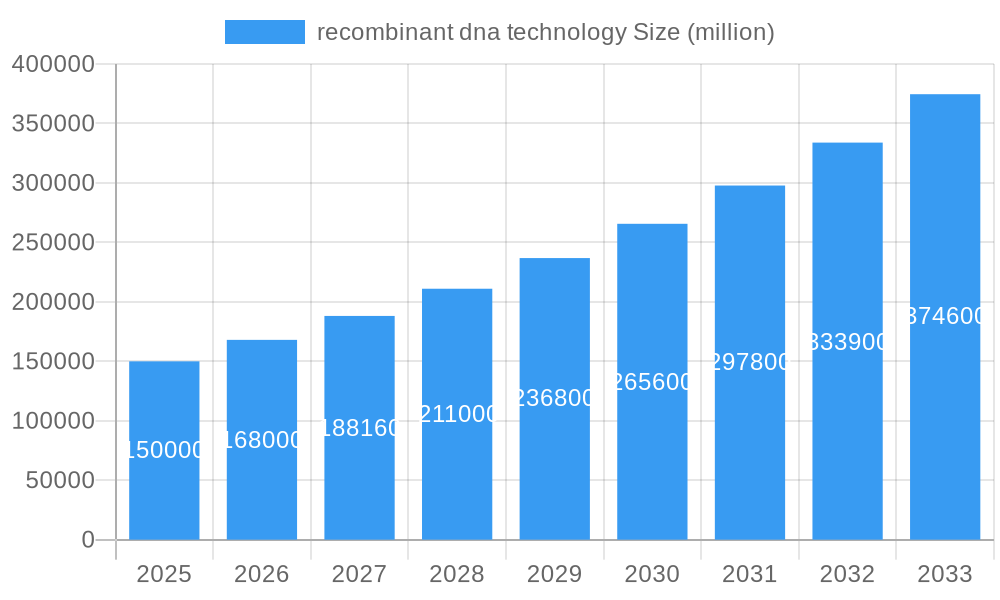
The recombinant DNA technology market is experiencing significant expansion, driven by the surging demand for biopharmaceuticals, advancements in gene therapy, and increased biotechnology R&D. With an estimated market size of $8.76 billion in the base year 2025, the market is projected to achieve a substantial Compound Annual Growth Rate (CAGR) of 13.85% from 2025 to 2033. This growth trajectory is underpinned by several critical drivers. The rising incidence of chronic diseases, including cancer, diabetes, and autoimmune disorders, necessitates innovative and targeted therapeutic solutions, many of which are developed using recombinant DNA technology. Furthermore, breakthroughs in gene editing technologies, such as CRISPR-Cas9, are creating novel opportunities for disease management and prevention, thereby accelerating market development. Continuous investment in research and development by leading pharmaceutical and biotechnology firms also plays a crucial role in fostering innovation and market expansion.
recombinant dna technology Market Size (In Billion)
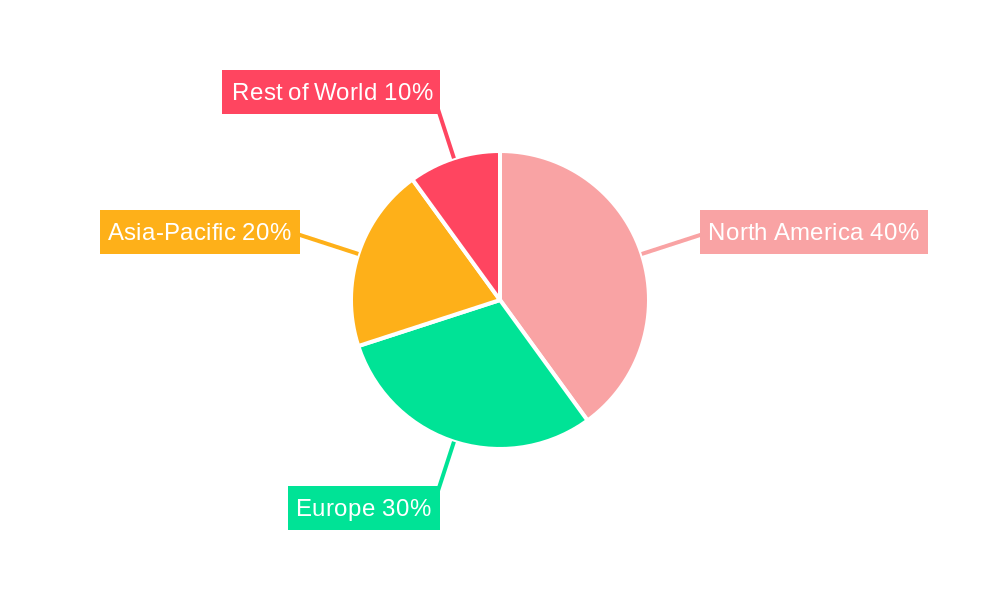
Despite a robust growth outlook, the recombinant DNA technology market encounters certain challenges. Stringent regulatory pathways and lengthy approval processes for novel biopharmaceuticals can impede product introductions. Additionally, the considerable expense associated with the research, development, and production of recombinant DNA-based products may affect patient accessibility and affordability. Nevertheless, the market's overall prospect remains highly positive, fueled by ongoing technological innovations and the escalating need for effective healthcare solutions. The market is diversified across applications (including pharmaceuticals, diagnostics, and agriculture), product types, and geographical regions. While North America and Europe currently dominate market share, the Asia-Pacific region is anticipated to exhibit considerable growth, driven by escalating investments in biotechnology and healthcare infrastructure.
recombinant dna technology Company Market Share
Recombinant DNA Technology Market Report: A Comprehensive Analysis (2019-2033)
This comprehensive report offers an in-depth analysis of the recombinant DNA technology market, providing actionable insights for industry stakeholders. With a study period spanning 2019-2033, a base year of 2025, and a forecast period of 2025-2033, this report unveils the market dynamics, trends, and future potential of this transformative technology. The report projects a market valuation exceeding $XX million by 2033, driven by significant advancements and increasing applications across diverse sectors.
Recombinant DNA Technology Market Dynamics & Concentration
The recombinant DNA technology market is characterized by a moderately concentrated landscape, with a handful of major players commanding significant market share. In 2025, the top five companies – Monsanto Company, Roche, Biogen, Amgen, and Novartis – are estimated to collectively hold approximately xx% of the market. However, the market exhibits substantial dynamism, fueled by continuous innovation, strategic partnerships, and acquisitions.
Innovation Drivers: Advances in gene editing technologies like CRISPR-Cas9, improved vector systems, and high-throughput screening are propelling market growth.
Regulatory Frameworks: Stringent regulatory approvals and guidelines, varying across different regions, pose both challenges and opportunities, impacting market entry and product development timelines.
Product Substitutes: While no direct substitutes exist, alternative technologies, like traditional breeding methods, compete for specific applications, creating a niche market for recombinant DNA products.
End-User Trends: Growing demand for personalized medicine, biopharmaceuticals, and improved agricultural products is driving the adoption of recombinant DNA technology across diverse sectors.
M&A Activities: The historical period (2019-2024) witnessed approximately xx M&A deals in the recombinant DNA technology sector, indicating a trend of consolidation and strategic expansion among major players. This activity is expected to continue throughout the forecast period.
Recombinant DNA Technology Industry Trends & Analysis
The recombinant DNA technology market is poised for robust growth, with a projected CAGR of xx% during the forecast period (2025-2033). This growth is primarily driven by increasing investments in R&D, rising prevalence of chronic diseases driving demand for advanced therapeutics, and growing adoption in agricultural biotechnology. Technological advancements, such as next-generation sequencing and gene synthesis, have significantly reduced costs and improved efficiency, further accelerating market expansion. Market penetration in emerging economies is also expected to increase significantly, contributing to overall growth. The competitive landscape is characterized by intense R&D activities, strategic alliances, and the emergence of innovative startups alongside established industry players. Consumer preferences are shifting towards personalized and more effective therapies, creating lucrative opportunities for advanced recombinant DNA-based products.
Leading Markets & Segments in Recombinant DNA Technology
The North American region is currently the dominant market for recombinant DNA technology, holding approximately xx% of the global market share in 2025. This dominance is attributed to several factors:
- Robust R&D Infrastructure: Significant investment in research and development by both public and private entities.
- Stringent Regulatory Frameworks (but also supportive): While regulations are stringent, they also foster innovation and ensure product safety.
- High Healthcare Expenditure: A substantial healthcare budget facilitates the adoption of cutting-edge technologies like recombinant DNA technology.
- Presence of Major Players: A large concentration of leading companies in the biotechnology and pharmaceutical sectors.
However, the Asia-Pacific region is expected to experience the fastest growth during the forecast period, driven by rapid economic development, increasing healthcare spending, and supportive government initiatives promoting biotechnology innovation.
Recombinant DNA Technology Product Developments
Recent advancements in recombinant DNA technology have resulted in the development of novel biopharmaceuticals, including improved vaccines, therapeutic proteins, and gene therapies. These products offer enhanced efficacy, safety, and targeted delivery compared to traditional therapies. The integration of advanced gene editing technologies, like CRISPR-Cas9, has further revolutionized the field, enabling precise genome modification for disease treatment and agricultural improvements. This technological progress is directly contributing to greater market acceptance and expansion.
Key Drivers of Recombinant DNA Technology Growth
Several factors are fueling the growth of the recombinant DNA technology market. These include:
- Technological Advancements: Continued improvements in gene editing, gene synthesis, and high-throughput screening techniques are reducing costs and enhancing efficiency.
- Economic Incentives: Government grants, tax breaks, and private investments are fostering innovation and accelerating market development.
- Regulatory Approvals: Increased approvals of recombinant DNA-based products across various regulatory bodies are paving the way for wider market adoption.
Challenges in the Recombinant DNA Technology Market
Despite its immense potential, the recombinant DNA technology market faces several challenges:
- Regulatory Hurdles: Stringent regulatory requirements and lengthy approval processes can delay product launches and increase costs.
- Supply Chain Issues: The complexity of manufacturing recombinant DNA-based products can lead to supply chain disruptions and cost escalations.
- Competitive Pressures: Intense competition among established players and emerging startups creates pressure on pricing and profit margins.
Emerging Opportunities in Recombinant DNA Technology
The future of recombinant DNA technology looks promising, with several emerging opportunities driving long-term growth:
The development of novel gene editing tools, expansion into new therapeutic areas such as cancer immunotherapy, and the increasing adoption of personalized medicine strategies are expected to create significant growth opportunities in the coming years. Strategic collaborations between industry players and research institutions will further accelerate innovation and market expansion.
Leading Players in the Recombinant DNA Technology Sector
- Monsanto Company
- Roche
- Biogen
- Amgen
- Novartis
- Eli Lilly and Company
- GenScript
- Pfizer Inc.
- Novo Nordisk
- Sanofi
- Merck KGaA
- Profacgen
- Biocon
- GlaxoSmithKline
- Cibus
- Horizon Discovery Group
- New England Biolabs
Key Milestones in Recombinant DNA Technology Industry
- 2020: Successful clinical trials of a novel CRISPR-based gene therapy for a genetic disorder.
- 2021: Launch of a new recombinant DNA-based agricultural product with enhanced pest resistance.
- 2022: Major pharmaceutical company acquires a leading gene editing technology startup.
- 2023: Approval of a new recombinant DNA-based drug for treating a rare disease.
Strategic Outlook for Recombinant DNA Technology Market
The recombinant DNA technology market is projected to experience substantial growth over the next decade, driven by technological breakthroughs, strategic partnerships, and expanding applications across healthcare and agriculture. Companies with strong R&D capabilities, strategic alliances, and a robust product pipeline are well-positioned to capitalize on the growth opportunities in this dynamic market. The focus on personalized medicine and advanced gene editing technologies will be crucial for future success.
recombinant dna technology Segmentation
-
1. Application
- 1.1. Biotechnology and Pharmaceutical Companies
- 1.2. Academic & Government Research Institutes
- 1.3. Others
-
2. Types
- 2.1. Therapeutic Agent
- 2.2. Vaccine
- 2.3. Biotech Crops
- 2.4. Specialty Chemicals
recombinant dna technology Segmentation By Geography
-
1. North America
- 1.1. United States
- 1.2. Canada
- 1.3. Mexico
-
2. South America
- 2.1. Brazil
- 2.2. Argentina
- 2.3. Rest of South America
-
3. Europe
- 3.1. United Kingdom
- 3.2. Germany
- 3.3. France
- 3.4. Italy
- 3.5. Spain
- 3.6. Russia
- 3.7. Benelux
- 3.8. Nordics
- 3.9. Rest of Europe
-
4. Middle East & Africa
- 4.1. Turkey
- 4.2. Israel
- 4.3. GCC
- 4.4. North Africa
- 4.5. South Africa
- 4.6. Rest of Middle East & Africa
-
5. Asia Pacific
- 5.1. China
- 5.2. India
- 5.3. Japan
- 5.4. South Korea
- 5.5. ASEAN
- 5.6. Oceania
- 5.7. Rest of Asia Pacific
recombinant dna technology Regional Market Share
Geographic Coverage of recombinant dna technology
recombinant dna technology REPORT HIGHLIGHTS
| Aspects | Details |
|---|---|
| Study Period | 2020-2034 |
| Base Year | 2025 |
| Estimated Year | 2026 |
| Forecast Period | 2026-2034 |
| Historical Period | 2020-2025 |
| Growth Rate | CAGR of 13.85% from 2020-2034 |
| Segmentation |
|
Table of Contents
- 1. Introduction
- 1.1. Research Scope
- 1.2. Market Segmentation
- 1.3. Research Methodology
- 1.4. Definitions and Assumptions
- 2. Executive Summary
- 2.1. Introduction
- 3. Market Dynamics
- 3.1. Introduction
- 3.2. Market Drivers
- 3.3. Market Restrains
- 3.4. Market Trends
- 4. Market Factor Analysis
- 4.1. Porters Five Forces
- 4.2. Supply/Value Chain
- 4.3. PESTEL analysis
- 4.4. Market Entropy
- 4.5. Patent/Trademark Analysis
- 5. Global recombinant dna technology Analysis, Insights and Forecast, 2020-2032
- 5.1. Market Analysis, Insights and Forecast - by Application
- 5.1.1. Biotechnology and Pharmaceutical Companies
- 5.1.2. Academic & Government Research Institutes
- 5.1.3. Others
- 5.2. Market Analysis, Insights and Forecast - by Types
- 5.2.1. Therapeutic Agent
- 5.2.2. Vaccine
- 5.2.3. Biotech Crops
- 5.2.4. Specialty Chemicals
- 5.3. Market Analysis, Insights and Forecast - by Region
- 5.3.1. North America
- 5.3.2. South America
- 5.3.3. Europe
- 5.3.4. Middle East & Africa
- 5.3.5. Asia Pacific
- 5.1. Market Analysis, Insights and Forecast - by Application
- 6. North America recombinant dna technology Analysis, Insights and Forecast, 2020-2032
- 6.1. Market Analysis, Insights and Forecast - by Application
- 6.1.1. Biotechnology and Pharmaceutical Companies
- 6.1.2. Academic & Government Research Institutes
- 6.1.3. Others
- 6.2. Market Analysis, Insights and Forecast - by Types
- 6.2.1. Therapeutic Agent
- 6.2.2. Vaccine
- 6.2.3. Biotech Crops
- 6.2.4. Specialty Chemicals
- 6.1. Market Analysis, Insights and Forecast - by Application
- 7. South America recombinant dna technology Analysis, Insights and Forecast, 2020-2032
- 7.1. Market Analysis, Insights and Forecast - by Application
- 7.1.1. Biotechnology and Pharmaceutical Companies
- 7.1.2. Academic & Government Research Institutes
- 7.1.3. Others
- 7.2. Market Analysis, Insights and Forecast - by Types
- 7.2.1. Therapeutic Agent
- 7.2.2. Vaccine
- 7.2.3. Biotech Crops
- 7.2.4. Specialty Chemicals
- 7.1. Market Analysis, Insights and Forecast - by Application
- 8. Europe recombinant dna technology Analysis, Insights and Forecast, 2020-2032
- 8.1. Market Analysis, Insights and Forecast - by Application
- 8.1.1. Biotechnology and Pharmaceutical Companies
- 8.1.2. Academic & Government Research Institutes
- 8.1.3. Others
- 8.2. Market Analysis, Insights and Forecast - by Types
- 8.2.1. Therapeutic Agent
- 8.2.2. Vaccine
- 8.2.3. Biotech Crops
- 8.2.4. Specialty Chemicals
- 8.1. Market Analysis, Insights and Forecast - by Application
- 9. Middle East & Africa recombinant dna technology Analysis, Insights and Forecast, 2020-2032
- 9.1. Market Analysis, Insights and Forecast - by Application
- 9.1.1. Biotechnology and Pharmaceutical Companies
- 9.1.2. Academic & Government Research Institutes
- 9.1.3. Others
- 9.2. Market Analysis, Insights and Forecast - by Types
- 9.2.1. Therapeutic Agent
- 9.2.2. Vaccine
- 9.2.3. Biotech Crops
- 9.2.4. Specialty Chemicals
- 9.1. Market Analysis, Insights and Forecast - by Application
- 10. Asia Pacific recombinant dna technology Analysis, Insights and Forecast, 2020-2032
- 10.1. Market Analysis, Insights and Forecast - by Application
- 10.1.1. Biotechnology and Pharmaceutical Companies
- 10.1.2. Academic & Government Research Institutes
- 10.1.3. Others
- 10.2. Market Analysis, Insights and Forecast - by Types
- 10.2.1. Therapeutic Agent
- 10.2.2. Vaccine
- 10.2.3. Biotech Crops
- 10.2.4. Specialty Chemicals
- 10.1. Market Analysis, Insights and Forecast - by Application
- 11. Competitive Analysis
- 11.1. Global Market Share Analysis 2025
- 11.2. Company Profiles
- 11.2.1 Monsanto Company
- 11.2.1.1. Overview
- 11.2.1.2. Products
- 11.2.1.3. SWOT Analysis
- 11.2.1.4. Recent Developments
- 11.2.1.5. Financials (Based on Availability)
- 11.2.2 Roche
- 11.2.2.1. Overview
- 11.2.2.2. Products
- 11.2.2.3. SWOT Analysis
- 11.2.2.4. Recent Developments
- 11.2.2.5. Financials (Based on Availability)
- 11.2.3 Biogen
- 11.2.3.1. Overview
- 11.2.3.2. Products
- 11.2.3.3. SWOT Analysis
- 11.2.3.4. Recent Developments
- 11.2.3.5. Financials (Based on Availability)
- 11.2.4 Amgen
- 11.2.4.1. Overview
- 11.2.4.2. Products
- 11.2.4.3. SWOT Analysis
- 11.2.4.4. Recent Developments
- 11.2.4.5. Financials (Based on Availability)
- 11.2.5 Novartis
- 11.2.5.1. Overview
- 11.2.5.2. Products
- 11.2.5.3. SWOT Analysis
- 11.2.5.4. Recent Developments
- 11.2.5.5. Financials (Based on Availability)
- 11.2.6 Eli Lilly and Company
- 11.2.6.1. Overview
- 11.2.6.2. Products
- 11.2.6.3. SWOT Analysis
- 11.2.6.4. Recent Developments
- 11.2.6.5. Financials (Based on Availability)
- 11.2.7 GenScript
- 11.2.7.1. Overview
- 11.2.7.2. Products
- 11.2.7.3. SWOT Analysis
- 11.2.7.4. Recent Developments
- 11.2.7.5. Financials (Based on Availability)
- 11.2.8 Pfizer Inc.
- 11.2.8.1. Overview
- 11.2.8.2. Products
- 11.2.8.3. SWOT Analysis
- 11.2.8.4. Recent Developments
- 11.2.8.5. Financials (Based on Availability)
- 11.2.9 Novo Nordisk
- 11.2.9.1. Overview
- 11.2.9.2. Products
- 11.2.9.3. SWOT Analysis
- 11.2.9.4. Recent Developments
- 11.2.9.5. Financials (Based on Availability)
- 11.2.10 Sanofi
- 11.2.10.1. Overview
- 11.2.10.2. Products
- 11.2.10.3. SWOT Analysis
- 11.2.10.4. Recent Developments
- 11.2.10.5. Financials (Based on Availability)
- 11.2.11 Merck KGaA
- 11.2.11.1. Overview
- 11.2.11.2. Products
- 11.2.11.3. SWOT Analysis
- 11.2.11.4. Recent Developments
- 11.2.11.5. Financials (Based on Availability)
- 11.2.12 Profacgen
- 11.2.12.1. Overview
- 11.2.12.2. Products
- 11.2.12.3. SWOT Analysis
- 11.2.12.4. Recent Developments
- 11.2.12.5. Financials (Based on Availability)
- 11.2.13 Biocon
- 11.2.13.1. Overview
- 11.2.13.2. Products
- 11.2.13.3. SWOT Analysis
- 11.2.13.4. Recent Developments
- 11.2.13.5. Financials (Based on Availability)
- 11.2.14 GlaxoSmithKline
- 11.2.14.1. Overview
- 11.2.14.2. Products
- 11.2.14.3. SWOT Analysis
- 11.2.14.4. Recent Developments
- 11.2.14.5. Financials (Based on Availability)
- 11.2.15 Cibus
- 11.2.15.1. Overview
- 11.2.15.2. Products
- 11.2.15.3. SWOT Analysis
- 11.2.15.4. Recent Developments
- 11.2.15.5. Financials (Based on Availability)
- 11.2.16 Horizon Discovery Group
- 11.2.16.1. Overview
- 11.2.16.2. Products
- 11.2.16.3. SWOT Analysis
- 11.2.16.4. Recent Developments
- 11.2.16.5. Financials (Based on Availability)
- 11.2.17 New England Biolabs
- 11.2.17.1. Overview
- 11.2.17.2. Products
- 11.2.17.3. SWOT Analysis
- 11.2.17.4. Recent Developments
- 11.2.17.5. Financials (Based on Availability)
- 11.2.1 Monsanto Company
List of Figures
- Figure 1: Global recombinant dna technology Revenue Breakdown (billion, %) by Region 2025 & 2033
- Figure 2: North America recombinant dna technology Revenue (billion), by Application 2025 & 2033
- Figure 3: North America recombinant dna technology Revenue Share (%), by Application 2025 & 2033
- Figure 4: North America recombinant dna technology Revenue (billion), by Types 2025 & 2033
- Figure 5: North America recombinant dna technology Revenue Share (%), by Types 2025 & 2033
- Figure 6: North America recombinant dna technology Revenue (billion), by Country 2025 & 2033
- Figure 7: North America recombinant dna technology Revenue Share (%), by Country 2025 & 2033
- Figure 8: South America recombinant dna technology Revenue (billion), by Application 2025 & 2033
- Figure 9: South America recombinant dna technology Revenue Share (%), by Application 2025 & 2033
- Figure 10: South America recombinant dna technology Revenue (billion), by Types 2025 & 2033
- Figure 11: South America recombinant dna technology Revenue Share (%), by Types 2025 & 2033
- Figure 12: South America recombinant dna technology Revenue (billion), by Country 2025 & 2033
- Figure 13: South America recombinant dna technology Revenue Share (%), by Country 2025 & 2033
- Figure 14: Europe recombinant dna technology Revenue (billion), by Application 2025 & 2033
- Figure 15: Europe recombinant dna technology Revenue Share (%), by Application 2025 & 2033
- Figure 16: Europe recombinant dna technology Revenue (billion), by Types 2025 & 2033
- Figure 17: Europe recombinant dna technology Revenue Share (%), by Types 2025 & 2033
- Figure 18: Europe recombinant dna technology Revenue (billion), by Country 2025 & 2033
- Figure 19: Europe recombinant dna technology Revenue Share (%), by Country 2025 & 2033
- Figure 20: Middle East & Africa recombinant dna technology Revenue (billion), by Application 2025 & 2033
- Figure 21: Middle East & Africa recombinant dna technology Revenue Share (%), by Application 2025 & 2033
- Figure 22: Middle East & Africa recombinant dna technology Revenue (billion), by Types 2025 & 2033
- Figure 23: Middle East & Africa recombinant dna technology Revenue Share (%), by Types 2025 & 2033
- Figure 24: Middle East & Africa recombinant dna technology Revenue (billion), by Country 2025 & 2033
- Figure 25: Middle East & Africa recombinant dna technology Revenue Share (%), by Country 2025 & 2033
- Figure 26: Asia Pacific recombinant dna technology Revenue (billion), by Application 2025 & 2033
- Figure 27: Asia Pacific recombinant dna technology Revenue Share (%), by Application 2025 & 2033
- Figure 28: Asia Pacific recombinant dna technology Revenue (billion), by Types 2025 & 2033
- Figure 29: Asia Pacific recombinant dna technology Revenue Share (%), by Types 2025 & 2033
- Figure 30: Asia Pacific recombinant dna technology Revenue (billion), by Country 2025 & 2033
- Figure 31: Asia Pacific recombinant dna technology Revenue Share (%), by Country 2025 & 2033
List of Tables
- Table 1: Global recombinant dna technology Revenue billion Forecast, by Application 2020 & 2033
- Table 2: Global recombinant dna technology Revenue billion Forecast, by Types 2020 & 2033
- Table 3: Global recombinant dna technology Revenue billion Forecast, by Region 2020 & 2033
- Table 4: Global recombinant dna technology Revenue billion Forecast, by Application 2020 & 2033
- Table 5: Global recombinant dna technology Revenue billion Forecast, by Types 2020 & 2033
- Table 6: Global recombinant dna technology Revenue billion Forecast, by Country 2020 & 2033
- Table 7: United States recombinant dna technology Revenue (billion) Forecast, by Application 2020 & 2033
- Table 8: Canada recombinant dna technology Revenue (billion) Forecast, by Application 2020 & 2033
- Table 9: Mexico recombinant dna technology Revenue (billion) Forecast, by Application 2020 & 2033
- Table 10: Global recombinant dna technology Revenue billion Forecast, by Application 2020 & 2033
- Table 11: Global recombinant dna technology Revenue billion Forecast, by Types 2020 & 2033
- Table 12: Global recombinant dna technology Revenue billion Forecast, by Country 2020 & 2033
- Table 13: Brazil recombinant dna technology Revenue (billion) Forecast, by Application 2020 & 2033
- Table 14: Argentina recombinant dna technology Revenue (billion) Forecast, by Application 2020 & 2033
- Table 15: Rest of South America recombinant dna technology Revenue (billion) Forecast, by Application 2020 & 2033
- Table 16: Global recombinant dna technology Revenue billion Forecast, by Application 2020 & 2033
- Table 17: Global recombinant dna technology Revenue billion Forecast, by Types 2020 & 2033
- Table 18: Global recombinant dna technology Revenue billion Forecast, by Country 2020 & 2033
- Table 19: United Kingdom recombinant dna technology Revenue (billion) Forecast, by Application 2020 & 2033
- Table 20: Germany recombinant dna technology Revenue (billion) Forecast, by Application 2020 & 2033
- Table 21: France recombinant dna technology Revenue (billion) Forecast, by Application 2020 & 2033
- Table 22: Italy recombinant dna technology Revenue (billion) Forecast, by Application 2020 & 2033
- Table 23: Spain recombinant dna technology Revenue (billion) Forecast, by Application 2020 & 2033
- Table 24: Russia recombinant dna technology Revenue (billion) Forecast, by Application 2020 & 2033
- Table 25: Benelux recombinant dna technology Revenue (billion) Forecast, by Application 2020 & 2033
- Table 26: Nordics recombinant dna technology Revenue (billion) Forecast, by Application 2020 & 2033
- Table 27: Rest of Europe recombinant dna technology Revenue (billion) Forecast, by Application 2020 & 2033
- Table 28: Global recombinant dna technology Revenue billion Forecast, by Application 2020 & 2033
- Table 29: Global recombinant dna technology Revenue billion Forecast, by Types 2020 & 2033
- Table 30: Global recombinant dna technology Revenue billion Forecast, by Country 2020 & 2033
- Table 31: Turkey recombinant dna technology Revenue (billion) Forecast, by Application 2020 & 2033
- Table 32: Israel recombinant dna technology Revenue (billion) Forecast, by Application 2020 & 2033
- Table 33: GCC recombinant dna technology Revenue (billion) Forecast, by Application 2020 & 2033
- Table 34: North Africa recombinant dna technology Revenue (billion) Forecast, by Application 2020 & 2033
- Table 35: South Africa recombinant dna technology Revenue (billion) Forecast, by Application 2020 & 2033
- Table 36: Rest of Middle East & Africa recombinant dna technology Revenue (billion) Forecast, by Application 2020 & 2033
- Table 37: Global recombinant dna technology Revenue billion Forecast, by Application 2020 & 2033
- Table 38: Global recombinant dna technology Revenue billion Forecast, by Types 2020 & 2033
- Table 39: Global recombinant dna technology Revenue billion Forecast, by Country 2020 & 2033
- Table 40: China recombinant dna technology Revenue (billion) Forecast, by Application 2020 & 2033
- Table 41: India recombinant dna technology Revenue (billion) Forecast, by Application 2020 & 2033
- Table 42: Japan recombinant dna technology Revenue (billion) Forecast, by Application 2020 & 2033
- Table 43: South Korea recombinant dna technology Revenue (billion) Forecast, by Application 2020 & 2033
- Table 44: ASEAN recombinant dna technology Revenue (billion) Forecast, by Application 2020 & 2033
- Table 45: Oceania recombinant dna technology Revenue (billion) Forecast, by Application 2020 & 2033
- Table 46: Rest of Asia Pacific recombinant dna technology Revenue (billion) Forecast, by Application 2020 & 2033
Frequently Asked Questions
1. What is the projected Compound Annual Growth Rate (CAGR) of the recombinant dna technology?
The projected CAGR is approximately 13.85%.
2. Which companies are prominent players in the recombinant dna technology?
Key companies in the market include Monsanto Company, Roche, Biogen, Amgen, Novartis, Eli Lilly and Company, GenScript, Pfizer Inc., Novo Nordisk, Sanofi, Merck KGaA, Profacgen, Biocon, GlaxoSmithKline, Cibus, Horizon Discovery Group, New England Biolabs.
3. What are the main segments of the recombinant dna technology?
The market segments include Application, Types.
4. Can you provide details about the market size?
The market size is estimated to be USD 8.76 billion as of 2022.
5. What are some drivers contributing to market growth?
N/A
6. What are the notable trends driving market growth?
N/A
7. Are there any restraints impacting market growth?
N/A
8. Can you provide examples of recent developments in the market?
N/A
9. What pricing options are available for accessing the report?
Pricing options include single-user, multi-user, and enterprise licenses priced at USD 4350.00, USD 6525.00, and USD 8700.00 respectively.
10. Is the market size provided in terms of value or volume?
The market size is provided in terms of value, measured in billion.
11. Are there any specific market keywords associated with the report?
Yes, the market keyword associated with the report is "recombinant dna technology," which aids in identifying and referencing the specific market segment covered.
12. How do I determine which pricing option suits my needs best?
The pricing options vary based on user requirements and access needs. Individual users may opt for single-user licenses, while businesses requiring broader access may choose multi-user or enterprise licenses for cost-effective access to the report.
13. Are there any additional resources or data provided in the recombinant dna technology report?
While the report offers comprehensive insights, it's advisable to review the specific contents or supplementary materials provided to ascertain if additional resources or data are available.
14. How can I stay updated on further developments or reports in the recombinant dna technology?
To stay informed about further developments, trends, and reports in the recombinant dna technology, consider subscribing to industry newsletters, following relevant companies and organizations, or regularly checking reputable industry news sources and publications.
Methodology
Step 1 - Identification of Relevant Samples Size from Population Database


Step 2 - Approaches for Defining Global Market Size (Value, Volume* & Price*)

Note*: In applicable scenarios
Step 3 - Data Sources
Primary Research
- Web Analytics
- Survey Reports
- Research Institute
- Latest Research Reports
- Opinion Leaders
Secondary Research
- Annual Reports
- White Paper
- Latest Press Release
- Industry Association
- Paid Database
- Investor Presentations

Step 4 - Data Triangulation
Involves using different sources of information in order to increase the validity of a study
These sources are likely to be stakeholders in a program - participants, other researchers, program staff, other community members, and so on.
Then we put all data in single framework & apply various statistical tools to find out the dynamic on the market.
During the analysis stage, feedback from the stakeholder groups would be compared to determine areas of agreement as well as areas of divergence