

Key Insights
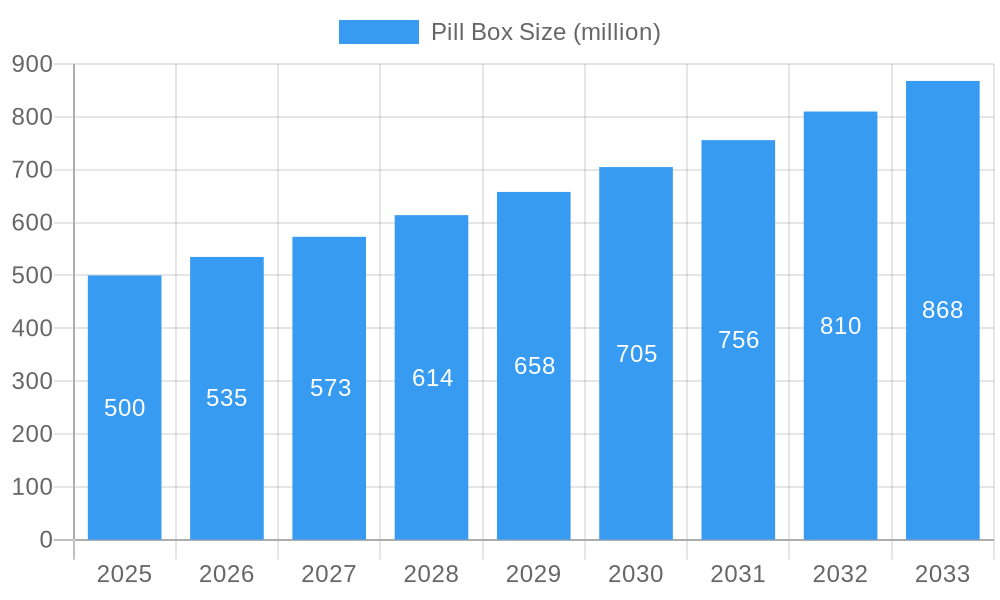
The global pill box market is experiencing robust growth, driven by an aging population, increasing prevalence of chronic diseases requiring medication adherence, and technological advancements in smart pill dispensers. The market, estimated at $500 million in 2025, is projected to exhibit a Compound Annual Growth Rate (CAGR) of 7% from 2025 to 2033, reaching approximately $900 million by 2033. This growth is fueled by several key trends, including the rising adoption of smart pill organizers with features like reminders and medication tracking, coupled with increased awareness of the importance of medication adherence for better health outcomes. The market is segmented by type (simple pill boxes, weekly pill organizers, daily pill organizers, smart pill dispensers), material (plastic, metal), and end-user (hospitals, pharmacies, homecare). Competitive landscape analysis reveals the presence of both established players like MedMinder and emerging companies focusing on innovative smart pill dispenser technologies. Geographic variations in market penetration exist, with developed regions like North America and Europe exhibiting higher adoption rates than developing economies. However, increasing healthcare awareness and improved access to medication management solutions in developing countries are expected to drive market growth in these regions over the forecast period. The market does face certain restraints, including high initial costs associated with advanced smart pill dispensers and concerns regarding data security and privacy related to connected devices. Nevertheless, ongoing technological improvements and strategic partnerships between manufacturers and healthcare providers are likely to mitigate these challenges and propel market expansion.
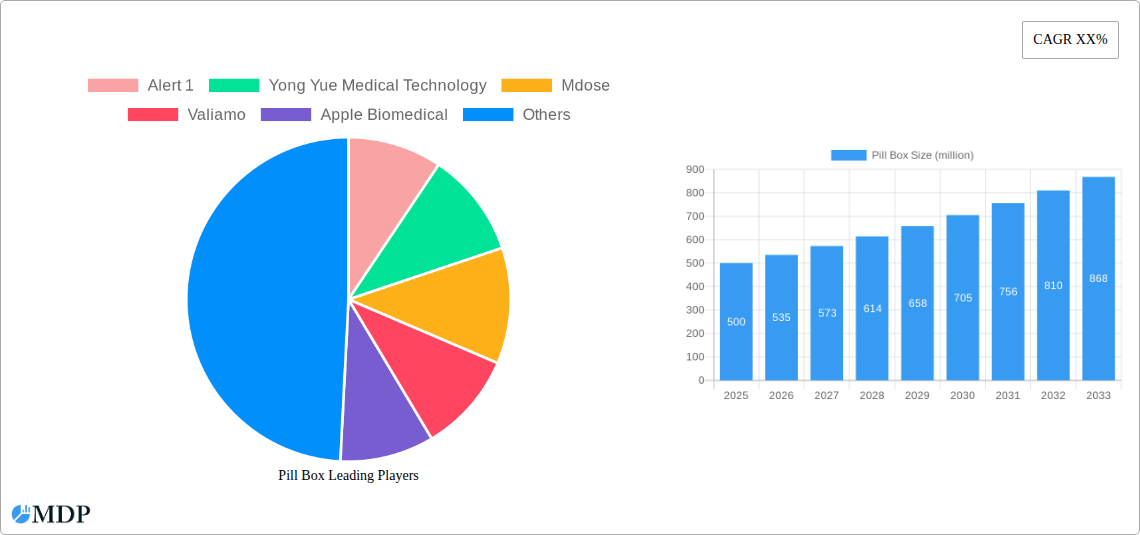
Pill Box Market Size (In Million)
The competitive landscape is dynamic, with companies focusing on product innovation, strategic partnerships, and geographic expansion to gain market share. Key players are investing in research and development to improve product features, enhance user experience, and incorporate advanced technologies such as mobile app integration and remote medication monitoring. Furthermore, increasing demand for customized pill organizers catering to specific patient needs and preferences represents a significant growth opportunity. Regulatory approvals and reimbursement policies also influence market dynamics, with favorable government regulations promoting wider adoption of advanced pill management systems. Looking ahead, the market is poised for continued expansion, driven by technological advancements, favorable demographics, and increased awareness of medication adherence's role in improving overall health outcomes. The focus on developing cost-effective and user-friendly solutions will be crucial for driving market penetration and reaching a broader patient base.
Pill Box Company Market Share
This in-depth report provides a comprehensive analysis of the global pill box market, projecting a market value exceeding $xx million by 2033. The report covers market dynamics, industry trends, leading players, and future opportunities, offering invaluable insights for stakeholders across the healthcare sector. With a detailed study period spanning 2019-2033 (base year 2025, estimated year 2025, forecast period 2025-2033, historical period 2019-2024), this report is an essential resource for strategic decision-making.
Pill Box Market Dynamics & Concentration
The global pill box market exhibits a moderately consolidated structure, with a handful of key players commanding significant market share. The market's dynamism is fueled by several factors including: increasing geriatric populations globally, rising prevalence of chronic diseases requiring multiple medications, technological advancements leading to smart pill dispensers, and favorable regulatory landscapes in several key regions. However, the market also faces challenges from the availability of cheaper substitute products and the potential for generic competition.
Market Concentration Metrics (2025 Estimates):
- Top 5 players hold approximately xx% of the market share.
- Average market concentration ratio (CR5) is estimated at xx%.
- Number of M&A deals in the last 5 years: xx.
Innovation Drivers:
- Development of smart pill boxes with features such as medication reminders, dosage tracking, and remote monitoring.
- Integration of IoT technology for improved patient adherence and healthcare management.
- Focus on user-friendly designs and ergonomic features catering to diverse needs.
Pill Box Industry Trends & Analysis
The pill box market is experiencing robust growth, driven by a confluence of factors. The aging global population is a significant driver, with an increasing number of elderly individuals requiring assistance with medication management. Technological advancements have also significantly impacted the market, leading to the development of smart pill boxes with improved functionality and convenience. This is further amplified by growing consumer awareness of medication adherence and its impact on health outcomes.
Key Market Trends:
- CAGR (2025-2033): xx%
- Market Penetration: xx% in developed nations, xx% in developing nations (2025 estimates).
- Increased demand for smart pill boxes: Adoption rate of smart pill boxes is projected to increase significantly over the forecast period, driven by technological advancements and increasing healthcare expenditure.
- Growing preference for personalized pill boxes: Customization options, including size, design, and medication reminder features, are gaining popularity.
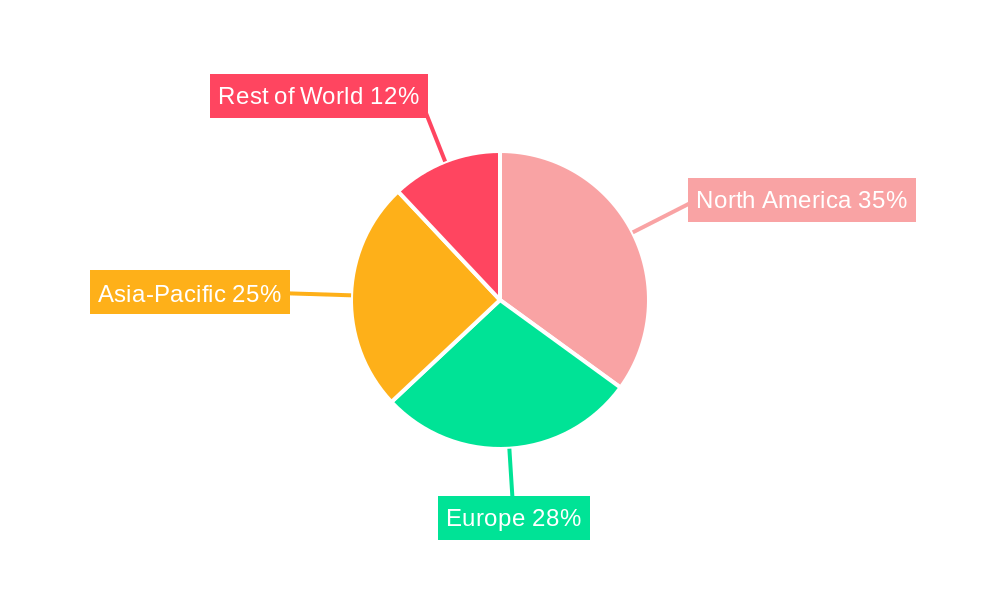
Leading Markets & Segments in Pill Box
North America currently dominates the global pill box market, driven by factors such as high healthcare expenditure, an aging population, and increased adoption of advanced technologies. Europe and Asia-Pacific are also significant markets, demonstrating steady growth.
Key Drivers of Regional Dominance:
- North America: High healthcare spending, strong regulatory framework supporting medical device innovation, and large geriatric population.
- Europe: Growing prevalence of chronic diseases, rising awareness about medication adherence, and increasing government initiatives promoting healthcare technology.
- Asia-Pacific: Rapidly expanding geriatric population, increasing disposable incomes, and rising healthcare expenditure.
Segment Analysis:
- Smart pill boxes are expected to witness the highest growth rate due to increased technological advancements.
- Manual pill boxes maintain a significant market share due to their affordability and simplicity.
Pill Box Product Developments
Recent product innovations center on smart pill boxes equipped with electronic reminders, medication tracking capabilities, and connectivity to mobile apps or telehealth systems. These innovations aim to improve medication adherence and enhance patient care. Competitive advantages are largely driven by superior technological features, ease of use, and integration with existing healthcare systems. The market is shifting towards personalized solutions to cater to individual patient needs and preferences.
Key Drivers of Pill Box Growth
The growth of the pill box market is propelled by several key factors:
- Aging population: The global increase in the elderly population is a primary driver, as this demographic often requires assistance with medication management.
- Technological advancements: The development of smart pill boxes with advanced features such as medication reminders and remote monitoring significantly improves patient adherence.
- Rising prevalence of chronic diseases: The growing number of individuals with chronic conditions requiring multiple medications boosts the demand for pill boxes.
- Favorable regulatory environment: Supportive regulations in various countries encourage the development and adoption of innovative pill box solutions.
Challenges in the Pill Box Market
The market faces challenges such as:
- High initial costs associated with advanced smart pill boxes can limit adoption.
- Concerns about data security and privacy related to connected pill boxes.
- Competition from generic pill boxes and substitute products can erode market share.
- Regulatory hurdles and compliance requirements in different regions can pose barriers to entry.
Emerging Opportunities in Pill Box
Significant opportunities exist for growth in the pill box market. The integration of artificial intelligence (AI) and machine learning (ML) into smart pill boxes can enable personalized medication recommendations and proactive health management. Strategic partnerships between pill box manufacturers and telehealth providers can expand market reach and enhance service offerings. Expansion into developing markets with growing geriatric populations presents significant untapped potential.
Leading Players in the Pill Box Sector
- Alert 1
- Yong Yue Medical Technology
- Mdose
- Valiamo
- Apple Biomedical
- Bioland
- VRI
- Caretronic
- Gima
- H+H SYSTEM
- Praticima
- MedMinder
- Robotik Technology
- Romed Holland
- Ningbo Yifeng Lifecare
- Tayg Clinic
- Sanner
- HI-LIFE TECHNOLOGY
- JMS Healthcare
- Kibodan
- Medinox
- Dosepack India
- Enfermania
- Francehopital
- Tunstall
- Union Plastic
- ZARGESMedissimo
- Parsons ADL
- Suzhou SunMed
- MedSignals
Key Milestones in Pill Box Industry
- 2020: Launch of the first AI-powered smart pill box by [Company Name].
- 2021: FDA approval of a new smart pill box with remote monitoring capabilities.
- 2022: Strategic partnership between [Company A] and [Company B] to develop a new generation of pill dispensers.
- 2023: Acquisition of [Company X] by [Company Y] leading to market consolidation.
- 2024: Introduction of several new smart pill boxes with enhanced features like medication interaction alerts and personalized dosage reminders.
Strategic Outlook for Pill Box Market
The pill box market is poised for continued expansion, driven by an aging global population, rising chronic disease prevalence, and ongoing technological advancements. Strategic opportunities lie in developing innovative smart pill boxes with advanced features, focusing on user experience, and establishing strong partnerships within the healthcare ecosystem. Companies that successfully address the challenges related to cost, data security, and regulatory compliance will be best positioned to capitalize on the market's significant growth potential.
Pill Box Segmentation
-
1. Application
- 1.1. Personal
- 1.2. Hospital
- 1.3. Clinic
-
2. Types
- 2.1. Electronic
- 2.2. Common
Pill Box Segmentation By Geography
-
1. North America
- 1.1. United States
- 1.2. Canada
- 1.3. Mexico
-
2. South America
- 2.1. Brazil
- 2.2. Argentina
- 2.3. Rest of South America
-
3. Europe
- 3.1. United Kingdom
- 3.2. Germany
- 3.3. France
- 3.4. Italy
- 3.5. Spain
- 3.6. Russia
- 3.7. Benelux
- 3.8. Nordics
- 3.9. Rest of Europe
-
4. Middle East & Africa
- 4.1. Turkey
- 4.2. Israel
- 4.3. GCC
- 4.4. North Africa
- 4.5. South Africa
- 4.6. Rest of Middle East & Africa
-
5. Asia Pacific
- 5.1. China
- 5.2. India
- 5.3. Japan
- 5.4. South Korea
- 5.5. ASEAN
- 5.6. Oceania
- 5.7. Rest of Asia Pacific
Pill Box Regional Market Share
Geographic Coverage of Pill Box
Pill Box REPORT HIGHLIGHTS
| Aspects | Details |
|---|---|
| Study Period | 2020-2034 |
| Base Year | 2025 |
| Estimated Year | 2026 |
| Forecast Period | 2026-2034 |
| Historical Period | 2020-2025 |
| Growth Rate | CAGR of XX% from 2020-2034 |
| Segmentation |
|
Table of Contents
- 1. Introduction
- 1.1. Research Scope
- 1.2. Market Segmentation
- 1.3. Research Methodology
- 1.4. Definitions and Assumptions
- 2. Executive Summary
- 2.1. Introduction
- 3. Market Dynamics
- 3.1. Introduction
- 3.2. Market Drivers
- 3.3. Market Restrains
- 3.4. Market Trends
- 4. Market Factor Analysis
- 4.1. Porters Five Forces
- 4.2. Supply/Value Chain
- 4.3. PESTEL analysis
- 4.4. Market Entropy
- 4.5. Patent/Trademark Analysis
- 5. Global Pill Box Analysis, Insights and Forecast, 2020-2032
- 5.1. Market Analysis, Insights and Forecast - by Application
- 5.1.1. Personal
- 5.1.2. Hospital
- 5.1.3. Clinic
- 5.2. Market Analysis, Insights and Forecast - by Types
- 5.2.1. Electronic
- 5.2.2. Common
- 5.3. Market Analysis, Insights and Forecast - by Region
- 5.3.1. North America
- 5.3.2. South America
- 5.3.3. Europe
- 5.3.4. Middle East & Africa
- 5.3.5. Asia Pacific
- 5.1. Market Analysis, Insights and Forecast - by Application
- 6. North America Pill Box Analysis, Insights and Forecast, 2020-2032
- 6.1. Market Analysis, Insights and Forecast - by Application
- 6.1.1. Personal
- 6.1.2. Hospital
- 6.1.3. Clinic
- 6.2. Market Analysis, Insights and Forecast - by Types
- 6.2.1. Electronic
- 6.2.2. Common
- 6.1. Market Analysis, Insights and Forecast - by Application
- 7. South America Pill Box Analysis, Insights and Forecast, 2020-2032
- 7.1. Market Analysis, Insights and Forecast - by Application
- 7.1.1. Personal
- 7.1.2. Hospital
- 7.1.3. Clinic
- 7.2. Market Analysis, Insights and Forecast - by Types
- 7.2.1. Electronic
- 7.2.2. Common
- 7.1. Market Analysis, Insights and Forecast - by Application
- 8. Europe Pill Box Analysis, Insights and Forecast, 2020-2032
- 8.1. Market Analysis, Insights and Forecast - by Application
- 8.1.1. Personal
- 8.1.2. Hospital
- 8.1.3. Clinic
- 8.2. Market Analysis, Insights and Forecast - by Types
- 8.2.1. Electronic
- 8.2.2. Common
- 8.1. Market Analysis, Insights and Forecast - by Application
- 9. Middle East & Africa Pill Box Analysis, Insights and Forecast, 2020-2032
- 9.1. Market Analysis, Insights and Forecast - by Application
- 9.1.1. Personal
- 9.1.2. Hospital
- 9.1.3. Clinic
- 9.2. Market Analysis, Insights and Forecast - by Types
- 9.2.1. Electronic
- 9.2.2. Common
- 9.1. Market Analysis, Insights and Forecast - by Application
- 10. Asia Pacific Pill Box Analysis, Insights and Forecast, 2020-2032
- 10.1. Market Analysis, Insights and Forecast - by Application
- 10.1.1. Personal
- 10.1.2. Hospital
- 10.1.3. Clinic
- 10.2. Market Analysis, Insights and Forecast - by Types
- 10.2.1. Electronic
- 10.2.2. Common
- 10.1. Market Analysis, Insights and Forecast - by Application
- 11. Competitive Analysis
- 11.1. Global Market Share Analysis 2025
- 11.2. Company Profiles
- 11.2.1 Alert 1
- 11.2.1.1. Overview
- 11.2.1.2. Products
- 11.2.1.3. SWOT Analysis
- 11.2.1.4. Recent Developments
- 11.2.1.5. Financials (Based on Availability)
- 11.2.2 Yong Yue Medical Technology
- 11.2.2.1. Overview
- 11.2.2.2. Products
- 11.2.2.3. SWOT Analysis
- 11.2.2.4. Recent Developments
- 11.2.2.5. Financials (Based on Availability)
- 11.2.3 Mdose
- 11.2.3.1. Overview
- 11.2.3.2. Products
- 11.2.3.3. SWOT Analysis
- 11.2.3.4. Recent Developments
- 11.2.3.5. Financials (Based on Availability)
- 11.2.4 Valiamo
- 11.2.4.1. Overview
- 11.2.4.2. Products
- 11.2.4.3. SWOT Analysis
- 11.2.4.4. Recent Developments
- 11.2.4.5. Financials (Based on Availability)
- 11.2.5 Apple Biomedical
- 11.2.5.1. Overview
- 11.2.5.2. Products
- 11.2.5.3. SWOT Analysis
- 11.2.5.4. Recent Developments
- 11.2.5.5. Financials (Based on Availability)
- 11.2.6 Bioland
- 11.2.6.1. Overview
- 11.2.6.2. Products
- 11.2.6.3. SWOT Analysis
- 11.2.6.4. Recent Developments
- 11.2.6.5. Financials (Based on Availability)
- 11.2.7 VRI
- 11.2.7.1. Overview
- 11.2.7.2. Products
- 11.2.7.3. SWOT Analysis
- 11.2.7.4. Recent Developments
- 11.2.7.5. Financials (Based on Availability)
- 11.2.8 Caretronic
- 11.2.8.1. Overview
- 11.2.8.2. Products
- 11.2.8.3. SWOT Analysis
- 11.2.8.4. Recent Developments
- 11.2.8.5. Financials (Based on Availability)
- 11.2.9 Gima
- 11.2.9.1. Overview
- 11.2.9.2. Products
- 11.2.9.3. SWOT Analysis
- 11.2.9.4. Recent Developments
- 11.2.9.5. Financials (Based on Availability)
- 11.2.10 H+H SYSTEM
- 11.2.10.1. Overview
- 11.2.10.2. Products
- 11.2.10.3. SWOT Analysis
- 11.2.10.4. Recent Developments
- 11.2.10.5. Financials (Based on Availability)
- 11.2.11 Praticima
- 11.2.11.1. Overview
- 11.2.11.2. Products
- 11.2.11.3. SWOT Analysis
- 11.2.11.4. Recent Developments
- 11.2.11.5. Financials (Based on Availability)
- 11.2.12 MedMinder
- 11.2.12.1. Overview
- 11.2.12.2. Products
- 11.2.12.3. SWOT Analysis
- 11.2.12.4. Recent Developments
- 11.2.12.5. Financials (Based on Availability)
- 11.2.13 Robotik Technology
- 11.2.13.1. Overview
- 11.2.13.2. Products
- 11.2.13.3. SWOT Analysis
- 11.2.13.4. Recent Developments
- 11.2.13.5. Financials (Based on Availability)
- 11.2.14 Romed Holland
- 11.2.14.1. Overview
- 11.2.14.2. Products
- 11.2.14.3. SWOT Analysis
- 11.2.14.4. Recent Developments
- 11.2.14.5. Financials (Based on Availability)
- 11.2.15 Ningbo Yifeng Lifecare
- 11.2.15.1. Overview
- 11.2.15.2. Products
- 11.2.15.3. SWOT Analysis
- 11.2.15.4. Recent Developments
- 11.2.15.5. Financials (Based on Availability)
- 11.2.16 Tayg Clinic
- 11.2.16.1. Overview
- 11.2.16.2. Products
- 11.2.16.3. SWOT Analysis
- 11.2.16.4. Recent Developments
- 11.2.16.5. Financials (Based on Availability)
- 11.2.17 Sanner
- 11.2.17.1. Overview
- 11.2.17.2. Products
- 11.2.17.3. SWOT Analysis
- 11.2.17.4. Recent Developments
- 11.2.17.5. Financials (Based on Availability)
- 11.2.18 HI-LIFE TECHNOLOGY
- 11.2.18.1. Overview
- 11.2.18.2. Products
- 11.2.18.3. SWOT Analysis
- 11.2.18.4. Recent Developments
- 11.2.18.5. Financials (Based on Availability)
- 11.2.19 JMS Healthcare
- 11.2.19.1. Overview
- 11.2.19.2. Products
- 11.2.19.3. SWOT Analysis
- 11.2.19.4. Recent Developments
- 11.2.19.5. Financials (Based on Availability)
- 11.2.20 Kibodan
- 11.2.20.1. Overview
- 11.2.20.2. Products
- 11.2.20.3. SWOT Analysis
- 11.2.20.4. Recent Developments
- 11.2.20.5. Financials (Based on Availability)
- 11.2.21 Medinox
- 11.2.21.1. Overview
- 11.2.21.2. Products
- 11.2.21.3. SWOT Analysis
- 11.2.21.4. Recent Developments
- 11.2.21.5. Financials (Based on Availability)
- 11.2.22 Dosepack India
- 11.2.22.1. Overview
- 11.2.22.2. Products
- 11.2.22.3. SWOT Analysis
- 11.2.22.4. Recent Developments
- 11.2.22.5. Financials (Based on Availability)
- 11.2.23 Enfermania
- 11.2.23.1. Overview
- 11.2.23.2. Products
- 11.2.23.3. SWOT Analysis
- 11.2.23.4. Recent Developments
- 11.2.23.5. Financials (Based on Availability)
- 11.2.24 Francehopital
- 11.2.24.1. Overview
- 11.2.24.2. Products
- 11.2.24.3. SWOT Analysis
- 11.2.24.4. Recent Developments
- 11.2.24.5. Financials (Based on Availability)
- 11.2.25 Tunstall
- 11.2.25.1. Overview
- 11.2.25.2. Products
- 11.2.25.3. SWOT Analysis
- 11.2.25.4. Recent Developments
- 11.2.25.5. Financials (Based on Availability)
- 11.2.26 Union Plastic
- 11.2.26.1. Overview
- 11.2.26.2. Products
- 11.2.26.3. SWOT Analysis
- 11.2.26.4. Recent Developments
- 11.2.26.5. Financials (Based on Availability)
- 11.2.27 ZARGESMedissimo
- 11.2.27.1. Overview
- 11.2.27.2. Products
- 11.2.27.3. SWOT Analysis
- 11.2.27.4. Recent Developments
- 11.2.27.5. Financials (Based on Availability)
- 11.2.28 Parsons ADL
- 11.2.28.1. Overview
- 11.2.28.2. Products
- 11.2.28.3. SWOT Analysis
- 11.2.28.4. Recent Developments
- 11.2.28.5. Financials (Based on Availability)
- 11.2.29 Suzhou SunMed
- 11.2.29.1. Overview
- 11.2.29.2. Products
- 11.2.29.3. SWOT Analysis
- 11.2.29.4. Recent Developments
- 11.2.29.5. Financials (Based on Availability)
- 11.2.30 MedSignals
- 11.2.30.1. Overview
- 11.2.30.2. Products
- 11.2.30.3. SWOT Analysis
- 11.2.30.4. Recent Developments
- 11.2.30.5. Financials (Based on Availability)
- 11.2.1 Alert 1
List of Figures
- Figure 1: Global Pill Box Revenue Breakdown (million, %) by Region 2025 & 2033
- Figure 2: Global Pill Box Volume Breakdown (K, %) by Region 2025 & 2033
- Figure 3: North America Pill Box Revenue (million), by Application 2025 & 2033
- Figure 4: North America Pill Box Volume (K), by Application 2025 & 2033
- Figure 5: North America Pill Box Revenue Share (%), by Application 2025 & 2033
- Figure 6: North America Pill Box Volume Share (%), by Application 2025 & 2033
- Figure 7: North America Pill Box Revenue (million), by Types 2025 & 2033
- Figure 8: North America Pill Box Volume (K), by Types 2025 & 2033
- Figure 9: North America Pill Box Revenue Share (%), by Types 2025 & 2033
- Figure 10: North America Pill Box Volume Share (%), by Types 2025 & 2033
- Figure 11: North America Pill Box Revenue (million), by Country 2025 & 2033
- Figure 12: North America Pill Box Volume (K), by Country 2025 & 2033
- Figure 13: North America Pill Box Revenue Share (%), by Country 2025 & 2033
- Figure 14: North America Pill Box Volume Share (%), by Country 2025 & 2033
- Figure 15: South America Pill Box Revenue (million), by Application 2025 & 2033
- Figure 16: South America Pill Box Volume (K), by Application 2025 & 2033
- Figure 17: South America Pill Box Revenue Share (%), by Application 2025 & 2033
- Figure 18: South America Pill Box Volume Share (%), by Application 2025 & 2033
- Figure 19: South America Pill Box Revenue (million), by Types 2025 & 2033
- Figure 20: South America Pill Box Volume (K), by Types 2025 & 2033
- Figure 21: South America Pill Box Revenue Share (%), by Types 2025 & 2033
- Figure 22: South America Pill Box Volume Share (%), by Types 2025 & 2033
- Figure 23: South America Pill Box Revenue (million), by Country 2025 & 2033
- Figure 24: South America Pill Box Volume (K), by Country 2025 & 2033
- Figure 25: South America Pill Box Revenue Share (%), by Country 2025 & 2033
- Figure 26: South America Pill Box Volume Share (%), by Country 2025 & 2033
- Figure 27: Europe Pill Box Revenue (million), by Application 2025 & 2033
- Figure 28: Europe Pill Box Volume (K), by Application 2025 & 2033
- Figure 29: Europe Pill Box Revenue Share (%), by Application 2025 & 2033
- Figure 30: Europe Pill Box Volume Share (%), by Application 2025 & 2033
- Figure 31: Europe Pill Box Revenue (million), by Types 2025 & 2033
- Figure 32: Europe Pill Box Volume (K), by Types 2025 & 2033
- Figure 33: Europe Pill Box Revenue Share (%), by Types 2025 & 2033
- Figure 34: Europe Pill Box Volume Share (%), by Types 2025 & 2033
- Figure 35: Europe Pill Box Revenue (million), by Country 2025 & 2033
- Figure 36: Europe Pill Box Volume (K), by Country 2025 & 2033
- Figure 37: Europe Pill Box Revenue Share (%), by Country 2025 & 2033
- Figure 38: Europe Pill Box Volume Share (%), by Country 2025 & 2033
- Figure 39: Middle East & Africa Pill Box Revenue (million), by Application 2025 & 2033
- Figure 40: Middle East & Africa Pill Box Volume (K), by Application 2025 & 2033
- Figure 41: Middle East & Africa Pill Box Revenue Share (%), by Application 2025 & 2033
- Figure 42: Middle East & Africa Pill Box Volume Share (%), by Application 2025 & 2033
- Figure 43: Middle East & Africa Pill Box Revenue (million), by Types 2025 & 2033
- Figure 44: Middle East & Africa Pill Box Volume (K), by Types 2025 & 2033
- Figure 45: Middle East & Africa Pill Box Revenue Share (%), by Types 2025 & 2033
- Figure 46: Middle East & Africa Pill Box Volume Share (%), by Types 2025 & 2033
- Figure 47: Middle East & Africa Pill Box Revenue (million), by Country 2025 & 2033
- Figure 48: Middle East & Africa Pill Box Volume (K), by Country 2025 & 2033
- Figure 49: Middle East & Africa Pill Box Revenue Share (%), by Country 2025 & 2033
- Figure 50: Middle East & Africa Pill Box Volume Share (%), by Country 2025 & 2033
- Figure 51: Asia Pacific Pill Box Revenue (million), by Application 2025 & 2033
- Figure 52: Asia Pacific Pill Box Volume (K), by Application 2025 & 2033
- Figure 53: Asia Pacific Pill Box Revenue Share (%), by Application 2025 & 2033
- Figure 54: Asia Pacific Pill Box Volume Share (%), by Application 2025 & 2033
- Figure 55: Asia Pacific Pill Box Revenue (million), by Types 2025 & 2033
- Figure 56: Asia Pacific Pill Box Volume (K), by Types 2025 & 2033
- Figure 57: Asia Pacific Pill Box Revenue Share (%), by Types 2025 & 2033
- Figure 58: Asia Pacific Pill Box Volume Share (%), by Types 2025 & 2033
- Figure 59: Asia Pacific Pill Box Revenue (million), by Country 2025 & 2033
- Figure 60: Asia Pacific Pill Box Volume (K), by Country 2025 & 2033
- Figure 61: Asia Pacific Pill Box Revenue Share (%), by Country 2025 & 2033
- Figure 62: Asia Pacific Pill Box Volume Share (%), by Country 2025 & 2033
List of Tables
- Table 1: Global Pill Box Revenue million Forecast, by Application 2020 & 2033
- Table 2: Global Pill Box Volume K Forecast, by Application 2020 & 2033
- Table 3: Global Pill Box Revenue million Forecast, by Types 2020 & 2033
- Table 4: Global Pill Box Volume K Forecast, by Types 2020 & 2033
- Table 5: Global Pill Box Revenue million Forecast, by Region 2020 & 2033
- Table 6: Global Pill Box Volume K Forecast, by Region 2020 & 2033
- Table 7: Global Pill Box Revenue million Forecast, by Application 2020 & 2033
- Table 8: Global Pill Box Volume K Forecast, by Application 2020 & 2033
- Table 9: Global Pill Box Revenue million Forecast, by Types 2020 & 2033
- Table 10: Global Pill Box Volume K Forecast, by Types 2020 & 2033
- Table 11: Global Pill Box Revenue million Forecast, by Country 2020 & 2033
- Table 12: Global Pill Box Volume K Forecast, by Country 2020 & 2033
- Table 13: United States Pill Box Revenue (million) Forecast, by Application 2020 & 2033
- Table 14: United States Pill Box Volume (K) Forecast, by Application 2020 & 2033
- Table 15: Canada Pill Box Revenue (million) Forecast, by Application 2020 & 2033
- Table 16: Canada Pill Box Volume (K) Forecast, by Application 2020 & 2033
- Table 17: Mexico Pill Box Revenue (million) Forecast, by Application 2020 & 2033
- Table 18: Mexico Pill Box Volume (K) Forecast, by Application 2020 & 2033
- Table 19: Global Pill Box Revenue million Forecast, by Application 2020 & 2033
- Table 20: Global Pill Box Volume K Forecast, by Application 2020 & 2033
- Table 21: Global Pill Box Revenue million Forecast, by Types 2020 & 2033
- Table 22: Global Pill Box Volume K Forecast, by Types 2020 & 2033
- Table 23: Global Pill Box Revenue million Forecast, by Country 2020 & 2033
- Table 24: Global Pill Box Volume K Forecast, by Country 2020 & 2033
- Table 25: Brazil Pill Box Revenue (million) Forecast, by Application 2020 & 2033
- Table 26: Brazil Pill Box Volume (K) Forecast, by Application 2020 & 2033
- Table 27: Argentina Pill Box Revenue (million) Forecast, by Application 2020 & 2033
- Table 28: Argentina Pill Box Volume (K) Forecast, by Application 2020 & 2033
- Table 29: Rest of South America Pill Box Revenue (million) Forecast, by Application 2020 & 2033
- Table 30: Rest of South America Pill Box Volume (K) Forecast, by Application 2020 & 2033
- Table 31: Global Pill Box Revenue million Forecast, by Application 2020 & 2033
- Table 32: Global Pill Box Volume K Forecast, by Application 2020 & 2033
- Table 33: Global Pill Box Revenue million Forecast, by Types 2020 & 2033
- Table 34: Global Pill Box Volume K Forecast, by Types 2020 & 2033
- Table 35: Global Pill Box Revenue million Forecast, by Country 2020 & 2033
- Table 36: Global Pill Box Volume K Forecast, by Country 2020 & 2033
- Table 37: United Kingdom Pill Box Revenue (million) Forecast, by Application 2020 & 2033
- Table 38: United Kingdom Pill Box Volume (K) Forecast, by Application 2020 & 2033
- Table 39: Germany Pill Box Revenue (million) Forecast, by Application 2020 & 2033
- Table 40: Germany Pill Box Volume (K) Forecast, by Application 2020 & 2033
- Table 41: France Pill Box Revenue (million) Forecast, by Application 2020 & 2033
- Table 42: France Pill Box Volume (K) Forecast, by Application 2020 & 2033
- Table 43: Italy Pill Box Revenue (million) Forecast, by Application 2020 & 2033
- Table 44: Italy Pill Box Volume (K) Forecast, by Application 2020 & 2033
- Table 45: Spain Pill Box Revenue (million) Forecast, by Application 2020 & 2033
- Table 46: Spain Pill Box Volume (K) Forecast, by Application 2020 & 2033
- Table 47: Russia Pill Box Revenue (million) Forecast, by Application 2020 & 2033
- Table 48: Russia Pill Box Volume (K) Forecast, by Application 2020 & 2033
- Table 49: Benelux Pill Box Revenue (million) Forecast, by Application 2020 & 2033
- Table 50: Benelux Pill Box Volume (K) Forecast, by Application 2020 & 2033
- Table 51: Nordics Pill Box Revenue (million) Forecast, by Application 2020 & 2033
- Table 52: Nordics Pill Box Volume (K) Forecast, by Application 2020 & 2033
- Table 53: Rest of Europe Pill Box Revenue (million) Forecast, by Application 2020 & 2033
- Table 54: Rest of Europe Pill Box Volume (K) Forecast, by Application 2020 & 2033
- Table 55: Global Pill Box Revenue million Forecast, by Application 2020 & 2033
- Table 56: Global Pill Box Volume K Forecast, by Application 2020 & 2033
- Table 57: Global Pill Box Revenue million Forecast, by Types 2020 & 2033
- Table 58: Global Pill Box Volume K Forecast, by Types 2020 & 2033
- Table 59: Global Pill Box Revenue million Forecast, by Country 2020 & 2033
- Table 60: Global Pill Box Volume K Forecast, by Country 2020 & 2033
- Table 61: Turkey Pill Box Revenue (million) Forecast, by Application 2020 & 2033
- Table 62: Turkey Pill Box Volume (K) Forecast, by Application 2020 & 2033
- Table 63: Israel Pill Box Revenue (million) Forecast, by Application 2020 & 2033
- Table 64: Israel Pill Box Volume (K) Forecast, by Application 2020 & 2033
- Table 65: GCC Pill Box Revenue (million) Forecast, by Application 2020 & 2033
- Table 66: GCC Pill Box Volume (K) Forecast, by Application 2020 & 2033
- Table 67: North Africa Pill Box Revenue (million) Forecast, by Application 2020 & 2033
- Table 68: North Africa Pill Box Volume (K) Forecast, by Application 2020 & 2033
- Table 69: South Africa Pill Box Revenue (million) Forecast, by Application 2020 & 2033
- Table 70: South Africa Pill Box Volume (K) Forecast, by Application 2020 & 2033
- Table 71: Rest of Middle East & Africa Pill Box Revenue (million) Forecast, by Application 2020 & 2033
- Table 72: Rest of Middle East & Africa Pill Box Volume (K) Forecast, by Application 2020 & 2033
- Table 73: Global Pill Box Revenue million Forecast, by Application 2020 & 2033
- Table 74: Global Pill Box Volume K Forecast, by Application 2020 & 2033
- Table 75: Global Pill Box Revenue million Forecast, by Types 2020 & 2033
- Table 76: Global Pill Box Volume K Forecast, by Types 2020 & 2033
- Table 77: Global Pill Box Revenue million Forecast, by Country 2020 & 2033
- Table 78: Global Pill Box Volume K Forecast, by Country 2020 & 2033
- Table 79: China Pill Box Revenue (million) Forecast, by Application 2020 & 2033
- Table 80: China Pill Box Volume (K) Forecast, by Application 2020 & 2033
- Table 81: India Pill Box Revenue (million) Forecast, by Application 2020 & 2033
- Table 82: India Pill Box Volume (K) Forecast, by Application 2020 & 2033
- Table 83: Japan Pill Box Revenue (million) Forecast, by Application 2020 & 2033
- Table 84: Japan Pill Box Volume (K) Forecast, by Application 2020 & 2033
- Table 85: South Korea Pill Box Revenue (million) Forecast, by Application 2020 & 2033
- Table 86: South Korea Pill Box Volume (K) Forecast, by Application 2020 & 2033
- Table 87: ASEAN Pill Box Revenue (million) Forecast, by Application 2020 & 2033
- Table 88: ASEAN Pill Box Volume (K) Forecast, by Application 2020 & 2033
- Table 89: Oceania Pill Box Revenue (million) Forecast, by Application 2020 & 2033
- Table 90: Oceania Pill Box Volume (K) Forecast, by Application 2020 & 2033
- Table 91: Rest of Asia Pacific Pill Box Revenue (million) Forecast, by Application 2020 & 2033
- Table 92: Rest of Asia Pacific Pill Box Volume (K) Forecast, by Application 2020 & 2033
Frequently Asked Questions
1. What is the projected Compound Annual Growth Rate (CAGR) of the Pill Box?
The projected CAGR is approximately XX%.
2. Which companies are prominent players in the Pill Box?
Key companies in the market include Alert 1, Yong Yue Medical Technology, Mdose, Valiamo, Apple Biomedical, Bioland, VRI, Caretronic, Gima, H+H SYSTEM, Praticima, MedMinder, Robotik Technology, Romed Holland, Ningbo Yifeng Lifecare, Tayg Clinic, Sanner, HI-LIFE TECHNOLOGY, JMS Healthcare, Kibodan, Medinox, Dosepack India, Enfermania, Francehopital, Tunstall, Union Plastic, ZARGESMedissimo, Parsons ADL, Suzhou SunMed, MedSignals.
3. What are the main segments of the Pill Box?
The market segments include Application, Types.
4. Can you provide details about the market size?
The market size is estimated to be USD XXX million as of 2022.
5. What are some drivers contributing to market growth?
N/A
6. What are the notable trends driving market growth?
N/A
7. Are there any restraints impacting market growth?
N/A
8. Can you provide examples of recent developments in the market?
N/A
9. What pricing options are available for accessing the report?
Pricing options include single-user, multi-user, and enterprise licenses priced at USD 3950.00, USD 5925.00, and USD 7900.00 respectively.
10. Is the market size provided in terms of value or volume?
The market size is provided in terms of value, measured in million and volume, measured in K.
11. Are there any specific market keywords associated with the report?
Yes, the market keyword associated with the report is "Pill Box," which aids in identifying and referencing the specific market segment covered.
12. How do I determine which pricing option suits my needs best?
The pricing options vary based on user requirements and access needs. Individual users may opt for single-user licenses, while businesses requiring broader access may choose multi-user or enterprise licenses for cost-effective access to the report.
13. Are there any additional resources or data provided in the Pill Box report?
While the report offers comprehensive insights, it's advisable to review the specific contents or supplementary materials provided to ascertain if additional resources or data are available.
14. How can I stay updated on further developments or reports in the Pill Box?
To stay informed about further developments, trends, and reports in the Pill Box, consider subscribing to industry newsletters, following relevant companies and organizations, or regularly checking reputable industry news sources and publications.
Methodology
Step 1 - Identification of Relevant Samples Size from Population Database


Step 2 - Approaches for Defining Global Market Size (Value, Volume* & Price*)

Note*: In applicable scenarios
Step 3 - Data Sources
Primary Research
- Web Analytics
- Survey Reports
- Research Institute
- Latest Research Reports
- Opinion Leaders
Secondary Research
- Annual Reports
- White Paper
- Latest Press Release
- Industry Association
- Paid Database
- Investor Presentations

Step 4 - Data Triangulation
Involves using different sources of information in order to increase the validity of a study
These sources are likely to be stakeholders in a program - participants, other researchers, program staff, other community members, and so on.
Then we put all data in single framework & apply various statistical tools to find out the dynamic on the market.
During the analysis stage, feedback from the stakeholder groups would be compared to determine areas of agreement as well as areas of divergence