

Key Insights
The Oral Scanning Components market is experiencing robust growth, projected to reach USD 1.1 billion in 2024. This expansion is driven by increasing adoption of digital dentistry solutions, advancements in imaging technology, and a rising demand for minimally invasive dental procedures. The market is characterized by its dynamic nature, with continuous innovation in areas such as high-resolution image sensors and sophisticated lens systems, enhancing the accuracy and efficiency of intraoral scanning. Dental clinics are increasingly investing in these components to improve patient diagnostics, treatment planning, and restorative workflows, leading to better patient outcomes and a more streamlined practice. Furthermore, the growing prevalence of dental malocclusions and aesthetic concerns globally is fueling the demand for orthodontic treatments that rely heavily on precise digital impressions, thereby acting as a significant growth catalyst for oral scanning components.
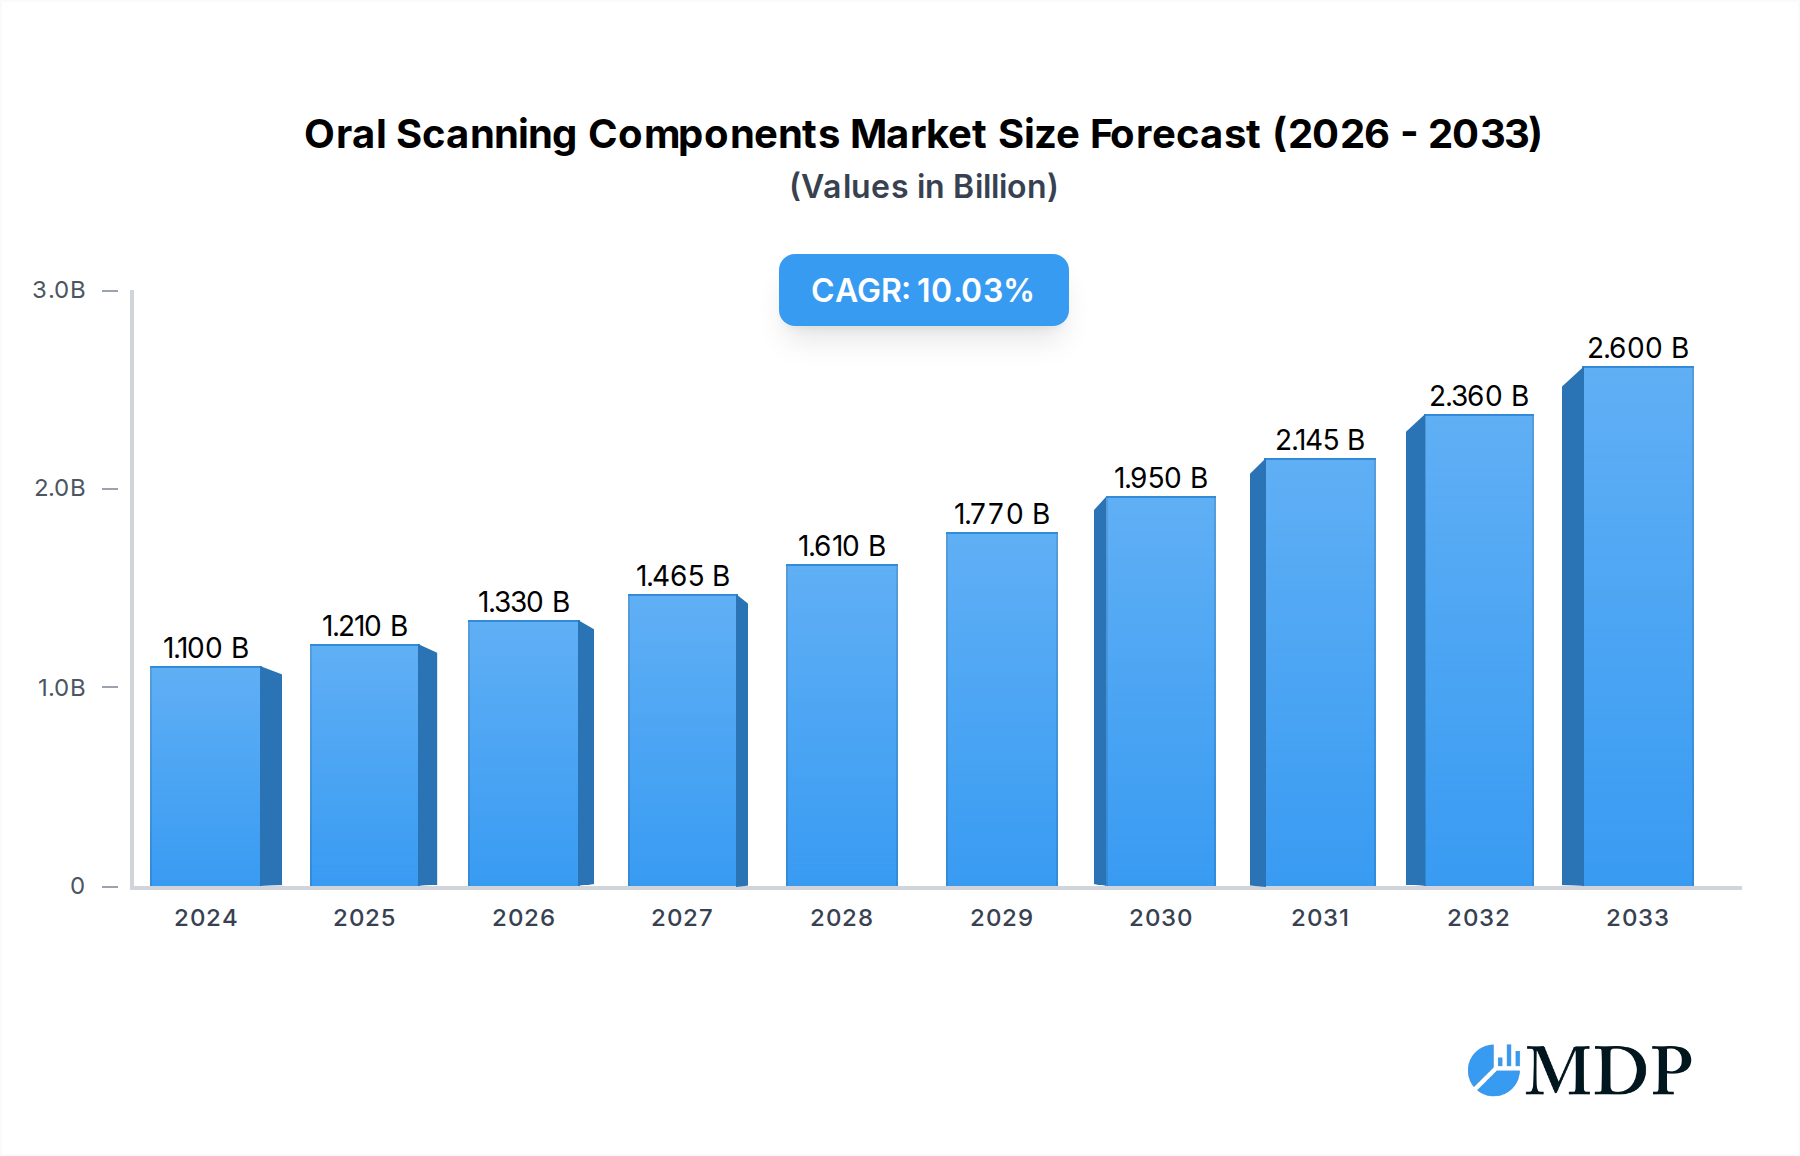
Oral Scanning Components Market Size (In Billion)
The market is anticipated to grow at a Compound Annual Growth Rate (CAGR) of 9.9% over the forecast period of 2025-2033. This impressive growth trajectory is supported by key trends including the miniaturization and enhanced portability of scanning devices, improvements in connectivity interfaces for seamless data integration, and the expanding application of these components beyond traditional dental clinics into hospitals and other healthcare settings. While the market benefits from these drivers, potential restraints include the high initial investment cost for advanced scanning systems, the need for continuous training and upskilling of dental professionals to effectively utilize new technologies, and regulatory hurdles in certain regions. However, the long-term outlook remains highly positive, with Asia Pacific and North America expected to lead market expansion due to high technological adoption rates and a strong presence of key market players.

Oral Scanning Components Company Market Share
This comprehensive report delves into the dynamic global market for Oral Scanning Components, a critical element in the advancement of digital dentistry. Spanning the historical period of 2019–2024, with a base year of 2025 and a robust forecast period extending to 2033, this analysis offers in-depth insights into market trends, growth drivers, competitive landscapes, and future opportunities. We examine the intricate interplay of technological innovation, evolving consumer preferences, and stringent regulatory frameworks that are shaping the trajectory of this rapidly expanding sector. With projected market valuations in the billions, this report is an essential resource for manufacturers, technology providers, dental professionals, investors, and industry stakeholders seeking to navigate and capitalize on the future of oral scanning.
Oral Scanning Components Market Dynamics & Concentration
The Oral Scanning Components market, valued in the billions, exhibits a moderate concentration, with a few dominant players holding significant market share. Key innovation drivers include the relentless pursuit of higher resolution, faster scanning speeds, and miniaturization of components. Regulatory frameworks, particularly those pertaining to medical device manufacturing and data privacy, play a crucial role in market entry and product development. Product substitutes, while evolving, are largely limited to traditional impression materials, facing increasing displacement by digital workflows. End-user trends point towards a growing demand for user-friendly, portable, and cost-effective scanning solutions, especially within dental clinics. Mergers and acquisitions (M&A) activity is a notable feature, with an estimated XX number of significant deals in the historical period, as larger companies seek to integrate cutting-edge technologies and expand their product portfolios.
- Market Concentration: Moderate, with key players like Planmeca, 3Shape, and Dentsply Sirona holding substantial market influence.
- Innovation Drivers: Enhanced accuracy, reduced scan times, improved software integration, and the development of AI-powered diagnostic tools.
- Regulatory Frameworks: FDA approval for medical devices, CE marking in Europe, and evolving data security standards (e.g., HIPAA compliance).
- Product Substitutes: Traditional dental impressions, though their market share is steadily declining.
- End-User Trends: Increasing adoption in general dentistry, orthodontics, and implantology; growing demand for chairside scanning.
- M&A Activities: Strategic acquisitions to gain access to proprietary technologies and expand market reach. Estimated XX significant M&A deals in the historical period.
Oral Scanning Components Industry Trends & Analysis
The Oral Scanning Components industry is experiencing robust growth, projected to continue at a substantial Compound Annual Growth Rate (CAGR) in the billions across the forecast period. This expansion is primarily fueled by the accelerating digital transformation within the dental sector. Increasing awareness among dental professionals about the benefits of intraoral scanners, such as improved patient comfort, enhanced treatment planning, and faster turnaround times for restorations, is a significant market growth driver. Technological disruptions, including advancements in CMOS image sensors, compact lighting systems, and sophisticated lens assemblies, are enabling the creation of more powerful and versatile scanning devices. Consumer preferences are shifting towards minimally invasive procedures and aesthetically pleasing outcomes, which digital dentistry, powered by accurate oral scanning, facilitates.
The competitive landscape is characterized by intense innovation and strategic collaborations. Companies are investing heavily in research and development to refine sensor technology, improve data processing algorithms, and enhance the user interface of their scanning components. The market penetration of intraoral scanners, a key indicator of the demand for these components, is rising steadily, particularly in developed economies. The integration of AI and machine learning into scanning software is further enhancing diagnostic capabilities and workflow efficiency. The development of smaller, lighter, and more ergonomic scanning wands, incorporating advanced connectivity interfaces, is also a key trend. The global market size for oral scanning components is estimated to reach XX billion by 2025 and is projected to grow to XX billion by 2033. The CAGR for the forecast period is estimated to be XX%.
Leading Markets & Segments in Oral Scanning Components
The global Oral Scanning Components market is witnessing significant dominance in the Application: Dental Clinics segment, driven by the widespread adoption of digital workflows in everyday dental practice. This segment alone accounts for a substantial portion of the market valuation, estimated to be in the billions. Within the Types of oral scanning components, Image Sensors and Lighting Systems are pivotal, representing the technological core of modern intraoral scanners.
Dominant Application Segment: Dental Clinics
- Key Drivers: Growing emphasis on patient experience and chairside convenience, increasing demand for same-day restorations, and the need for improved diagnostic accuracy in general dentistry.
- Market Penetration: High and continuously growing, with a significant percentage of modern dental practices equipped with digital scanning capabilities.
- Economic Policies: Government initiatives and private sector investments aimed at modernizing healthcare infrastructure indirectly support the adoption of digital dental technologies.
- Technological Adoption: Dental professionals are actively seeking out advanced tools to enhance their diagnostic and treatment planning processes.
Dominant Component Types:
- Image Sensors: The demand for high-resolution, fast-capturing CMOS and CCD sensors is paramount. Advancements in pixel density and sensitivity are crucial for detailed scans.
- Lighting Systems: Efficient and precise LED lighting solutions are essential for accurate color rendering and artifact reduction during scanning.
- Lens Systems: Optimized optics are critical for achieving distortion-free images and capturing fine details of oral structures.
The Asia-Pacific region, particularly countries like China and South Korea, is emerging as a significant growth engine due to rapid market penetration and increasing local manufacturing capabilities. However, North America and Europe continue to represent the largest markets by value, driven by higher disposable incomes and established digital dental infrastructures. The Connection Interface segment is also crucial, with a trend towards wireless and high-speed wired connections for seamless data transfer and integration with other dental software.
Oral Scanning Components Product Developments
Recent product developments in Oral Scanning Components are focused on enhancing precision, speed, and user experience. Innovations in advanced CMOS sensor technology are delivering higher resolution scans, enabling dentists to capture intricate details of teeth and soft tissues with unparalleled accuracy. Miniaturized and efficient LED lighting systems are improving color accuracy and reducing scanning artifacts. Furthermore, the development of compact, high-performance lens systems is contributing to the creation of smaller and more ergonomic intraoral scanners. These advancements are crucial for facilitating faster chairside workflows, improving diagnostic capabilities for conditions like caries and periodontal disease, and enabling seamless integration with CAD/CAM systems for restorative dentistry.
Key Drivers of Oral Scanning Components Growth
The Oral Scanning Components market is propelled by several interconnected growth drivers. Technological advancements, particularly in sensor technology, miniaturization, and data processing, are enabling the development of more sophisticated and affordable scanning solutions. The increasing adoption of digital dentistry practices by dental clinics worldwide, driven by the demand for improved patient care and treatment efficiency, is a primary catalyst. Furthermore, the growing prevalence of dental malocclusions and the rising demand for orthodontic treatments, such as clear aligners, directly fuel the need for accurate intraoral scanning. Government initiatives promoting digital healthcare and favorable reimbursement policies for digital dental procedures also contribute to market expansion.
Challenges in the Oral Scanning Components Market
Despite its strong growth trajectory, the Oral Scanning Components market faces several challenges. High initial investment costs associated with advanced scanning systems can be a barrier for some smaller dental practices. Stringent regulatory approval processes for medical devices can lead to longer product development cycles and increased compliance expenses. The need for continuous software updates and integration with diverse existing dental technologies can also pose integration challenges for users. Furthermore, competitive pressures from established players and emerging manufacturers can lead to price erosion, impacting profit margins for component suppliers. Supply chain complexities for specialized electronic components can also present operational hurdles.
Emerging Opportunities in Oral Scanning Components
The Oral Scanning Components market is ripe with emerging opportunities. The burgeoning demand for AI-powered diagnostic tools integrated with scanning data presents a significant avenue for growth, enabling early detection of oral diseases. The expansion of telehealth and remote patient monitoring in dentistry will further necessitate reliable and high-quality scanning solutions. Strategic partnerships between component manufacturers and intraoral scanner companies are crucial for co-development and market penetration. Moreover, the untapped potential in emerging economies, where digital dentistry adoption is still in its nascent stages, offers substantial long-term growth prospects. The development of specialized scanning components for niche applications, such as prosthodontics and periodontics, also represents a promising area.
Leading Players in the Oral Scanning Components Sector
- Carestream
- Planmeca
- Dentsply Sirona
- Condor Dental
- 3Shape
- Dental Wings
- Align Technologies
- 3M ESPE
- Launca
- Shining 3D
- Vatech
- Ningbo Freqty Photoelectric Technology
- Shenzhen Fussen
Key Milestones in Oral Scanning Components Industry
- 2019: Introduction of AI-driven diagnostic features in intraoral scanning software.
- 2020: Significant advancements in CMOS sensor resolution and frame rates, enhancing scanning speed.
- 2021: Increased adoption of wireless connectivity interfaces for greater ease of use.
- 2022: Development of more compact and lightweight scanning wands, improving ergonomics.
- 2023: Growing integration of cloud-based data storage and sharing solutions for scanned data.
- 2024: Focus on further miniaturization of components and enhanced power efficiency in scanning devices.
Strategic Outlook for Oral Scanning Components Market
The strategic outlook for the Oral Scanning Components market is exceptionally positive, driven by sustained innovation and increasing market penetration of digital dentistry. Growth accelerators include the continuous miniaturization of components, leading to more portable and user-friendly intraoral scanners. The integration of advanced AI algorithms for real-time diagnostics and treatment planning will further enhance the value proposition. Expansion into emerging markets and the development of specialized components for advanced dental applications will unlock new revenue streams. Strategic collaborations between technology providers and dental manufacturers will remain critical for driving product development and market adoption, ensuring a robust future for this vital sector of the dental industry.
Oral Scanning Components Segmentation
-
1. Application
- 1.1. Dental Clinics
- 1.2. Hospitals
- 1.3. Others
-
2. Types
- 2.1. Lighting System
- 2.2. Lens Systems
- 2.3. Image Sensors
- 2.4. Connection Interface
- 2.5. Others
Oral Scanning Components Segmentation By Geography
-
1. North America
- 1.1. United States
- 1.2. Canada
- 1.3. Mexico
-
2. South America
- 2.1. Brazil
- 2.2. Argentina
- 2.3. Rest of South America
-
3. Europe
- 3.1. United Kingdom
- 3.2. Germany
- 3.3. France
- 3.4. Italy
- 3.5. Spain
- 3.6. Russia
- 3.7. Benelux
- 3.8. Nordics
- 3.9. Rest of Europe
-
4. Middle East & Africa
- 4.1. Turkey
- 4.2. Israel
- 4.3. GCC
- 4.4. North Africa
- 4.5. South Africa
- 4.6. Rest of Middle East & Africa
-
5. Asia Pacific
- 5.1. China
- 5.2. India
- 5.3. Japan
- 5.4. South Korea
- 5.5. ASEAN
- 5.6. Oceania
- 5.7. Rest of Asia Pacific
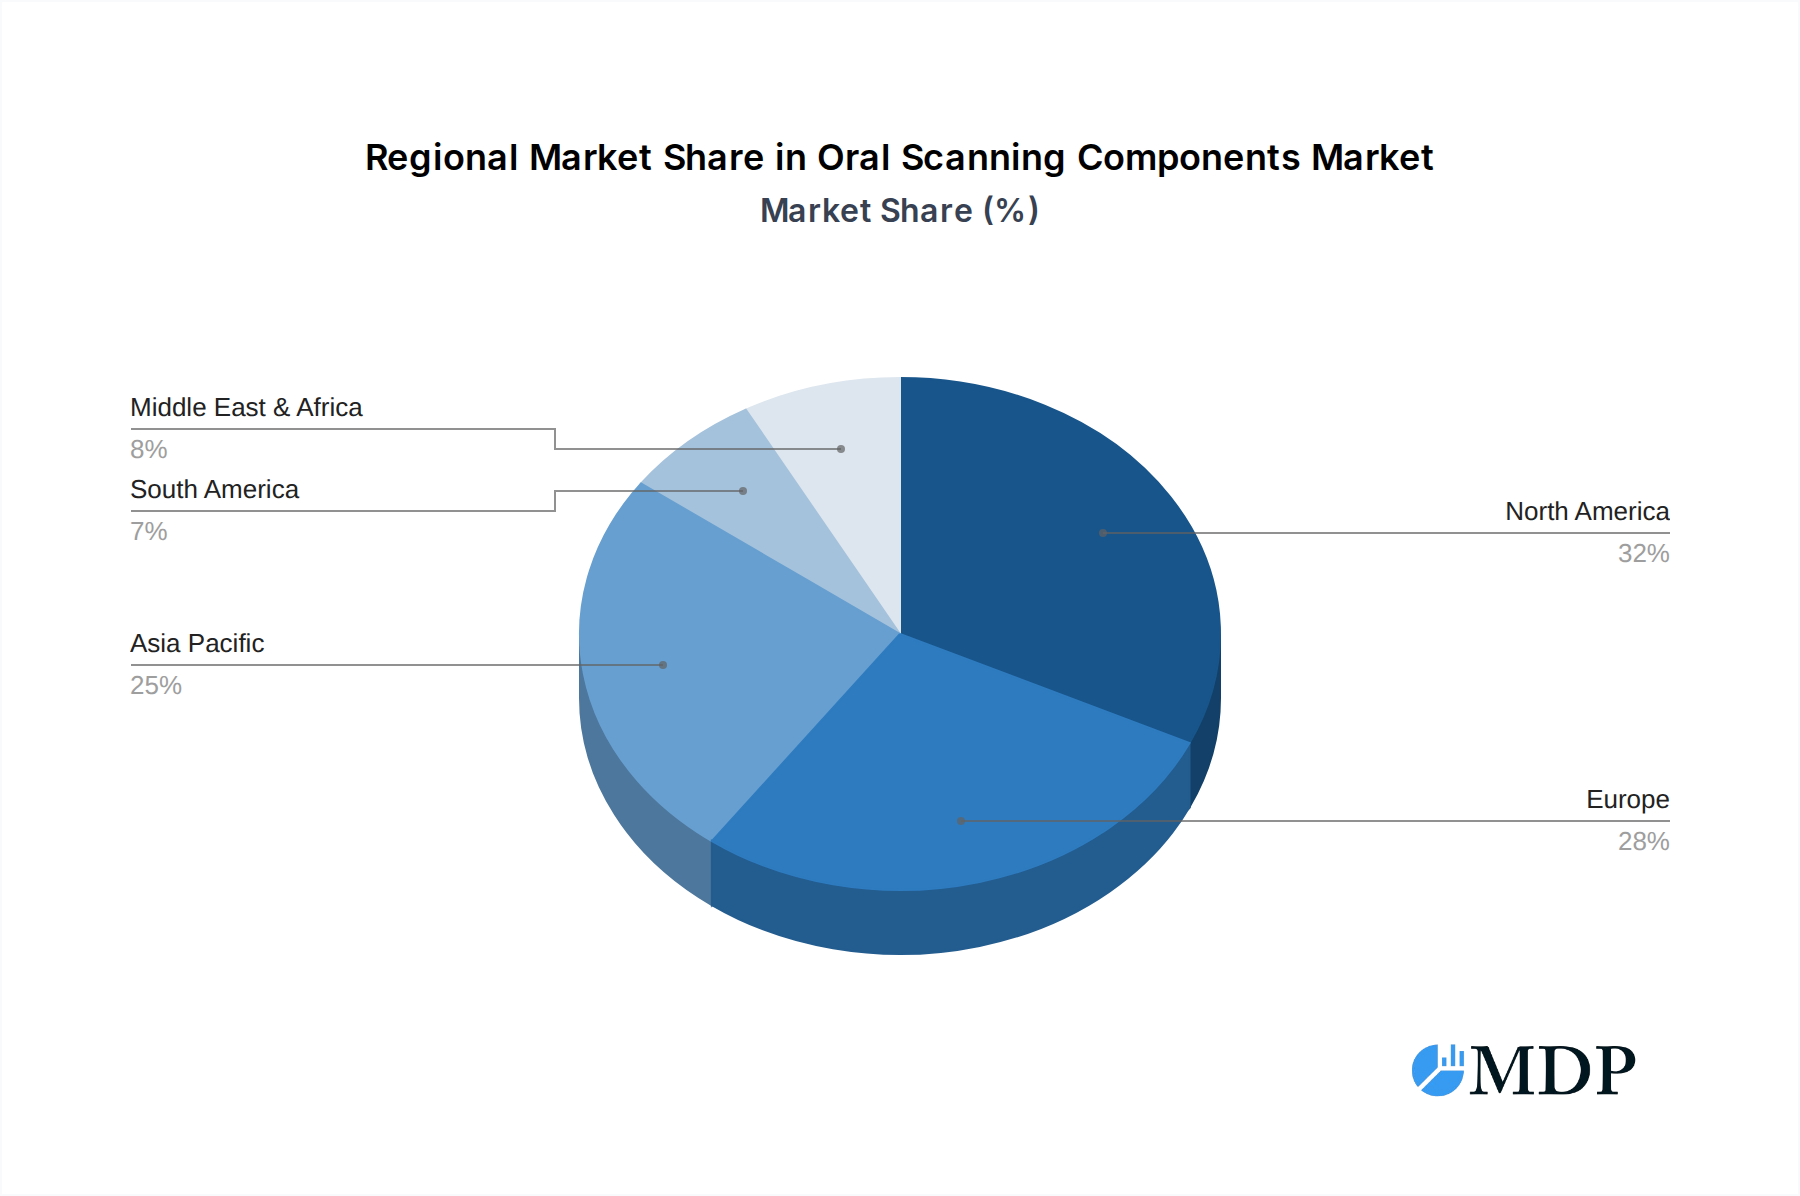
Oral Scanning Components Regional Market Share
Geographic Coverage of Oral Scanning Components
Oral Scanning Components REPORT HIGHLIGHTS
| Aspects | Details |
|---|---|
| Study Period | 2020-2034 |
| Base Year | 2025 |
| Estimated Year | 2026 |
| Forecast Period | 2026-2034 |
| Historical Period | 2020-2025 |
| Growth Rate | CAGR of 9.9% from 2020-2034 |
| Segmentation |
|
Table of Contents
- 1. Introduction
- 1.1. Research Scope
- 1.2. Market Segmentation
- 1.3. Research Methodology
- 1.4. Definitions and Assumptions
- 2. Executive Summary
- 2.1. Introduction
- 3. Market Dynamics
- 3.1. Introduction
- 3.2. Market Drivers
- 3.3. Market Restrains
- 3.4. Market Trends
- 4. Market Factor Analysis
- 4.1. Porters Five Forces
- 4.2. Supply/Value Chain
- 4.3. PESTEL analysis
- 4.4. Market Entropy
- 4.5. Patent/Trademark Analysis
- 5. Global Oral Scanning Components Analysis, Insights and Forecast, 2020-2032
- 5.1. Market Analysis, Insights and Forecast - by Application
- 5.1.1. Dental Clinics
- 5.1.2. Hospitals
- 5.1.3. Others
- 5.2. Market Analysis, Insights and Forecast - by Types
- 5.2.1. Lighting System
- 5.2.2. Lens Systems
- 5.2.3. Image Sensors
- 5.2.4. Connection Interface
- 5.2.5. Others
- 5.3. Market Analysis, Insights and Forecast - by Region
- 5.3.1. North America
- 5.3.2. South America
- 5.3.3. Europe
- 5.3.4. Middle East & Africa
- 5.3.5. Asia Pacific
- 5.1. Market Analysis, Insights and Forecast - by Application
- 6. North America Oral Scanning Components Analysis, Insights and Forecast, 2020-2032
- 6.1. Market Analysis, Insights and Forecast - by Application
- 6.1.1. Dental Clinics
- 6.1.2. Hospitals
- 6.1.3. Others
- 6.2. Market Analysis, Insights and Forecast - by Types
- 6.2.1. Lighting System
- 6.2.2. Lens Systems
- 6.2.3. Image Sensors
- 6.2.4. Connection Interface
- 6.2.5. Others
- 6.1. Market Analysis, Insights and Forecast - by Application
- 7. South America Oral Scanning Components Analysis, Insights and Forecast, 2020-2032
- 7.1. Market Analysis, Insights and Forecast - by Application
- 7.1.1. Dental Clinics
- 7.1.2. Hospitals
- 7.1.3. Others
- 7.2. Market Analysis, Insights and Forecast - by Types
- 7.2.1. Lighting System
- 7.2.2. Lens Systems
- 7.2.3. Image Sensors
- 7.2.4. Connection Interface
- 7.2.5. Others
- 7.1. Market Analysis, Insights and Forecast - by Application
- 8. Europe Oral Scanning Components Analysis, Insights and Forecast, 2020-2032
- 8.1. Market Analysis, Insights and Forecast - by Application
- 8.1.1. Dental Clinics
- 8.1.2. Hospitals
- 8.1.3. Others
- 8.2. Market Analysis, Insights and Forecast - by Types
- 8.2.1. Lighting System
- 8.2.2. Lens Systems
- 8.2.3. Image Sensors
- 8.2.4. Connection Interface
- 8.2.5. Others
- 8.1. Market Analysis, Insights and Forecast - by Application
- 9. Middle East & Africa Oral Scanning Components Analysis, Insights and Forecast, 2020-2032
- 9.1. Market Analysis, Insights and Forecast - by Application
- 9.1.1. Dental Clinics
- 9.1.2. Hospitals
- 9.1.3. Others
- 9.2. Market Analysis, Insights and Forecast - by Types
- 9.2.1. Lighting System
- 9.2.2. Lens Systems
- 9.2.3. Image Sensors
- 9.2.4. Connection Interface
- 9.2.5. Others
- 9.1. Market Analysis, Insights and Forecast - by Application
- 10. Asia Pacific Oral Scanning Components Analysis, Insights and Forecast, 2020-2032
- 10.1. Market Analysis, Insights and Forecast - by Application
- 10.1.1. Dental Clinics
- 10.1.2. Hospitals
- 10.1.3. Others
- 10.2. Market Analysis, Insights and Forecast - by Types
- 10.2.1. Lighting System
- 10.2.2. Lens Systems
- 10.2.3. Image Sensors
- 10.2.4. Connection Interface
- 10.2.5. Others
- 10.1. Market Analysis, Insights and Forecast - by Application
- 11. Competitive Analysis
- 11.1. Global Market Share Analysis 2025
- 11.2. Company Profiles
- 11.2.1 Carestream
- 11.2.1.1. Overview
- 11.2.1.2. Products
- 11.2.1.3. SWOT Analysis
- 11.2.1.4. Recent Developments
- 11.2.1.5. Financials (Based on Availability)
- 11.2.2 Planmeca
- 11.2.2.1. Overview
- 11.2.2.2. Products
- 11.2.2.3. SWOT Analysis
- 11.2.2.4. Recent Developments
- 11.2.2.5. Financials (Based on Availability)
- 11.2.3 Dentsply Sirona
- 11.2.3.1. Overview
- 11.2.3.2. Products
- 11.2.3.3. SWOT Analysis
- 11.2.3.4. Recent Developments
- 11.2.3.5. Financials (Based on Availability)
- 11.2.4 Condor Dental
- 11.2.4.1. Overview
- 11.2.4.2. Products
- 11.2.4.3. SWOT Analysis
- 11.2.4.4. Recent Developments
- 11.2.4.5. Financials (Based on Availability)
- 11.2.5 3Shape
- 11.2.5.1. Overview
- 11.2.5.2. Products
- 11.2.5.3. SWOT Analysis
- 11.2.5.4. Recent Developments
- 11.2.5.5. Financials (Based on Availability)
- 11.2.6 Dental Wings
- 11.2.6.1. Overview
- 11.2.6.2. Products
- 11.2.6.3. SWOT Analysis
- 11.2.6.4. Recent Developments
- 11.2.6.5. Financials (Based on Availability)
- 11.2.7 Align Technologies
- 11.2.7.1. Overview
- 11.2.7.2. Products
- 11.2.7.3. SWOT Analysis
- 11.2.7.4. Recent Developments
- 11.2.7.5. Financials (Based on Availability)
- 11.2.8 3M ESPE
- 11.2.8.1. Overview
- 11.2.8.2. Products
- 11.2.8.3. SWOT Analysis
- 11.2.8.4. Recent Developments
- 11.2.8.5. Financials (Based on Availability)
- 11.2.9 Launca
- 11.2.9.1. Overview
- 11.2.9.2. Products
- 11.2.9.3. SWOT Analysis
- 11.2.9.4. Recent Developments
- 11.2.9.5. Financials (Based on Availability)
- 11.2.10 Shining 3D
- 11.2.10.1. Overview
- 11.2.10.2. Products
- 11.2.10.3. SWOT Analysis
- 11.2.10.4. Recent Developments
- 11.2.10.5. Financials (Based on Availability)
- 11.2.11 Vatech
- 11.2.11.1. Overview
- 11.2.11.2. Products
- 11.2.11.3. SWOT Analysis
- 11.2.11.4. Recent Developments
- 11.2.11.5. Financials (Based on Availability)
- 11.2.12 Ningbo Freqty Photoelectric Technology
- 11.2.12.1. Overview
- 11.2.12.2. Products
- 11.2.12.3. SWOT Analysis
- 11.2.12.4. Recent Developments
- 11.2.12.5. Financials (Based on Availability)
- 11.2.13 Shenzhen Fussen
- 11.2.13.1. Overview
- 11.2.13.2. Products
- 11.2.13.3. SWOT Analysis
- 11.2.13.4. Recent Developments
- 11.2.13.5. Financials (Based on Availability)
- 11.2.1 Carestream
List of Figures
- Figure 1: Global Oral Scanning Components Revenue Breakdown (undefined, %) by Region 2025 & 2033
- Figure 2: North America Oral Scanning Components Revenue (undefined), by Application 2025 & 2033
- Figure 3: North America Oral Scanning Components Revenue Share (%), by Application 2025 & 2033
- Figure 4: North America Oral Scanning Components Revenue (undefined), by Types 2025 & 2033
- Figure 5: North America Oral Scanning Components Revenue Share (%), by Types 2025 & 2033
- Figure 6: North America Oral Scanning Components Revenue (undefined), by Country 2025 & 2033
- Figure 7: North America Oral Scanning Components Revenue Share (%), by Country 2025 & 2033
- Figure 8: South America Oral Scanning Components Revenue (undefined), by Application 2025 & 2033
- Figure 9: South America Oral Scanning Components Revenue Share (%), by Application 2025 & 2033
- Figure 10: South America Oral Scanning Components Revenue (undefined), by Types 2025 & 2033
- Figure 11: South America Oral Scanning Components Revenue Share (%), by Types 2025 & 2033
- Figure 12: South America Oral Scanning Components Revenue (undefined), by Country 2025 & 2033
- Figure 13: South America Oral Scanning Components Revenue Share (%), by Country 2025 & 2033
- Figure 14: Europe Oral Scanning Components Revenue (undefined), by Application 2025 & 2033
- Figure 15: Europe Oral Scanning Components Revenue Share (%), by Application 2025 & 2033
- Figure 16: Europe Oral Scanning Components Revenue (undefined), by Types 2025 & 2033
- Figure 17: Europe Oral Scanning Components Revenue Share (%), by Types 2025 & 2033
- Figure 18: Europe Oral Scanning Components Revenue (undefined), by Country 2025 & 2033
- Figure 19: Europe Oral Scanning Components Revenue Share (%), by Country 2025 & 2033
- Figure 20: Middle East & Africa Oral Scanning Components Revenue (undefined), by Application 2025 & 2033
- Figure 21: Middle East & Africa Oral Scanning Components Revenue Share (%), by Application 2025 & 2033
- Figure 22: Middle East & Africa Oral Scanning Components Revenue (undefined), by Types 2025 & 2033
- Figure 23: Middle East & Africa Oral Scanning Components Revenue Share (%), by Types 2025 & 2033
- Figure 24: Middle East & Africa Oral Scanning Components Revenue (undefined), by Country 2025 & 2033
- Figure 25: Middle East & Africa Oral Scanning Components Revenue Share (%), by Country 2025 & 2033
- Figure 26: Asia Pacific Oral Scanning Components Revenue (undefined), by Application 2025 & 2033
- Figure 27: Asia Pacific Oral Scanning Components Revenue Share (%), by Application 2025 & 2033
- Figure 28: Asia Pacific Oral Scanning Components Revenue (undefined), by Types 2025 & 2033
- Figure 29: Asia Pacific Oral Scanning Components Revenue Share (%), by Types 2025 & 2033
- Figure 30: Asia Pacific Oral Scanning Components Revenue (undefined), by Country 2025 & 2033
- Figure 31: Asia Pacific Oral Scanning Components Revenue Share (%), by Country 2025 & 2033
List of Tables
- Table 1: Global Oral Scanning Components Revenue undefined Forecast, by Application 2020 & 2033
- Table 2: Global Oral Scanning Components Revenue undefined Forecast, by Types 2020 & 2033
- Table 3: Global Oral Scanning Components Revenue undefined Forecast, by Region 2020 & 2033
- Table 4: Global Oral Scanning Components Revenue undefined Forecast, by Application 2020 & 2033
- Table 5: Global Oral Scanning Components Revenue undefined Forecast, by Types 2020 & 2033
- Table 6: Global Oral Scanning Components Revenue undefined Forecast, by Country 2020 & 2033
- Table 7: United States Oral Scanning Components Revenue (undefined) Forecast, by Application 2020 & 2033
- Table 8: Canada Oral Scanning Components Revenue (undefined) Forecast, by Application 2020 & 2033
- Table 9: Mexico Oral Scanning Components Revenue (undefined) Forecast, by Application 2020 & 2033
- Table 10: Global Oral Scanning Components Revenue undefined Forecast, by Application 2020 & 2033
- Table 11: Global Oral Scanning Components Revenue undefined Forecast, by Types 2020 & 2033
- Table 12: Global Oral Scanning Components Revenue undefined Forecast, by Country 2020 & 2033
- Table 13: Brazil Oral Scanning Components Revenue (undefined) Forecast, by Application 2020 & 2033
- Table 14: Argentina Oral Scanning Components Revenue (undefined) Forecast, by Application 2020 & 2033
- Table 15: Rest of South America Oral Scanning Components Revenue (undefined) Forecast, by Application 2020 & 2033
- Table 16: Global Oral Scanning Components Revenue undefined Forecast, by Application 2020 & 2033
- Table 17: Global Oral Scanning Components Revenue undefined Forecast, by Types 2020 & 2033
- Table 18: Global Oral Scanning Components Revenue undefined Forecast, by Country 2020 & 2033
- Table 19: United Kingdom Oral Scanning Components Revenue (undefined) Forecast, by Application 2020 & 2033
- Table 20: Germany Oral Scanning Components Revenue (undefined) Forecast, by Application 2020 & 2033
- Table 21: France Oral Scanning Components Revenue (undefined) Forecast, by Application 2020 & 2033
- Table 22: Italy Oral Scanning Components Revenue (undefined) Forecast, by Application 2020 & 2033
- Table 23: Spain Oral Scanning Components Revenue (undefined) Forecast, by Application 2020 & 2033
- Table 24: Russia Oral Scanning Components Revenue (undefined) Forecast, by Application 2020 & 2033
- Table 25: Benelux Oral Scanning Components Revenue (undefined) Forecast, by Application 2020 & 2033
- Table 26: Nordics Oral Scanning Components Revenue (undefined) Forecast, by Application 2020 & 2033
- Table 27: Rest of Europe Oral Scanning Components Revenue (undefined) Forecast, by Application 2020 & 2033
- Table 28: Global Oral Scanning Components Revenue undefined Forecast, by Application 2020 & 2033
- Table 29: Global Oral Scanning Components Revenue undefined Forecast, by Types 2020 & 2033
- Table 30: Global Oral Scanning Components Revenue undefined Forecast, by Country 2020 & 2033
- Table 31: Turkey Oral Scanning Components Revenue (undefined) Forecast, by Application 2020 & 2033
- Table 32: Israel Oral Scanning Components Revenue (undefined) Forecast, by Application 2020 & 2033
- Table 33: GCC Oral Scanning Components Revenue (undefined) Forecast, by Application 2020 & 2033
- Table 34: North Africa Oral Scanning Components Revenue (undefined) Forecast, by Application 2020 & 2033
- Table 35: South Africa Oral Scanning Components Revenue (undefined) Forecast, by Application 2020 & 2033
- Table 36: Rest of Middle East & Africa Oral Scanning Components Revenue (undefined) Forecast, by Application 2020 & 2033
- Table 37: Global Oral Scanning Components Revenue undefined Forecast, by Application 2020 & 2033
- Table 38: Global Oral Scanning Components Revenue undefined Forecast, by Types 2020 & 2033
- Table 39: Global Oral Scanning Components Revenue undefined Forecast, by Country 2020 & 2033
- Table 40: China Oral Scanning Components Revenue (undefined) Forecast, by Application 2020 & 2033
- Table 41: India Oral Scanning Components Revenue (undefined) Forecast, by Application 2020 & 2033
- Table 42: Japan Oral Scanning Components Revenue (undefined) Forecast, by Application 2020 & 2033
- Table 43: South Korea Oral Scanning Components Revenue (undefined) Forecast, by Application 2020 & 2033
- Table 44: ASEAN Oral Scanning Components Revenue (undefined) Forecast, by Application 2020 & 2033
- Table 45: Oceania Oral Scanning Components Revenue (undefined) Forecast, by Application 2020 & 2033
- Table 46: Rest of Asia Pacific Oral Scanning Components Revenue (undefined) Forecast, by Application 2020 & 2033
Frequently Asked Questions
1. What is the projected Compound Annual Growth Rate (CAGR) of the Oral Scanning Components?
The projected CAGR is approximately 9.9%.
2. Which companies are prominent players in the Oral Scanning Components?
Key companies in the market include Carestream, Planmeca, Dentsply Sirona, Condor Dental, 3Shape, Dental Wings, Align Technologies, 3M ESPE, Launca, Shining 3D, Vatech, Ningbo Freqty Photoelectric Technology, Shenzhen Fussen.
3. What are the main segments of the Oral Scanning Components?
The market segments include Application, Types.
4. Can you provide details about the market size?
The market size is estimated to be USD XXX N/A as of 2022.
5. What are some drivers contributing to market growth?
N/A
6. What are the notable trends driving market growth?
N/A
7. Are there any restraints impacting market growth?
N/A
8. Can you provide examples of recent developments in the market?
N/A
9. What pricing options are available for accessing the report?
Pricing options include single-user, multi-user, and enterprise licenses priced at USD 3950.00, USD 5925.00, and USD 7900.00 respectively.
10. Is the market size provided in terms of value or volume?
The market size is provided in terms of value, measured in N/A.
11. Are there any specific market keywords associated with the report?
Yes, the market keyword associated with the report is "Oral Scanning Components," which aids in identifying and referencing the specific market segment covered.
12. How do I determine which pricing option suits my needs best?
The pricing options vary based on user requirements and access needs. Individual users may opt for single-user licenses, while businesses requiring broader access may choose multi-user or enterprise licenses for cost-effective access to the report.
13. Are there any additional resources or data provided in the Oral Scanning Components report?
While the report offers comprehensive insights, it's advisable to review the specific contents or supplementary materials provided to ascertain if additional resources or data are available.
14. How can I stay updated on further developments or reports in the Oral Scanning Components?
To stay informed about further developments, trends, and reports in the Oral Scanning Components, consider subscribing to industry newsletters, following relevant companies and organizations, or regularly checking reputable industry news sources and publications.
Methodology
Step 1 - Identification of Relevant Samples Size from Population Database


Step 2 - Approaches for Defining Global Market Size (Value, Volume* & Price*)

Note*: In applicable scenarios
Step 3 - Data Sources
Primary Research
- Web Analytics
- Survey Reports
- Research Institute
- Latest Research Reports
- Opinion Leaders
Secondary Research
- Annual Reports
- White Paper
- Latest Press Release
- Industry Association
- Paid Database
- Investor Presentations

Step 4 - Data Triangulation
Involves using different sources of information in order to increase the validity of a study
These sources are likely to be stakeholders in a program - participants, other researchers, program staff, other community members, and so on.
Then we put all data in single framework & apply various statistical tools to find out the dynamic on the market.
During the analysis stage, feedback from the stakeholder groups would be compared to determine areas of agreement as well as areas of divergence